Effects of run sprint interval training on healthy, inactive, overweight/obese women: A pilot study
Abstract
This study examined the effects of a 12 week, treadmill-based, run sprint interval training (SIT) protocol compared with that of a moderate-intensity continuous training (MICT) protocol in healthy, inactive, overweight/obese women, on cardiovascular disease risk factors. After random assignment, the SIT group completed 4–10 × 30 s maximal sprints, with a 4 min active recovery between sprints, and the MICT group completed 30–60 min at moderate intensity (45–55% heart rate reserve (HRR)). The rate of perceived exertion (RPE) was recorded for each session, and perceived enjoyment was quantified every 3 weeks. Clinical and fitness testing were completed at baseline, 6 weeks, and 12 weeks. Twelve female participants (age: 34.1 ± 6.1; body mass index (BMI): 31.3 ± 6.8; VO2peak: 27.0 ± 6.2) completed the intervention. There were significant main effects for time for VO2peak (p = 0.001), body fat percentage (p = 0.001), and session RPE (p = 0.006). VO2peak improved 20.7% in the SIT group (n = 5) and 24.4% in the MICT group (n = 7). Body fat percentage reduced by 1.7% in the SIT group and 2.6% in the MICT group. Perceived enjoyment was similarly high between the groups despite higher session RPE in the SIT group (p = 0.441). SIT training on a motor-driven treadmill elicits similar improvements in oxygen utilization and body composition as moderate-intensity training in this population.
Introduction
Obesity levels in North America are at an all time high, with approximately one third of US adults and one quarter of Canadian adults considered obese (Gotay et al. 2013; Ogden et al. 2014). Current research has demonstrated that routine physical activity prevents and lowers the risk of cardiovascular disease by improving cardiovascular function, body composition, and blood lipid profile (Centers for Disease Control and Prevention (CDC) 2013). Despite recommendations from the American College of Sports Medicine that encourage 30 min of moderate-intensity exercise 5 days per week, or 20 min of vigorous physical activity 3 days per week (American College of Sports Medicine (ACSM) 2013), it has been estimated that only approximately 21% of American and 15% of Canadian adults actually meet these recommendations (Colley et al. 2011; CDC 2014). Current literature suggests that the lowest participation levels are in the overweight/obese population (Davis et al. 2006), emphasizing the need to examine exercise protocols that are enjoyable among this population to maximize adherence.
High-intensity interval training (HIIT) and sprint interval training (SIT) are low volume, high-intensity training protocols. HIIT protocols generally consist of repeated high-intensity bouts of activity at near-maximal heart rate (HR) (80%–100% max HR), separated by bouts of active recovery, with differing work–recovery ratios. In contrast, SIT characterizes training where the target intensity is greater than or equal to VO2max (Weston et al. 2014; Gibala et al. 2014). The present study followed an established, specific protocol that consists of a minimum of four 30 s maximal-effort sprints separated sometimes by four and other times by four and a half minutes of active recovery (Burgomaster et al. 2005, 2007, 2008; Gibala et al. 2006; Trilk et al. 2011; Whyte et al. 2013; Gist et al. 2014). Similar to traditional cardiovascular training, HIIT and SIT have been shown to elicit improvements in insulin sensitivity (Metcalfe et al. 2012), body composition, waist circumference, and abdominal fat mass (FM) (Gremeaux et al. 2012; Heydari et al. 2012) and VO2max (Trilk et al. 2011).
Traditional SIT protocols require braked cycle ergometers, but access to these machines is limited. Alternatively, a few studies have investigated run SIT using manually operated treadmills (Macpherson et al. 2011; Hazell et al. 2014); however these specialized treadmills are also not commonly available to the general public. Studies are yet to investigate the effects of run SIT using a standard, motorized treadmill. Comparable to the effects of traditional HIIT and SIT protocols, run SIT has been shown to evoke improvements in insulin sensitivity, low-density lipoprotein cholesterol (LDL-C), VO2max, and body composition (Macpherson et al. 2011; Sandvei et al. 2012; Hazell et al. 2014). Run SIT interventions have varied in length, ranging from 4 (Iaia et al. 2009) to 10 weeks in duration (Esfarjani and Laursen 2007). Many of these studies examined recreationally active, normal BMI participants, limiting the potential for generalization and translation of the current research to the obese population. In addition, an extended protocol (beyond 10 weeks) has not been investigated in a sedentary, obese population.
Thus, the purpose of this study was to examine the effects of a 12 week run SIT protocol compared with that of a moderate-intensity continuous training (MICT) protocol on cardiovascular disease risk factors in a sample of healthy, inactive, overweight/obese women. We also examined the differences in perceived enjoyment and session RPE between the training protocols.
Methods
Fifteen inactive, overweight/obese women (33.6 ± 1.7 years of age, 31.3 ± 6.8 kg/m2 BMI) were recruited to participate in this pilot study. Participants were included if they were free from known cardiovascular, pulmonary, or metabolic disease, were not currently pregnant or postmenopausal, did not possess any known orthopedic issues, and had been inactive for at least three months prior to beginning the study, as assessed by the physical activity readiness questionnaire (PAR-Q) and the recreational physical activity and exercise portion of the International Physical Activity Questionnaire (Part 4). Participants were required to have a BMI greater than 25 kg/m2; those with a BMI greater than 34.9 kg/m2 were required to seek medical approval before beginning the intervention. Upon consenting to the procedures approved by the Internal Review Board of James Madison University, participants were randomly divided into one of two groups: the experimental run SIT protocol group, or the reference MICT protocol group.
Study design
Participants completed either a run SIT protocol or MICT protocol 3 days per week in a laboratory setting on an electric motor treadmill, in a 12 week, randomized experimental protocol. Prior to participants coming in for the first visit where they consented to the study, researchers randomized the order in which the participant folders would be distributed. The first visit was scheduled in block times, and participants were assigned the first folder at the top of the stack as they entered the room. Both protocols progressed in 3 week increments. Baseline, 6, and 12 week measures were taken on all participants, which included VO2peak, body composition, fasting blood draw, and perceived enjoyment. Session RPE was taken at the end of every session and averaged over 3 weeks, in line with the progression of the intervention. Participants were instructed to maintain their usual diet. Figure 1 illustrates the study design and intervention protocol.
Fig. 1.
Familiarization
During the first session, participants provided participation consent and were familiarized with the metabolic mask and aerobic fitness testing procedures at a self-selected treadmill (HP Cosmos T170, Cosmed, Rome, Italy) speed. At this time, participants also completed a baseline Physical Activity Enjoyment Scale (PACES) questionnaire. Fitness and clinical measures were scheduled for separate days with clinical testing occurring in the morning. Prior to both fitness and clinical testing, participants were instructed to abstain from alcohol, caffeine, food and beverages (except water), and physical activity for a minimum of 4 h before fitness testing, and for 12 h before clinical testing.
Measures
Resting heart rate and blood pressure
Resting HR was recorded using a 30 s radial artery manual palpitation following at least 10 min of seated rest. Blood pressure was recorded using the Prosphyg Standard Aneroid sphygmomanometer (American Diagnostic Corporation, Hauppauge, New York, USA) and an Adscope-lite stethoscope (American Diagnostic Corporation, Hauppauge, New York, USA) method following at least 10 min of seated rest. Both measurements were repeated and averaged.
VO2peak
Aerobic fitness testing was performed on an HP Cosmos T170 treadmill (Cosmed, Rome, Italy) using the Quark b2 metabolic cart (baseline measures) or the K4b2 Portable Metabolic Unit (Cosmed, Rome, Italy; midline and follow-up measures), which have been shown to have acceptable agreement (Eisenmann et al. 2003). Standard calibration protocol was followed prior to each VO2 test, including calibration gas, ambient air, and breath by breath syncing. HR was monitored throughout the test using a Polar HR monitor (Polar Heart Rate, Lake Success, New York, USA), and RPE was recorded at the end of each stage. Participants began with a 3 min warm up at 0% grade. After the warm up, speed was increased to a self-selected speed which remained constant throughout the test. Percent grade increased by 2.5% every 3 min until volitional fatigue. Post-test analysis investigated the following variables to determine if maximal effort had been achieved: a HR within 10 beats of age-predicted HRmax, a respiratory exchange rate of 1.1 or higher, or an RPE of 19 out of 20. These analyses confirmed that maximal effort had been reached in all but two tests.
Body composition
Height was measured without shoes to the nearest 0.5 cm using a stadiometer, and weight was obtained without shoes using a calibrated balance scale (Detecto, Webb City, Missouri, USA) and estimated to the nearest 0.1 kg. Height and weight were used to calculate body mass index (BMI kg/m2). Dual-energy X-ray absorptiometry (DXA) to analyze body composition was performed using either the GE Prodigy Lunar Whole Body Scan (GE Medical Systems, Madison, Wisconsin, USA) or the GE iDXA (GE Medical Systems, Madison, Wisconsin, USA), with each participant completing all three of their respective measurements on the same machine. Total body fat percentage, lean body mass (LBM), and total FM were analyzed.
Blood testing
Blood samples (approximately 50 μL) were obtained via finger stick from each participant. Total blood cholesterol, high-density lipoprotein cholesterol (HDL-C), triglycerides (TG), and fasting blood glucose were analyzed using the CardioChek PA analyzer (Polymer Technology Systems, Inc., Indianapolis, Indiana) with PTS Panel test strips. Prior to each participant analysis, quality control was run according to the CardioChek instructions, which meets the Cholesterol Reference Method Laboratory Network certification criteria (Roberts 2007). Values of HDL-C (HDL-C >100 mg/dL) or TG (TG <50 mg/dL) that fell outside the measureable range were omitted from analysis. Hemoglobin A1c (HbA1c) was analyzed using a capillary holder to collect approximately one drop of whole blood, then analyzed using the DCA Vantage Analyzer (Siemens Healthcare Diagnostics, Tarrytown, New York, USA). The Occupation Safety and Health Administration (OSHA) procedures were followed for all blood draws (United States Department of Labor 2014).
Perceived enjoyment
Perceived enjoyment was assessed using a modified PACES questionnaire (Kendzierski and DeCarlo 1991). Sixteen statements (e.g., When I am physically active I feel bored) were presented for rating on a five-point scale (i.e., from “disagree a lot” to “agree a lot”). At baseline, participants were instructed to reflect on their current physical activity habits. In subsequent weeks, participants were instructed to reflect on the SIT or MICT protocol that they were completing. Items were then coded such that lower scores were always associated with negative perceptions and higher scores with positive perceptions, with a maximum score of 80. Scores were summed; higher scores represented greater enjoyment.
Session RPE
At the end of each training session, participants were asked to report an overall session RPE (Herman et al. 2006) using a 10 point RPE scale (Borg 1982) as established by previous studies (Foster et al. 2001; Little et al. 2011; Hazell et al. 2014). This is a separate scale from the Borg 20 point scale that was used during VO2peak measurement.
Training protocol
Participants were randomly assigned to one of the two training groups: the experimental run SIT protocol, or the reference MICT protocol. Training groups were separated, all sessions were supervised, and researchers intentionally encouraged participants throughout the intervention. Prior to each session, resting HR and blood pressure were recorded. Each exercise session began with a 5 min dynamic warm up which consisted of ball squats, wall push-ups, marching in place, leg swings, and lower body stretches, followed by a 5 min walking warm up on the treadmill at a speed of 2.5 mph and 0% grade.
Run SIT (n = 8) participants completed 4 × 30 s sprints at a 3–5% grade, in the first 3 week training block. Treadmill grade was incorporated for two reasons: (1) to help the participants achieve maximal effort in the 30 s time frame, and (2) evidence suggests that exercising on a slight incline produces less orthopedic stress in overweight/obese individuals (Ehlen et al. 2011). The researchers worked with the participants to select the maximal speed that participants could maintain for the full 30 s and that would elicit a maximal or near maximal HR response. To ensure that participants sprinted at maximal speed and grade for the full 30 s, researchers began to increase incline 15 s prior to the start of the sprint, and increased the speed 5 s prior to the start of the sprint. HR (using a Polar Heart Rate monitor) and RPE were recorded immediately after each sprint to ensure maximal effort. Speed and grade were adjusted as participants progressed throughout the 12 weeks to maintain HR and RPE. Sprints were paired with a 4 min walking recovery at 2.5 mph and 0% grade, with the final recovery consisting of a 5 min cool down. Every 3 weeks, the number of sprints was increased by two, with the final 3 weeks consisting of 10 maximal sprints.
MICT (n = 7) participants walked or jogged continuously for 30 min on a treadmill at a 3–5% grade, at an intensity of their individual 45–55% HRR, which falls within the recommended range for moderate-intensity exercise (ACSM 2013). A 5 min cool down at 2.5 mph and 0% grade completed each session. Every 3 weeks, the exercise session increased by 10 min, with the final 3 week block consisting of a 60 min sessions.
The total time commitment (i.e., time spent in the lab) was matched between groups; however, training volume differed between the groups (Table 1). By the end of 12 weeks, the SIT group was obtaining 15 min of vigorous physical activity per week, and the MICT group was obtaining 180 min of moderate-intensity physical activity per week. Exercise adherence was quantified as the number of sessions attended out of 36 possible sessions.
Table 1.
Protocol comparison | ||||
|---|---|---|---|---|
SIT | MICT | |||
| Exercise progression (No. of sprints) | Total time per week (min) | Exercise progression (min) | Total time per week (min) | |
| Weeks 1–3 | 4 | 6 | 30 | 90 |
| Weeks 4–6 | 6 | 9 | 40 | 120 |
| Weeks 7–9 | 8 | 12 | 50 | 150 |
| Weeks 10–12 | 10 | 15 | 60 | 180 |
Statistical analysis
Statistical analysis was performed using IBM SPSS Statistics 21.0 (Armonk, New York, USA). The Levene’s test for normality was run and analyzed. A mixed-design ANOVA was used to compare all variables between groups and across time, with the exception of exercise adherence which was analyzed using an independent samples t test. In addition, we analyzed variables per protocol (SIT and MICT). Variables that were deemed significant were further investigated using independent samples t tests for measures between groups and paired-samples t tests for measures within groups. Significance was set a priori at p < 0.05.
Results
Participant characteristics
Initial recruitment resulted in a total of 15 women. Three women from the run SIT group dropped out in the first 3 weeks of training, resulting in a final sample size of 12: two withdrew due to unreported preexisting injuries that became aggravated, and one withdrew due to time commitment issues. Participant baseline demographics are presented in Table 2. The only significant difference in between the groups was the age of the participants (p = 0.013).
Table 2.
| Baseline characteristics | ||
|---|---|---|
| SIT | MICT | |
| Age (years) | 37 ± 6a | 30 ± 4 |
| Height (cm) | 165.5 ± 4.9 | 167.2 ± 6.4 |
| Weight (kg) | 87.3 ± 15.2 | 82.5 ± 4.1 |
| Body mass index (kg/m2) | 32.3 ± 4.7 | 29.5 ± 1.8 |
| VO2peak mL/(kg·min) | 29.5 ± 3.3 | 26.7 ± 2.4 |
Note: Data presented as mean ± SD. SIT, sprint interval training; MICT, moderate-intensity continuous training.
a
Significantly different from MICT group; p < 0.05.
Program adherence
There was no significant difference in session attendance between the groups (p = 0.323). Participants in the run SIT group attended 96% (34.6 ± 1 sessions) of their sessions, and participants in the MICT group attended 92% (33.0 ± 3 sessions) of their sessions. It should be noted that participants were told they must maintain at least 75% adherence to remain in the study.
Participants in the SIT group completed a total of 1228 of a projected 1260 sprint bouts over the course of 12 weeks. Of these 1228 bouts, 1226 corresponding HRs were recorded (two values were missing at random). Based on HRmax from VO2peak testing, 52.3% of participants’ HRs fell below 90% HRmax, 47.6% fell between 90–99% HRmax, and 0.003% rose above 100% HRmax. On average, the SIT group’s sprint speed was 7.4 mph (range over 12 weeks: 4–9.5 mph), and the MICT group’s walking speed was 3.4 mph (range over 12 weeks: 0.3–4.1 mph). This translates into an average MET output of 14.83 for the SIT group and 4.81 for the MICT group.
Physiological data
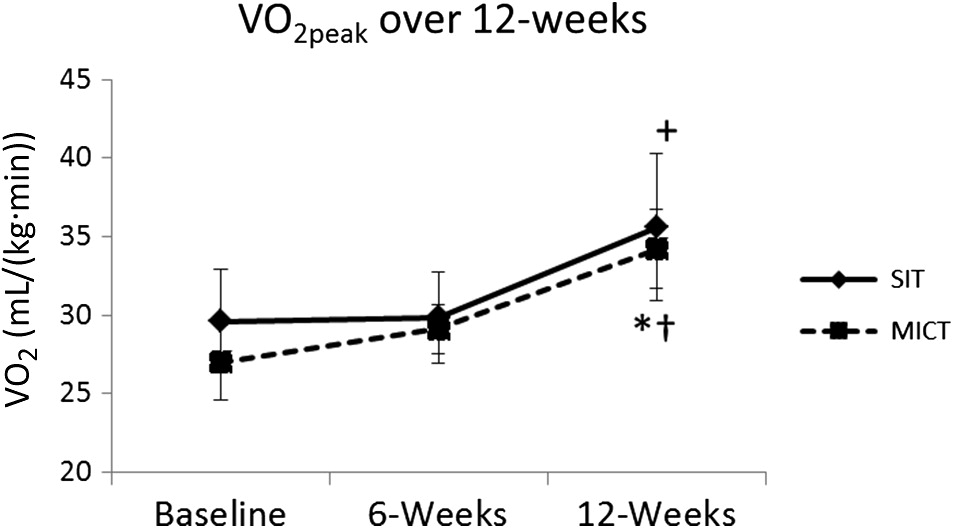
There was a significant main effect for time for VO2peak (p = 0.001), and post hoc analysis revealed significant changes in VO2peak over 12 weeks for the SIT group (p = 0.045) and the MIT group (p = 0.020). The MICT group experienced a significant increase in VO2peak from 6 to 12 weeks (p = 0.039, Fig. 2). There was no significant difference in VO2peak between the groups (p = 0.648, Fig. 2).
Fig. 2.
Total body fat percentage significantly decreased in both groups over 12 weeks (p = 0.001; Fig. 3). Post hoc analysis revealed a 1.7% decrease in body fat for the SIT group (p = 0.016) and a 2.6% decrease in the MICT group (p = 0.044). There were no significant differences in body fat percentage between the two groups (p = 0.747).
Fig. 3.
There were no significant main effects for time observed in the blood lipid measures for either group (p < 0.05), nor were there any significant main effects for time observed in fasting blood glucose (p = 0.058) or HbA1c (p = 0.168) in either group over 12 weeks. All physiological data are presented in Table 3.
Table 3.
| Physiological data table | ||||||
|---|---|---|---|---|---|---|
| Baseline | 6 Weeks | 12 Weeks | ||||
| SIT | MICT | SIT | MICT | SIT | MICT | |
| Body composition | ||||||
| Weight (kg) | 87.3 ± 15.2 | 82.5 ± 4.1 | 87.4 ± 15.7 | 82.3 ± 4.2 | 86.6 ± 14.9 | 81.7 ± 4.1 |
| Body mass index (kg/m2) | 32.3 ± 4.7 | 29.5 ± 1.8 | 32.3 ± 4.7 | 29.1 ± 1.7 | 32.0 ± 4.6 | 28.9 ± 1.6 |
| % Body fat | 44.6 ± 4.1 | 45.3 ± 2.7 | 43.8 ± 3.9 | 44.8 ± 2.4 | 42.9 ± 4.0a | 42.7 ± 2.1a |
| Cardiorespiratory | ||||||
| Heart rate maximum (bpm) | 182 ± 5 | 189 ± 5 | 174 ± 2 | 189 ± 6 | 177 ± 10 | 187 ± 8 |
| Resting heart rate (bpm) | 77 ± 8 | 80 ± 8 | 68 ± 6 | 71 ± 8a | 71 ± 6 | 70 ± 12 |
| Systolic BP (mm Hg) | 114 ± 11 | 113 ± 6 | 114 ± 11 | 112 ± 11 | 116 ± 11 | 115 ± 12 |
| Diastolic BP (mm Hg) | 78 ± 13 | 79 ± 5 | 80 ± 9 | 75 ± 9 | 75 ± 10 | 79 ± 12 |
| Blood analysis | ||||||
| Triglycerides (mmol/l) | 1.89 ± 0.73 | 2.03 ± 1.25 | 1.34 ± 0.48 | 2.13 ± 1.52 | 1.19 ± 0.34 | 1.49 ± 0.58 |
| Total cholesterol (mmol/l) | 5.25 ± 0.26 | 5.89 ± 1.21 | 5.50 ± 0.46 | 6.28 ± 1.49 | 4.91 ± 0.26 | 6.17 ± 1.23 |
| HDL-C (mmol/l) | 1.35 ± 0.56 | 1.52 ± 0.19 | 1.54 ± 0.60 | 1.62 ± 0.35 | 1.44 ± 0.64 | 1.64 ± 0.39 |
| BG (mmol/l) | 4.31 ± 0.19 | 4.58 ± 0.64 | 3.69 ± 0.17 | 4.32 ± 0.49 | 4.97 ± 0.17 | 4.96 ± 0.71 |
| HbA1c (%) | 5.2 ± 0.5 | 5.2 ± 0.2 | 5.2 ± 0.3 | 5.2 ± 0.3 | 5.1 ± 0.4 | 5.2 ± 0.3 |
Note: BG, blood glucose; BP, blood pressure; HbA1c, hemoglobin A1c; HDL-C, high-density lipoprotein cholesterol; SIT, sprint interval training; MICT, moderate-intensity continuous training. Data presented as mean ± SD.
a
Significant difference from baseline, within group; p < 0.05.
Perceived enjoyment and session RPE
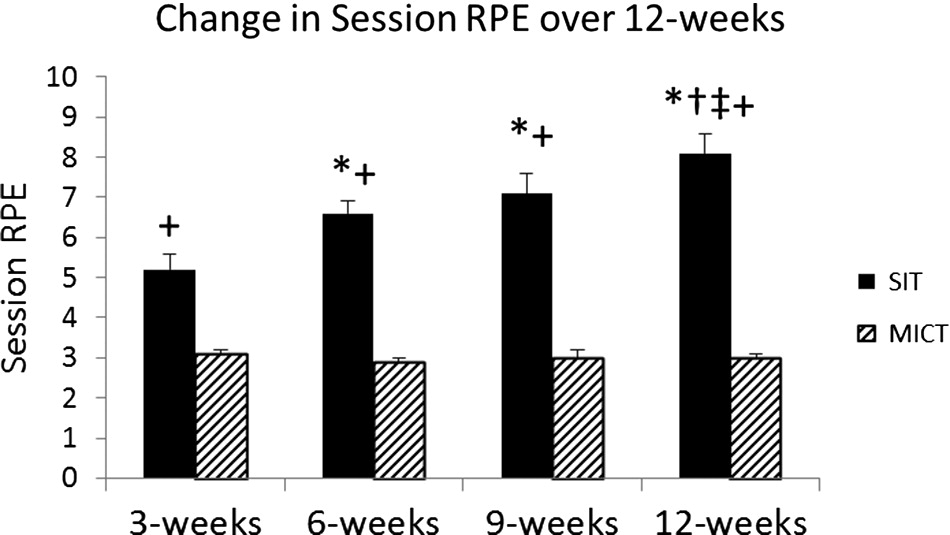
There were no significant differences in perceived enjoyment between the groups (p = 0.441) at any time point, nor was there a significant main effect for time (p = 0.580). The SIT group experienced a non-significant increase in perceived enjoyment over 12 weeks (baseline: 58.6 ± 3.2; 6 weeks: 61.2 ± 5.9; 12 weeks: 64.0 ± 5.1 (mean ± SD)), and the MICT exhibited a non-linear trend (baseline: 58.8 ± 4.1; 6 weeks: 64.4 ± 2.4; 12 weeks: 60.6 ± 5.2 (mean ± SD)). There was a main effect for time for session RPE (p = 0.006) and a significant difference between the groups over time (p = 0.002). Session RPE was significantly higher in the SIT group (p = 0.000), and there was a significant linear increase over time in the SIT group (p = 0.009, Table 3). The MICT group did not experience any significant changes in session RPE over time (p = 0.459, Fig. 3).
Discussion
The purpose of this study was to examine the effects on cardiovascular disease risk factors of a 12 week run SIT protocol compared with that of a MICT protocol in a sample of healthy inactive, overweight/obese women, and to examine differences in perceived enjoyment and session RPE between the training protocols. This study demonstrated similar improvements in VO2peak and body composition in both groups over 12 weeks of training, despite a significantly lower training volume in the SIT group. Finally, despite a high-session RPE in the SIT group, participants reported similarly high perceived enjoyment levels as MICT, indicating that the increased intensity of the SIT protocol did not decrease enjoyment.
VO2peak significantly increased by 20.7% in the SIT group despite the lower training volume. This finding is consistent with previous cycling SIT studies (Burgomaster et al. 2005, 2008; Whyte et al. 2010; Bayati et al. 2011; Astorino et al. 2012) and previous run SIT studies (Macpherson et al. 2011; Sandvei et al. 2012; Hazell et al. 2014); however, this is the first study to examine the effects of run SIT on cardiorespiratory fitness in the overweight/obese population with poor aerobic capacity on an electric motor treadmill. These findings support the evidence that run SIT produces similar aerobic benefits to those of traditional cycling SIT and MICT. Moreover, the magnitude of improvement in VO2peak for the SIT group in this study was slightly higher than those reported in previous run SIT studies (a ∼21% increase versus a ∼10% increase) (Macpherson et al. 2011; Sandvei et al. 2012; Hazell et al. 2014). A recent study by Gillen et al. (2016) reported similar increases in VO2max (∼20%) after 12 weeks of cycle SIT training in sedentary men. It is speculated that changes in oxygen consumption occur in the periphery, with adaptations occurring at the point of gas exchange within the muscle (Gist et al. 2014). It has also been postulated that adaptations within central command are causing the increase in VO2max (Sloth et al. 2013). Still, the dramatic changes observed in the current study could be due in part to the longer intervention design and (or) lower baseline fitness levels of our participants, as rapid improvements are more likely to occur in inactive, unfit individuals (Bassett and Howley 2000).
It should be noted that the SIT group did not experience any significant improvement in VO2peak during the first 6 weeks. This may indicate the presence of a critical threshold in terms of number of sprints per session that will elicit changes in aerobic capacity when using a motor-driven treadmill, similar to the dose–response relationship experienced with traditional moderate-intensity exercise (Oja 2001). Alternatively, perhaps the sprint bout length was not sufficient to elicit changes in maximal oxygen consumption. This finding is contrary to the evidence presented by Hazell et al. (2014) and Macpherson et al. (2011) and previous cycle SIT studies (Astorino et al. 2011; Trilk et al. 2011; Whyte et al. 2010), which report improvement in aerobic capacity within a 6 week time frame, despite the same number of sprints in this time block.
To our knowledge, this is the first study to demonstrate that an SIT protocol using a motor-driven treadmill can be effective for fat loss in women who were previously inactive and overweight/obese. The SIT group experienced a significant 1.7% decrease in total body fat percentage over the 12 week intervention, without a targeted dietary intervention, which supports previous SIT studies which were of shorter duration (Macpherson et al. 2011; Hazell et al. 2014). It should be noted that both Hazell et al. (2014) and Macpherson et al. (2011) used a treadmill set at dynamic mode which makes the participant generate all of the power, which could potentially elicit more rapid physiological changes compared to the electric motor treadmill used in the present study. Our results are similar to those of Sijie et al. (2012) and Heydari et al. (2012), who reported significant decreases in total body fat after 12 weeks of HIIT in sedentary, overweight adults. However, similar research in sedentary, normal weight adults reported no changes in body composition (Astorino et al. 2013); however, it should be noted that this group used skinfold technique to assess body composition.
Further, the mechanisms of fat loss during an SIT intervention are not fully understood. Increased fat oxidation at rest and during exercise was reported after 2 weeks of HIIT training and could impact fat metabolism (Talanian et al. 2007; Whyte et al. 2010). In addition, numerous SIT studies reported substantial increases in skeletal muscle enzymes, typically associated with endurance training, that play a key role in fat metabolism (MacDougall et al. 1998; Burgomaster et al. 2008; Perry et al. 2008; Whyte et al. 2013). Moreover, increased excess post exercise oxygen consumption (EPOC) following SIT sessions likely contributes to our observed improvement in body composition (Hazell et al. 2012; Chan and Burns 2013), despite the low training volume. Two studies have shown that HIIT/SIT training can induce significant levels of EPOC relative to a traditional endurance training group (Skelly et al. 2014), regardless of sex or training modality (Townsend et al. 2014).
As previously mentioned, participation in regular physical activity in the overweight/obese population is lacking. In the present study, both the SIT and MICT groups reported high perceived enjoyment at baseline and throughout the intervention, despite the significantly higher session RPE in the SIT group. Thus, in an overweight/obese population, intense, vigorous activity with regular breaks was perceived as equally enjoyable as moderate-intensity walking/jogging. This finding differs from the findings of Bartlett et al. (2011) who reported significantly higher enjoyment after an acute bout of HIIT compared to MICT. However, given our smaller sample size it is possible that the SIT group would have reported significantly greater enjoyment given a larger sample size. Anecdotally, a number of participants in the SIT group reported enjoying the sprint protocol because “Anyone can do anything for 30-seconds”, and “I feel like I am getting a really good workout even with the breaks in between [sprints]”. In addition, many of the participants commented on a desire to have a regular exercise companion, which is consistent with previous findings that reported women tend to desire more social support to physical activity (Speck and Harrell 2003; Hankonen et al. 2010). Together, these findings indicate that an SIT protocol would be an appropriate addition to an exercise program for overweight/obese women, particularly in a setting in which they had a companion they could talk to during the breaks.
A number of the investigated variables did not change significantly over the 12 week intervention. A non-significant reduction in HbA1c was observed during the last 6 weeks of training in the SIT group (p = 0.141), and there was a near-significant decrease in TG over 12 weeks (p = 0.056). The absence of significant improvement in blood lipids, blood glucose, and HbA1c is likely due to the fact that all participants had relatively healthy levels at baseline, despite being inactive and overweight. Previous literature on the effect of SIT on blood lipid profiles is inconclusive (Sandvei et al. 2012; Hazell et al. 2014). Traditional aerobic training is generally recommended to help lower LDL-C and TG, increase HDL-C, and improve autonomic tone and unregulated glucose (Donnelly et al. 2009), thus further research on both a longer intervention and a greater participant pool is necessary to understand SIT’s long-term effect on blood lipids and glucose regulation
There were a few limitations to this study. The first is the low number of participants. As stated earlier, there were three dropouts in the SIT group, which may indicate a polarizing effect of the protocol itself that either attracts or deters individuals. It should be noted, however, that the majority of the participants were able to successfully complete the 12 week training protocol. The treadmill incline served to improve shock absorption (Ehlen et al. 2011) and increase stability by allowing participants to decrease walking/running speed while still eliciting maximal effort. The second limitation is the intentional social support provided by the researchers. There appears to be a strong connection between increased physical activity levels in women and high levels of social support (Speck and Harrell 2003); however, this type of opportunity does not always present itself naturally. It is possible that high levels of social support are what led to high levels of reported enjoyment, thus raising the question of whether the participants actually enjoyed the exercise protocol as opposed to simply enjoying the exercise setting. The third limitation stems from the lack of anticipated HR response in the SIT participants. Despite the researcher’s attempt to elicit a supramaximal HR response in the SIT group, approximately 50% of the recorded HR’s fell below 90% age-predicted HRmax, and the other 50% fell within 90–99% HRmax. Perhaps this is a limitation associated with the selected modality despite the participant’s perceived maximal exertion. Still, SIT studies that use manual powered treadmills are subject to individual effort and motivation which can vary from session to session. A benefit of the motor-driven treadmill modality is that speed is guaranteed for the full 30 s. Finally, this sample was limited to inactive, overweight/obese women who were otherwise healthy. There is room for future research in more clinical populations to see if a run SIT protocol elicits similar results, and if those subjects can endure the intensity of the protocol.
Conclusion
In conclusion, the present study indicates that run SIT elicits comparable improvements in body composition and cardiovascular fitness among overweight and obese women when compared to MICT. Run SIT appears to be similarly enjoyable to traditional MICT, despite the significantly higher session RPE. Similarly, this study indicates that inactive, overweight/obese women can sustain a 12 week, motor treadmill-based SIT intervention in the absence of previous injuries. This version of SIT protocol appears to have a promising future in exercise programming due to greater accessibility and lower volume training, and could be beneficial for those attempting to begin a regular exercise regimen.
Acknowledgements
We would like to thank the individuals who participated in this research study. In addition, we would like to thank the undergraduate students who volunteered their time to the data collection portion of this study. This study was funded by an Inter-Professional Grant through the College of Health and Behavioral Studies at James Madison University.
References
American College of Sports Medicine (ACSM). 2013. ACSM’s guidelines for exercise testing and prescription. Lippincott Williams & Wilkins, Baltimore, Maryland.
Astorino TA, Allen RP, Roberson DW, and Jurancich M. 2012. Effect of high-intensity interval training on cardiovascular function, VO2max, and muscular force. The Journal of Strength & Conditioning Research, 26(1): 138–145.
Astorino TA, Allen RP, Roberson DW, Jurancich M, Lewis R, McCarthy K, et al. 2011. Adaptations to high-intensity training are independent of gender. European Journal of Applied Physiology, 111(7): 1279–1286.
Astorino TA, Schubert MM, Palumbo E, Stirling D, and McMillan DW. 2013. Effect of two doses of interval training on maximal fat oxidation in sedentary women. Medicine and Science in Sports and Exercise, 45(10): 1878–1886.
Bartlett JD, Close GL, MacLaren DP, Gregson W, Drust B, and Morton JP. 2011. High-intensity interval running is perceived to be more enjoyable than moderate-intensity continuous exercise: implications for exercise adherence. Journal of Sports Sciences, 29(6): 547–553.
Bassett DR, and Howley ET. 2000. Limiting factors for maximum oxygen uptake and determinants of endurance performance. Medicine and Science in Sports and Exercise, 32(1): 70–84.
Bayati M, Farzad B, Gharakhanlou R, and Agha-Alinejad H. 2011. A practical model of low-volume high-intensity interval training induces performance and metabolic adaptations that resemble ‘all-out’ sprint interval training. Journal of Sports Science & Medicine, 10(3): 571–576.
Borg GA. 1982. Psychophysical bases of perceived exertion. Medicine and Science in Sports and Exercise, 14(5): 377–381.
Burgomaster KA, Cermak NM, Phillips SM, Benton CR, Bonen A, and Gibala MJ. 2007. Divergent response of metabolite transport proteins in human skeletal muscle after sprint interval training and detraining. American Journal of Physiology—Regulatory, Integrative and Comparative Physiology, 292(5): R1970–R1976.
Burgomaster KA, Howarth KR, Phillips SM, Rakobowchuk M, MacDonald MJ, McGee SL, et al. 2008. Similar metabolic adaptations during exercise after low volume sprint interval and traditional endurance training in humans. The Journal of Physiology, 586(1): 151–160.
Burgomaster KA, Hughes SC, Heigenhauser GJ, Bradwell SN, and Gibala MJ. 2005. Six sessions of sprint interval training increases muscle oxidative potential and cycle endurance capacity in humans. Journal of Applied Physiology, 98(6): 1985–1990.
Centers for Disease Control and Prevention (CDC). 2013. Division of nutrition, physical activity, and obesity [online]: Available from http://www.cdc.gov/nccdphp/dnpao/index.html.
Centers for Disease Control and Prevention (CDC). 2014. Facts about physical activity [online]: Available from http://www.cdc.gov/physicalactivity/data/facts.htm.
Chan HH, and Burns SF. 2013. Oxygen consumption, substrate oxidation, and blood pressure following sprint interval exercise. Applied Physiology, Nutrition, and Metabolism, 38(2): 182–187.
Colley RC, Garriguet D, Janssen I, Craig CL, Clarke J, and Tremblay MS. 2011. Physical activity of Canadian adults: accelerometer results from the 2007 to 2009 Canadian Health Measures Survey. Health Reports, 22(1): 7.
Davis JN, Hodges VA, and Gillham MB. 2006. Physical activity compliance: differences between overweight/obese and normal‐weight adults. Obesity, 14(12): 2259–2265.
Donnelly JE, Blair SN, Jakicic JM, Manore MM, Rankin JW, and Smith BK. 2009. Appropriate physical activity intervention strategies for weight loss and prevention of weight regain for adults. Medicine and Science in Sports and Exercise, 41(7): 1532–1532.
Ehlen KA, Reiser RF, and Browning RC. 2011. Energetics and biomechanics of inclined treadmill walking in obese adults. Medicine and Science in Sports and Exercise, 43(7): 1251–1259.
Eisenmann JC, Brisko N, Shadrick D, and Welsh S. 2003. Comparative analysis of the Cosmed Quark b2 and K4b2 gas analysis systems during submaximal exercise. Journal of Sports Medicine and Physical Fitness, 43(2): 150.
Esfarjani F, and Laursen PB. 2007. Manipulating high-intensity interval training: effects on VO2max, the lactate threshold and 3000 m running performance in moderately trained males. Journal of Science and Medicine in Sport, 10(1): 27–35.
Foster C, Florhaug JA, Franklin J, Gottschall L, Hrovatin LA, Parker S, et al. 2001. A new approach to monitoring exercise training. The Journal of Strength and Conditioning Research, 15(1): 109–115.
Gibala MJ, Gillen JB, and Percival ME. 2014. Physiological and health-related adaptations to low-volume interval training: influences of nutrition and sex. Sports Medicine, 44(2): 127–137.
Gibala MJ, Little JP, Van Essen M, Wilkin GP, Burgomaster KA, Safdar A, et al. 2006. Short-term sprint interval versus traditional endurance training: similar initial adaptations in human skeletal muscle and exercise performance. The Journal of Physiology, 575(3): 901–911.
Gillen JB, Martin BJ, MacInnis MJ, Skelly LE, Tarnopolsky MA, and Gibala MJ. 2016. Twelve weeks of sprint interval training improves indices of cardiometabolic health similar to traditional endurance training despite a five-fold lower exercise volume and time commitment. PLoS ONE, 11(4): e0154075.
Gist NH, Fedewa MV, Dishman RK, and Cureton KJ. 2014. Sprint interval training effects on aerobic capacity: a systematic review and meta-analysis. Sports Medicine, 44(2): 269–279.
Gotay CC, Katzmarzyk PT, Janssen I, Dawson MY, Aminoltejar K, and Bartley NL. 2013. Updating the Canadian obesity maps: an epidemic in progress. Canadian Journal of Public Health, 104(1): e64–e68.
Gremeaux V, Drigny J, Nigam A, Juneau M, Guilbeault V, Latour E, et al. 2012. Long-term lifestyle intervention with optimized high-intensity interval training improves body composition, cardiometabolic risk, and exercise parameters in patients with abdominal obesity. American Journal of Physical Medicine & Rehabilitation, 91(11): 941–950.
Hankonen N, Absetz P, Ghisletta P, Renner B, and Uutela A. 2010. Gender differences in social cognitive determinants of exercise adoption. Psychology and Health, 25(1): 55–69.
Hazell TJ, Hamilton CD, Olver TD, and Lemon PW. 2014. Running sprint interval training induces fat loss in women. Applied Physiology, Nutrition, and Metabolism, 39(8): 944–950.
Hazell TJ, Olver TD, Hamilton CD, and Lemon PW. 2012. Two minutes of sprint-interval exercise elicits 24-hr oxygen consumption similar to that of 30 min of continuous endurance exercise. International Journal of Sport Nutrition and Exercise Metabolism, 22(4): 276–283.
Herman L, Foster C, Maher MA, Mikat RP, and Porcari JP. 2006. Validity and reliability of the session RPE method for monitoring exercise training intensity. South African Journal of Sports Medicine, 18(1): 14–17.
Heydari M, Freund J, and Boutcher SH. 2012. The effect of high-intensity intermittent exercise on body composition of overweight young males. Journal of Obesity, 2012: 8.
Iaia FM, Hellsten Y, Nielsen JJ, Fernström M, Sahlin K, and Bangsbo J. 2009. Four weeks of speed endurance training reduces energy expenditure during exercise and maintains muscle oxidative capacity despite a reduction in training volume. Journal of Applied Physiology, 106(1): 73–80.
Kendzierski D, and DeCarlo KJ. 1991. Physical activity enjoyment scale: two validation studies. Journal of Sport and Exercise Psychology, 13(1): 50–64.
Little JP, Gillen JB, Percival ME, Safdar A, Tarnopolsky MA, and Punthakee Z. 2011. Low-volume high-intensity interval training reduces hyperglycemia and increases muscle mitochondrial capacity in patients with type 2 diabetes. Journal of Applied Physiology, 111(6): 1554–1560.
MacDougall JD, Hicks AL, MacDonald JR, McKelvie RS, Green HJ, and Smith KM. 1998. Muscle performance and enzymatic adaptations to sprint interval training. Journal of Applied Physiology, 84(6): 2138–2142.
Macpherson RE, Hazell TJ, Olver TD, Paterson DH, and Lemon PW. 2011. Run sprint interval training improves aerobic performance but not maximal cardiac output. Medicine and Science in Sports and Exercise, 43(1): 115–122.
Metcalfe RS, Babraj JA, Fawkner SG, and Vollaard NB. 2012. Towards the minimal amount of exercise for improving metabolic health: beneficial effects of reduced-exertion high-intensity interval training. European Journal of Applied Physiology, 112(7): 2767–2775.
Ogden CL, Carroll MD, Kit BK, and Flegal KM. 2014. Prevalence of childhood and adult obesity in the United States, 2011–2012. JAMA, 311(8): 806–814.
Oja PEKKA. 2001. Dose response between total volume of physical activity and health and fitness. Medicine and Science in Sports and Exercise, 33(6 Suppl): S428–S437.
Perry CG, Heigenhauser GJ, Bonen A, and Spriet LL. 2008. High-intensity aerobic interval training increases fat and carbohydrate metabolic capacities in human skeletal muscle. Applied Physiology, Nutrition, and Metabolism, 33(6): 1112–1123.
Roberts A. 2007. Accuracy and precision in point-of-care lipid testing: CardioChek PA point-of-care test system and PTS panels test strips. 1st edition. Polymer Technology Systems, Inc., Indianapolis, Indiana. pp. 1–12.
Sandvei M, Jeppesen PB, Støen L, Litleskare S, Johansen E, Stensrud T, et al. 2012. Sprint interval running increases insulin sensitivity in young healthy subjects. Archives of Physiology and Biochemistry, 118(3): 139–147.
Sijie T, Hainai Y, Fengying Y, and Jianxiong W. 2012. High intensity interval exercise training in overweight young women. The Journal of Sports Medicine and Physical Fitness, 52(3): 255–262.
Skelly LE, Andrews PC, Gillen JB, Martin BJ, Percival ME, and Gibala MJ. 2014. High-intensity interval exercise induces 24-h energy expenditure similar to traditional endurance exercise despite reduced time commitment. Applied Physiology, Nutrition, and Metabolism, 39(7): 845–848.
Sloth M, Sloth D, Overgaard K, and Dalgas U. 2013. Effects of sprint interval training on VO2max and aerobic exercise performance: a systematic review and meta‐analysis. Scandinavian Journal of Medicine and Science in Sports, 23(6): e341–e352.
Speck BJ, and Harrell JS. 2003. Maintaining regular physical activity in women: evidence to date. Journal of Cardiovascular Nursing, 18(4): 282–293.
Talanian JL, Galloway SD, Heigenhauser GJ, Bonen A, and Spriet LL. 2007. Two weeks of high-intensity aerobic interval training increases the capacity for fat oxidation during exercise in women. Journal of Applied Physiology, 102(4): 1439–1447.
Townsend LK, Couture KM, and Hazell TJ. 2014. Mode of exercise and sex are not important for oxygen consumption during and in recovery from sprint interval training. Applied Physiology, Nutrition, and Metabolism, 39(12): 1388–1394.
Trilk JL, Singhal A, Bigelman KA, and Cureton KJ. 2011. Effect of sprint interval training on circulatory function during exercise in sedentary, overweight/obese women. European Journal of Applied Physiology, 111(8): 1591–1597.
United States Department of Labor. 2014. Bloodborne pathogens and needlestick prevention [online]: Available from https://www.osha.gov/SLTC/bloodbornepathogens/index.html.
Weston KS, Wisløff U, and Coombes JS. 2014. High-intensity interval training in patients with -lifestyle-induced cardiometabolic disease: a systematic review and meta-analysis. British Journal of Sports Medicine, 48(16): 1227–1234.
Whyte LJ, Ferguson C, Wilson J, Scott RA, and Gill JM. 2013. Effects of single bout of very high-intensity exercise on metabolic health biomarkers in overweight/obese sedentary men. Metabolism, 62(2): 212–219.
Whyte LJ, Gill JM, and Cathcart AJ. 2010. Effect of 2 weeks of sprint interval training on health-related outcomes in sedentary overweight/obese men. Metabolism, 59(10): 1421–1428.
Information & Authors
Information
Published In
FACETS
Volume 2 • Number 1 • January 2017
Pages: 53 - 67
Editor: Charles Couillard
History
Received: 27 January 2016
Accepted: 8 September 2016
Version of record online: 31 January 2017
Copyright
© 2017 Rowley et al. This work is licensed under a Creative Commons Attribution 4.0 International License (CC BY 4.0), which permits unrestricted use, distribution, and reproduction in any medium, provided the original author(s) and source are credited.
Data Availability Statement
All relevant data are within the paper.
Key Words
Sections
Subjects
Authors
Author Contributions
All conceived and designed the study.
TWR and JLE performed the experiments/collected the data.
TWR, JLE, and ESE analyzed and interpreted the data.
All contributed resources.
All drafted or revised the manuscript.
Competing Interests
The authors have declared that no competing interests exist.
Metrics & Citations
Metrics
Other Metrics
Citations
Cite As
Taylor W. Rowley, Jennifer L. Espinoza, Jeremy D. Akers, David L. Wenos, and Elizabeth S. Edwards. 2017. Effects of run sprint interval training on healthy, inactive, overweight/obese women: A pilot study. FACETS.
2(): 53-67. https://doi.org/10.1139/facets-2016-0004
Export Citations
If you have the appropriate software installed, you can download article citation data to the citation manager of your choice. Simply select your manager software from the list below and click Download.
Cited by
1. Four-week experimental plus 1-week taper period using live high train low does not alter muscle glycogen content
2. High-intensity interval training is not superior to continuous aerobic training in reducing body fat: A systematic review and meta-analysis of randomized clinical trials
3. Adaptations to a Concurrent Exercise Training Program in Inactive Aging Women
4. Affective and Enjoyment Responses to Sprint Interval Training in Healthy Individuals: A Systematic Review and Meta-Analysis
5. Physiological Responses to Low-Volume Interval Training in Women
6. Difference in total workload during sprint interval training for adults living with or without obesity
7. Comparison of High-Intensity Training Versus Moderate-Intensity Continuous Training on Cardiorespiratory Fitness and Body Fat Percentage in Persons With Overweight or Obesity: A Systematic Review and Meta-Analysis of Randomized Controlled Trials
8. Combining supervised run interval training or moderate-intensity continuous training with the diabetes prevention program on clinical outcomes
9. The influence of high‐intensity interval training on anthropometric variables of adults with overweight or obesity: a systematic review and network meta‐analysis