Hydrogen absorption in palladized MCM-41
Abstract
Hydrogen absorption by palladium (Pd) in Pd/MCM-41 was studied at 298.2 ± 0.1 K and between 0.5 and 1.0 atm . Mass percent Pd loadings of 0.81%, 1.10%, 1.16%, and 2.30% of total Pd/MCM-41 were used. Absorption was measured in gas-tight stainless steel cells equipped with computer-logged pressure transducers. The average maximum hydrogen absorption for all samples was 0.85 ± 0.18 H/Pd. An apparent trend of increasing hydrogen absorption as the mass percent loading of Pd increased was determined to be non-significant. Similar experiments using Pd black showed a lower absorption of 0.79 ± 0.09 H/Pd.
Introduction
Research into the interaction of hydrogen gas and metals has been driven by possible applications in several areas including catalysis and chemical production, fuel cell technology, and water treatment. The hydrogen–palladium system, specifically, has attracted interest due to palladium’s potential use in fuel cell technology storage systems and as a high efficiency catalyst in many different reactions. Additionally, repeated pressurization and depressurization of Pd with hydrogen does not result in the hydrogen embrittlement observed in some metals (Vogel et al. 2010).
When hydrogen gas is brought into contact with Pd, it dissociates into individual atoms at the surface and diffuses into the metal lattice, forming a random solid solution or palladium hydride (Iyer and Pickering 1990; Prasanth et al. 2010). In bulk Pd metal, hydrogen occupies the interstitial, octahedral sites of the metal’s face-centered cubic (fcc) lattice and can migrate to any available vacancies or voids in the structure (Iyer and Pickering 1990; Flanagan and Oates 1991; Sachs et al. 2001). As hydrogen is absorbed and released by Pd, the metal undergoes a transition between the α- and β-phases (Walter and Chandler 1965; Horner and Wagner 1974; Flanagan and Oates 1991). The α-phase describes a solution phase with lattice constants (the distance between unit cells) similar to those of palladium metal. As hydrogen pressure increases and gas continues to enter the Pd lattice, the lattice expands, creating additional lattice sites, thus increasing the lattice constant. At a certain pressure, the α-phase converts to the β-phase (Jewell and Davis 2006). The α- to β-phase transition indicates the formation of metal hydrides in palladium (Flanagan et al. 1980).
The use of a solid support material with a reactive metal can reduce the tendency of free metal particles to aggregate together. Thus, using a support material can aid in obtaining well-dispersed metal centers of relatively small diameter and high surface area while avoiding the coalescence of metal particles during their use as a reactant or catalyst (Koh et al. 1997; Huang et al. 2006; Park and Lee 2010; Prasanth et al. 2010). Support materials are often used in conjunction with highly reactive nano-sized metals for similar reasons. Certain properties of metal nanoparticles, such as solubility, reactivity, surface area, concentration of surface sites, and defects, may differ markedly from their larger-sized or bulk counterparts (Wang and Zhang 1997; Chen and Elimelech 2006; Theng and Yuan 2008). MCM-41 is one such support material of interest. It is a siliceous, mesoporous material possessing several interesting characteristics, including exceptionally high surface areas (>1000 m2/g), and a pore size that can be adjusted between 2 and 10 nm depending on the synthesis procedure and reagents used in its synthesis (Beck et al. 1992).
Reactive metals such as Pd can be grafted to the surface and within the pores of MCM-41 (Koh et al. 1997; Decyk 2006). Metals may also be incorporated within the MCM-41 structure during its hydrothermal synthesis (Zhang et al. 1996; Ziolek et al. 2004). Prasanth et al. (2010) reported a hydrogen uptake of 35.1 cc H2/g by Pd-incorporated MCM-41 samples. In this material, Pd2+ was incorporated into the structure of MCM-41 during its hydrothermal synthesis. The purpose of the current research was to determine the hydrogen absorption capacity of Pd grafted to the surfaces and within the pores of MCM-41 (Pd/MCM-41) at 298.2 ± 0.1 K up to pressures between 0.5 and 1.0 atm and compare it with unsupported Pd black. A comparison was also made between the results of the current research and those reported in the literature.
Materials and methods
MCM-41
MCM-41 was synthesized according to published procedures (Cheng et al. 1997; Mansour et al. 2002; Guthrie and Reardon 2008). MCM-41 is formed via a liquid crystal template mechanism in which silica tetrahedrons form around rod-like arrangements of organic surfactant micelles in a hexagonal arrangement (Beck et al. 1992; Mastalir et al. 2007). Tetramethylammonium hydroxide (TMAOH; Sigma Aldrich, St. Louis, Missiouri, USA) and hexadecyltrimethylammonium bromide (CTABr; Fisher Scientific, Markham, Ontario, Canada) were dissolved in Nanopure® deionized water under gentle stirring at 300 K. Fumed silica powder (Sigma Aldrich, St. Louis, Missouri, USA) was added once the opaque solution turned clear and the resulting mixture was stirred and heated for 3 h. The final relative molar composition of the gel was 1 SiO2, 0.19 TMAOH, 0.27 CTABr, and 40 H2O. The required masses of reagents were calculated on the basis of 250 g of water—the maximum volume that could be contained by the autoclave. The gel was covered with Parafilm and aged for 24 h at room temperature. The gel was transferred to a stainless steel autoclave sealed with a Viton Teflon O-ring and heated for 68 h at 400 K. The reaction was arrested by quenching the autoclave under cold water for 0.5 h. The autoclave contents were then transferred to plastic centrifuge bottles and washed, centrifuged, and decanted 12 times, or until the conductance of the supernatant rinsate was less than 10 μS/cm. The solid material was calcined under air for 8 h at 923 K to ensure complete removal of the organic template.
Mesoporosity and hexagonal structure of the material were verified by low-angle powder X-ray diffraction (XRD) analysis between 1.5° and 8°2θ using a Bruker AXS D8 Advance X-ray diffractometer with a 1.5418 Å X-ray source, a step time of 0.50 s, and a step size of 0.01°2θ. Samples were also analyzed between 35° and 100°2θ using the same diffractometer with a step size of 0.050°2θ and a step time of 0.20 s. Peaks were indexed to possible crystal phases using Visual XRD (Copyright 2000, Batiste & Reardon) and Eva (Copyright 1996–2007, Bruker AXS) software packages.
Surface area was determined using a Micromeritics Gemini III 3275 Surface Area Analyzer following the Brunauer–Emmett–Teller (BET) isotherm nitrogen adsorption surface area technique (Brunauer et al. 1938). For simple surface area measurements, an 11-point adsorption isotherm between relative pressures (P/P o) of 0.03 and 0.50 was recorded. A full adsorption–desorption isotherm was recorded between 0.30 and 1.00 relative pressure for the purely siliceous, calcined MCM-41 parent material. Full adsorption–desorption isotherms were collected using a Quantachrome Instruments Autosorb-1 surface area analyzer.
The pore structure of MCM-41 samples was further examined using a Philips CM20 high-resolution transmission electron microscope (TEM).
Pd/MCM-41
Palladized MCM-41 (Pd/MCM-41) with Pd loadings of 0.81%, 1.10%, 1.16%, 1.76%, and 2.30% of total Pd/MCM-41 mass was prepared following published procedures (Koh et al. 1997). The Pd source (Pd(NH3)4Cl2 · H2O; Alfa Aesar, Ward Hill, Massachusetts, USA) dissociates in solution, forming Pd2+. The Pd2+ cations in solution were deposited as palladium metal clusters on the MCM-41 surface and within the pores when the sample was dried under air. An ammonium exchange performed on the MCM-41 sample prior to addition of the palladium source facilitated the reduction of Pd2+ to palladium metal via reaction with . The ammonium exchange involved the addition of 0.5–2 g of calcined MCM-41 to 100 mL of 2 mol/L NH4Cl solution. The mixture was stirred for 15 min and transferred to plastic centrifuge bottles in which it was washed, centrifuged, and decanted 12 times, or until the conductance of the supernatant rinsate was less than 10 μS/cm. Solid MCM-41 was recovered and dried overnight at 393 K. Different mass percent loadings of Pd on MCM-41 were achieved by dissolving appropriate masses of Pd(NH3)4Cl2 · H2O into small volumes of deionized water that were added dropwise to the dried MCM-41 following the incipient wetness technique (Haber et al. 1995). The material was placed under vacuum for 30 min and dried overnight at 393 K. The vacuum ensured that the Pd2+ solution entered the pores of MCM-41. The material was then calcined under air for 3 h at 593 K.
Pd/MCM-41 samples were characterized via low- and high-angle XRD following the same procedure as described above for MCM-41.
Surface areas of the materials were determined using a Micromeritics Gemini VII surface area analyzer. Data for constructing full adsorption—desorption isotherms between relative pressures of 0.03 and 1 were collected for a representative sample of Pd/MCM-41 using a Quantachrome Instruments Autosorb-1 surface area analyzer.
Success of the Pd-loading procedure was verified using a Leo 1530 energy dispersive X-ray spectroscopy (EDAX)-equipped SEM and Varian Liberty 110 inductively coupled plasma-atomic emission spectroscopy (ICP-AES). The pore size, pore structure, and Pd-center location in a representative sample of Pd/MCM-41 was also investigated by TEM.
The Pd/MCM-41 samples were analyzed for total Pd concentration by fire assay with inductively coupled plasma (ICP). Samples were prepared by mixing approximately 65 mg of metal impregnated samples with approximately 30 g of 50–70 mesh Ottawa silica sand. This dilution of the metal-impregnated samples was necessary to stay within the acceptable range of concentrations for the analysis technique. The results of the analysis were multiplied by the dilution factor for each sample to obtain the real concentrations. Control samples containing only 50–70 mesh Ottawa silica sand were also analyzed to eliminate the possibility of any Pd contamination present in the diluent sand.
Hydrogen absorption
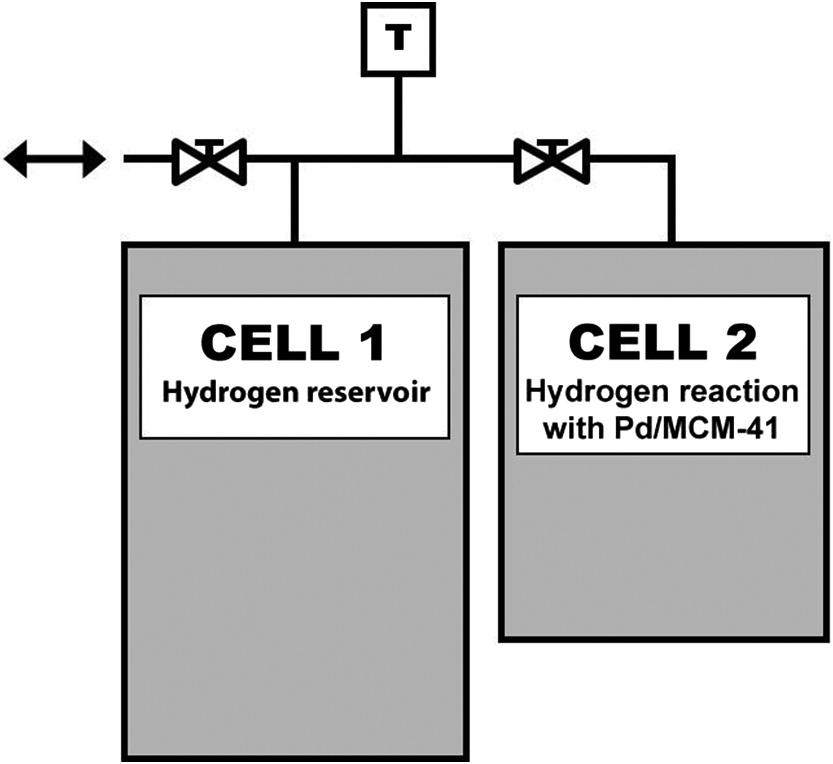
H2(g) absorption by Pd/MCM-41 was measured using two interconnected stainless steel cells of known volume equipped with computer-monitored pressure transducers (Fig. 1). Cells, valves, and pressure transducers were connected by stainless steel tubing and Swagelok fittings. All cells were filled with H2(g) and tested to ensure that there was neither leakage nor uptake of hydrogen by the metal components. Known masses of dry Pd/MCM-41 were placed in CELL 2. The cell apparatus was submerged in a temperature-controlled water bath at 298.2 ± 0.1 K. Both cells were evacuated using an Edwards 2-stage vacuum pump via the inlet of CELL 1. Hydrogen was added by injection from a gas-tight glass-on-glass syringe to CELL 1 and allowed to thermally equilibrate with the apparatus. Hydrogen was introduced to reactive Pd/MCM-41 in CELL 2 by opening a valve between cells after the cell pressure had stabilized and showed no further decrease with time. The initial and final cell pressures in kPa were recorded. This process was repeated with successive injections of hydrogen until the desired final pressure was achieved. Similarly, hydrogen was removed from CELL 2 in successive steps by lowering the pressure in CELL 1 via vacuum pump, allowing the remaining hydrogen gas to equilibrate thermally, and then opening the valve between cells.
Fig. 1.
Pd/MCM-41 samples were pre-treated by pressurizing the cells with hydrogen to approximately 120 kPa and leaving them overnight. Cells were then evacuated, re-pressurized to 120 kPa with hydrogen, and left for a minimum of 2 h. Finally, the cells were put under vacuum for 30 min before starting an experimental run. Reproducible results were achievable following this pre-treatment procedure. Cycles of pressurization and depressurization ensured the conversion of relatively unstable PdO material in the palladium clusters on Pd/MCM-41 to Pdo as described elsewhere (Sachs et al. 2001).
H2(g) absorption by Pd was calculated using pressure transducer readings and the ideal gas law as the discrepancy between calculated initial moles of H2(g) gas in CELL 1 and final moles of H2(g) in the cells’ headspace once the connecting valve between the cells was opened. Experiments with cells containing un-palladized MCM-41 showed no significant change in hydrogen pressure thereby indicating that pressure differences in later experiments resulted from gas uptake by Pd. Absorption results are expressed as moles of hydrogen absorbed per mole of Pd (H/Pd) at selected pressures. A plot of the equilibrated hydrogen pressure versus H/Pd gives the pressure–composition (P–C) isotherm for each Pd/MCM-41 sample. Experiments were also conducted using palladium black (Pd, surface area = 20 m2/g; Alfa Aesar, Ward Hill, Massachusetts, USA) as an analog of bulk Pd metal. Standard deviation of transducer measurements was 0.03 kPa at 97.51 kPa. The standard error in H/Pd determinations was between 1% and 4% of the calculated H/Pd values.
Results and discussion
Synthesis of materials
MCM-41
Results of the XRD analysis between 1° and 8°2θ for calcined MCM-41 are shown in Fig. 2 and at higher angles in Fig. 3. This sample of MCM-41 was made by combining the results of four separate synthesis batches. This was necessary to produce adequate amounts of MCM-41 to prepare the five Pd/MCM-41 samples. Combining the batches resulted in a slight broadening of the peaks in Fig. 2 relative to XRD traces for individually prepared batches. Nonetheless, four distinct peaks were identified and labeled according to the Miller indices of a hexagonal unit cell. The presence and 2θ values of these peaks indicate mesoporosity and a well-ordered arrangement of hexagonal pores in the sample.
Fig. 2.
Low-angle XRD results were used in calculating the cell parameter a based on the 2θ position of the maximum intensity peak (100) and Bragg’s law:where d is the d-spacing of the (100) peak, n is an integer equal to 1, and the wavelength parameter λ is equal to 1.5418 Å. The repeating structure of MCM-41 results from the arrangement of the mesopores. Therefore, cell parameter values correspond to the pore center-to-center distance and include the radii of two adjacent pores and the thickness of the pore wall separating them (Beck et al. 1992). The primary mesopore diameter (Wd ) can be calculated using the following equation:where the constant c is equal to 1.213 for pores that are circular in cross section, d is the d-spacing of the (100) peak, and ρ is the pore wall density, which is assumed to be equal to 2.2 cm3/g for amorphous silicas (Kruk et al. 1997, 1999, 2000). The parameter Vp is the primary mesopore volume and is equal to 0.91 cm3/g based on the carbon chain length of the organic surfactant (Kruk et al. 1997). The organic surfactant used in synthesizing all MCM-41 samples for this research was CTABr (C19H42BrN), which has a chain length of 16. Pore wall thickness (Wt ) is calculated by subtracting the primary mesopore diameter from the cell parameter. Physical characteristics of the materials are summarized in Table 1 along with results of nitrogen adsorption surface area analyses. An adsorption–desorption isotherm for the parent MCM-41 sample is presented in Fig. 4. The sharp vertical step of the isotherm between relative pressures of 0.25 and 0.50 indicates the narrow distribution of pore diameters in the sample.
(1)
(2)
(3)
Table 1.
| Sample | 2θ (100) | d 100 | a (nm) | Wd (nm) | Wt (nm) | SA (m2/g) |
|---|---|---|---|---|---|---|
| MCM-41 | 2.13 | 41.6 | 4.80 | 4.12 | 0.68 | 1000 |
| 0.81% Pd/MCM-41 | 2.35 | 37.7 | 4.35 | 3.73 | 0.62 | 869 |
| 1.10% Pd/MCM-41 | 2.28 | 38.8 | 4.48 | 3.84 | 0.64 | 788 |
| 1.16% Pd/MCM-41 | 2.19 | 40.3 | 4.66 | 3.99 | 0.66 | 521 |
| 1.76% Pd/MCM-41 | 2.27 | 38.9 | 4.49 | 3.85 | 0.64 | 761 |
| 2.30% Pd/MCM-41 | 2.35 | 37.6 | 4.34 | 3.72 | 0.62 | 849 |
Note: 2θ (100), 2θ value of 100 peak; d 100, d-spacing of 100 peak; a, cell parameter; Wd , primary mesopore diameter; Wt , pore wall thickness; SA, surface area.
A scanning electron microscope (SEM) image demonstrating the morphology of the MCM-41 sample is presented in Fig. 5 at two magnifications. The left image, at lower magnification, shows a relatively homogeneous distribution of particle size and morphology. The right image shows the same sample at higher magnification. At this scale, the particles show a somewhat greater range of size and morphology of oblong particles with a variety of different particle geometries and orientations. This is described as “wormy” MCM-41 morphology in the literature (Gaydhankar et al. 2005).
Pd/MCM-41
The results of the low-angle XRD analysis for the 0.81% Pd/MCM-41 sample are presented in Fig. 2. The results for this sample are typical of all Pd/MCM-41 samples prepared for this research. The broadening of the peaks and loss in intensity relative to background noise of the (110) and (200) peaks are characteristic of MCM-41 samples to which Pd has been grafted to their surfaces, and there is no reason that metal impregnation via the incipient wetness method would cause alteration of the hexagonal pore structure of the MCM-41 support.
The high-angle XRD results for 0.81% Pd/MCM-41 are presented in Fig. 3. Results were typical of all Pd/MCM-41 samples. The peak at 40.6°2θ was attributed to Pd.
Fig. 3.
The results of BET nitrogen adsorption surface area analysis are included in Fig. 4. The surface areas of Pd/MCM-41 samples are low relative to the parent MCM-41 material. The lack of a sharp vertical step between relative pressures of 0.25 and 0.50 as compared to the results for the parent MCM-41 material is indicative of a wider distribution of pore diameters in the material consistent with partial blocking of pores by Pd centers in the palladized material. Nitrogen adsorption results for 0.81% Pd/MCM-41 are representative of results for all other samples used in this research.
Fig. 4.
A series of SEM and TEM images at different magnifications of a representative sample of the 1.16% Pd/MCM-41 material is included in Fig. 6. The density of palladium is high relative to that of the SiO2 making up the MCM-41 material. Therefore, areas of high Pd density should appear bright relative to the MCM-41 surface in SEM images. Conversely, areas of high Pd density would appear dark relative to the MCM-41 material in the TEM images for similar reasons.
Fig. 5.
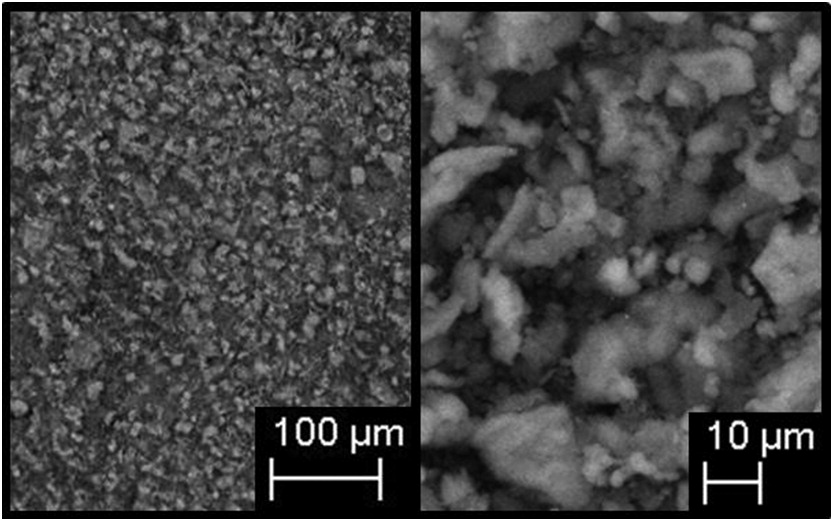
Fig. 6.
Concentration of Pd in the Pd/MCM-41 samples was determined via EDAX at two different magnifications, as well as by ICP analysis. Results of these analyses are presented in Table 2. All four of the SEM, TEM, EDAX, and ICP analysis techniques positively identified the presence of Pd in Pd/MCM-41 samples. The calculated mass percent loadings of metal on MCM-41 provides the most accurate estimate of the actual concentrations of metal in the samples as it is based solely on the mass of metal source reagent and final sample mass. Metal source and final sample mass were determined using the best available balance, and thus sources of error in the calculated value will be minimal. Error in other techniques is high due to the greater complexity of the techniques and sample preparation procedures.
Table 2.
| % Loading Pd determined via | |||
|---|---|---|---|
| Sample | EDAX (200×) | EDAX (1000×) | ICP |
| 0.81% Pd/MCM-41 | 1.40 | 1.01 | 0.47 |
| 1.10% Pd/MCM-41 | 1.70 | 1.95 | 0.75 |
| 1.16% Pd/MCM-41 | 2.22 | 2.24 | 0.85 |
| 1.76% Pd/MCM-41 | 2.49 | 2.18 | 1.17 |
| 2.30% Pd/MCM-41 | 3.26 | 3.92 | 1.47 |
Note: EDAX, energy dispersive X-ray spectroscopy; ICP, inductively coupled plasma.
Hydrogen absorption experiments
The maximum extent of hydrogen absorption was determined from the steady-state portion of the P–C isotherm, where further increases in hydrogen pressure produced no change in H/Pd. Steady state was defined as points on the curve exhibiting less than 10% change from each previous, lower pressure point. This agreed closely with the earlier identification of steady-state portions of isotherms by visual inspection. Typical results for un-palladized, calcined MCM-41 are shown in Fig. 7 as a plot of pressure versus moles of absorbed hydrogen. Plotted results confirm no measurable sorption of hydrogen by MCM-41 support material.
Fig. 7.
A typical P–C isotherm from one experimental run using 2.04% Pd/MCM-41 is also shown in Fig. 7. Absorption occurred rapidly, with steady-state pressure generally achieved within 10 min of introducing hydrogen to CELL 2 (Fig. 1). Hysteresis shown by H/Pd results at lower pressures (<0.1 atm) during depressurization stage was typical for all runs and Pd/MCM-41 samples. Consistency of maximum H2(g) absorption between experimental runs using the same Pd/MCM-41 sample indicated that absorbed H2(g) was released when the sample was put under vacuum between runs.
The appearance of hysteresis in H/Pd results upon lowering suggests a two-phase field during absorption/desorption and a phase transition in the metal (Sachs et al. 2001; Pundt et al. 2004). Similar hysteresis results of experiments with Pd reported by other researchers were caused by a difference in the formation pressure of the metal hydride phase relative to the decomposition pressure (Flanagan et al. 1980). This phase transition results from lattice expansion and tensile stress as increasing amounts of hydrogen enter the Pd lattice and metal hydride is formed with corresponding lattice contraction during dehydriding (Flanagan et al. 1975, 1980; Flanagan and Oates 1991; Sachs et al. 2001). Misfit dislocations of the lattice as reported in bulk Pd are not expected in particles with diameter less than 4 nm (Ichinose 2000; Sachs et al. 2001). Instead, hysteresis in smaller particles is caused by a coherency, or internal elastic stress in the metal, resulting in different chemical potentials during loading and unloading of hydrogen from Pd, thus forming a hysteresis loop (Schwarz and Khachaturyan 1995; Sachs et al. 2001; Pundt et al. 2004).
Hydrogen pressurization pretreatment of Pd/MCM-41 samples (described above) removes the oxide layer on Pd, leaving a relatively reduced Pd metal. Reduced Pd on Pd/MCM-41 samples prepared following the method of Koh et al. (1997) should yield an average Pd particle size of 2–2.5 nm with good distribution within MCM-41 pores. It is proposed that hysteresis in this case results from differing chemical potentials during loading and unloading of hydrogen from Pd in samples, rather than the creation of misfit dislocations as occurs in larger diameter Pd particles.
Hydrogen absorption experiments for each Pd/MCM-41 sample were repeated a minimum of five times to demonstrate the degree of reproducibility of P–C isotherms. Results of simplified measurements are also included in this document. In these cases, only one injection of H2(g) was made and the uptake recorded. Maximum uptake of H2(g) measured in this fashion should not differ from that determined via isotherms generated from successive injections of H2(g). Hydrogen absorption results for 0.81% and 2.30% Pd/MCM-41 samples were obtained in this way.
Average H/Pd values of all steady state points on P–C isotherms for each Pd/MCM-41 sample were plotted versus the mass percent loading of Pd (Fig. 8). Average absorption at all mass percent Pd loadings was 0.85 ± 0.18 H/Pd with an apparent, overall trend of increasing absorption as mass percent of Pd on MCM-41 increased from 0.81% to 2.30%. Maximum average hydrogen absorption for a single mass percent loading of Pd was 1.07 H/Pd for the 2.30% Pd/MCM-41 sample. Minimum average hydrogen absorption for a single mass percent loading of Pd was 0.74 H/Pd for the 1.10% Pd/MCM-41 sample. The R 2 value of the trendline applied to the H/Pd versus mass percent loading Pd plot was 0.424. The critical R 2 value for five data points at a 95% confidence level is 0.878. Therefore, the apparent increase in H/Pd as mass percent Pd loading increases was deemed to be non-significant. Results of similar experiments using Pd black showed an absorption of 0.79 ± 0.09 H/Pd, which was 30% less than uptake by 2.30% Pd/MCM-41.
Fig. 8.
Hydrogen solubility in bulk Pd has been calculated as S = 27.1P 0.5 according to Sieverts’ law, where S is in mol/m3 and P is in Pa (Sachs et al. 2001). Boudart and Hwang (1975) measured hydrogen absorption of 0.50 H/Pd in small Pd particles supported on SiO2 and Al2O3 at 303 K. Jewell and Davis (2006) reported 0.03 H/Pd in α-phase Pd and 0.6 H/Pd in β-phase at room temperature. Pundt et al. (2004) reported that bulk Pd absorbed 0.6 H/Pd at room temperature, whereas Pd surfaces can absorb up to 1 H/Pd. Kuji et al. (2002) performed experiments with nano-sized and coarser-grained Pd at 298 K. They recorded absorption of just over 0.7 H/Pd at 100 kPa for coarse-grained samples, while nano-sized Pd samples of diameter 8 nm absorbed between 0.45 and 0.50 H/Pd. Sachs et al. (2001) studied surfactant- and polymer-stabilized nano-clusters of Pd at room temperature. They reported absorption between 0.40 and 0.65 H/Pd at 100 kPa for surfactant-stabilized clusters of diameter 2, 3, and 5 nm. Researchers have noted that small Rh metal clusters less than 1 nm in diameter can absorb up to eight atoms of deuterium per metal atom; however, the maximum absorption reported for Pd was lower at 3.25 mol of deuterium per mole of neutral Pd atoms and approaches unity as Pd cluster size increases (Cox et al. 1990; Sachs et al. 2001; Pundt et al. 2004).
In the only published paper to date on the H/Pd ratios in palladized MCM-41, Prasanth et al. (2010) prepared 3.7% by weight Pd-incorporated, hydrothermally synthesized MCM-41 and recorded the absorption of 0.306 H/Pd (35.1 cc H2/g) at 303 K. In their material, Pd2+ was incorporated into the MCM-41 structure during synthesis rather than being deposited onto the surfaces and within pores. Additionally, their mass percent of Pd in MCM-41 samples was greater than the 2% maximum used in this current study. Both these aspects of Prasanth et al.’s (2010) absorption study may account for their substantially lower observed H/Pd results.
A combined comparison of all published results is difficult due to the differences in reaction temperatures, support materials, mass of Pd, and preparation techniques. However, average absorption by Pd/MCM-41 at 298.2 ± 0.1 K and Pd mass percent loadings between 0.78% and 2.04% was higher than results published by other researchers using different Pd preparations and support materials. The enhanced deuterium absorption by metal particles as their diameter decreased below 1 nm reported by Cox et al. (1990) implies the possibility of similar enhancements for other small-sized transition metals. This suggests that further enhancements in hydrogen uptake may be achieved using exceptionally small particles of Pd. Enhanced absorption by Pd/MCM-41 compared to other previously published results using other Pd materials may be explained by either a larger proportion of subsurface sites in nano-sized Pd particles in Pd/MCM-41 relative to surface and bulk sorption sites or by a spillover of H2(g) onto the surfaces of the MCM-41 support material (Eriksson and Petersson 1994).
Conclusions
The average maximum amount of H2(g) absorbed by Pd in Pd/MCM-41 in this study was 0.85 H/Pd, and absorption did not vary significantly as a function of mass percent loading of Pd on Pd/MCM-41. Extent of absorption exceeded that of most other published Pd–hydrogen system results suggesting enhanced solubility of hydrogen in Pd supported on the surfaces of MCM-41. Future research should address the location and adsorption energies of H2(g) absorbed by Pd/MCM-41 as well as the possibility of further enhancements to H2(g) uptake.
Acknowledgements
Funding for this research was provided by The Natural Sciences and Engineering Research Council (NSERC). Thanks to Randy Fagan, Dr. Claude Lemaire, and Josh Crone for their technical guidance and discussions at several stages during this work.
References
Beck JS, Vartuli JC, Roth WJ, Leonowicz ME, Kresge CT, Schmitt KD, et al. 1992. A new family of mesoporous molecular sieves prepared with liquid crystal templates. Journal of the American Chemical Society, 114(27): 10834–10843.
Boudart M, and Hwang HS. 1975. Solubility of hydrogen in small particles of palladium. Journal of Catalysis, 39(1): 44–52.
Brunauer S, Emmett PH, and Teller E. 1938. Adsorption of gases in multimolecular layers. Journal of the American Chemical Society, 60(2): 309–319.
Chen KL, and Elimelech M. 2006. Aggregation and deposition kinetics of fullerene (C60) nanoparticles. Langmuir, 22(26): 10994–11001.
Cheng CF, Park DH, and Klinowski J. 1997. Optimal parameters for the synthesis of the mesoporous molecular sieve [Si]-MCM-41. Journal of the Chemical Society—Faraday Transactions, 93(1): 193–197.
Cox DM, Fayet P, Brickman R, Hahn MY, and Kaldor A. 1990. Abnormally large deuterium uptake on small transition metal clusters. Catalysis Letters, 4(4–6): 271–278.
Decyk P. 2006. States of transition metal ions in modified mesoporous MCM-41 and in microporous ZSM-5 studied by ESR spectroscopy. Catalysis Today, 114(2–3): 142–153.
Eriksson M, and Petersson L-G. 1994. Spillover of hydrogen, oxygen and carbon monoxide in oxidation reactions on SiO2 supported Pd. Surface Science, 311(1–2): 139–152.
Flanagan TB, and Oates WA. 1991. The palladium-hydrogen system. Annual Review of Materials Science, 21(1): 269–304.
Flanagan TB, Clewley JD, and Lynch JF. 1975. The effect of dislocations on the hydride phase transition in the palladium/hydrogen system. Journal of the Less-Common Metals, 41(2): 343–346.
Flanagan TB, Bowerman BS, and Biehl GE. 1980. Hysteresis in metal/hydrogen systems. Scripta Metallurgica, 14(4): 443–447.
Gaydhankar TR, Taralkar US, Jha RK, Joshi PN, and Kumar R. 2005. Textural/structural, stability and morphological properties of mesostructured silicas (MCM-41 and MCM-48) prepared using different silica sources. Catalysis Communications, 6(5): 361–366.
Guthrie CP, and Reardon EJ. 2008. Metastability of MCM-41 and Al-MCM-41. Journal of Physical Chemistry A, 112(15): 3386–3390.
Haber J, Block JH, and Delmon B. 1995. Manual of methods and procedures for catalyst characterization. Pure and Applied Chemistry, 67(8/9): 1257–1306.
Horner H, and Wagner H. 1974. A model calculation for the α-α′ phase transition in metal-hydrogen systems. Journal of Physics C: Solid State Physics, 7(18): 3305–3325.
Huang SY, Huang CD, Chang BT, and Yeh CT. 2006. Chemical activity of palladium clusters: sorption of hydrogen. Journal of Physical Chemistry B, 110(43): 21783–21787.
Ichinose H. 2000. Crystal interface and high-resolution electron microscopy—the best partner. Science and Technology of Advanced Materials, 1(1): 11–20.
Iyer RN, and Pickering HW. 1990. Mechanism and kinetics of electrochemical hydrogen entry and degradation of metallic systems. Annual Review of Materials Science, 20(1): 299–338.
Jewell LL, and Davis BH. 2006. Review of absorption and adsorption in the hydrogen-palladium system. Applied Catalysis A: General, 310(1–2): 1–15.
Koh CA, Nooney R, and Tahir S. 1997. Characterisation and catalytic properties of MCM-41 and Pd/MCM-41 materials. Catalysis Letters, 47(1–2): 199–203.
Kruk M, Jaroniec M, and Sayari A. 1997. Adsorption study of surface and structural properties of MCM-41 materials of different pore sizes. Journal of Physical Chemistry B, 101(4): 583–589.
Kruk M, Jaroniec M, and Sayari A. 1999. A unified interpretation of high-temperature pore size expansion processes in MCM-41 mesoporous silicas. Journal of Physical Chemistry B, 103(22): 4590–4598.
Kruk M, Jaroniec M, Sakamoto Y, Terasaki O, Ryoo R, and Ko CH. 2000. Determination of pore size and pore wall structure of MCM-41 by using nitrogen adsorption, transmission electron microscopy, and X-ray diffraction. Journal of Physical Chemistry B, 104(2): 292–301.
Kuji T, Matsumura Y, Uchida H, and Aizawa T. 2002. Hydrogen absorption of nanocrystalline palladium. Journal of Alloys and Compounds, 330–332: 718–722.
Mansour F, Dimeo RM, and Peemoeller H. 2002. High-resolution inelastic neutron scattering from water in mesoporous silica. Physical Review E—Statistical, Nonlinear, and Soft Matter Physics, 66(4): 041307/1–041307/7.
Mastalir A, Rác B, Király Z, and Molnár A. 2007. In situ generation of Pd nanoparticles in MCM-41 and catalytic applications in liquid-phase alkyne hydrogenations. Journal of Molecular Catalysis A: Chemical, 264(1–2): 170–178.
Park SJ, and Lee SY. 2010. A study on hydrogen-storage behaviors of nickel-loaded mesoporous MCM-41. Journal of Colloid and Interface Science, 346(1): 194–198.
Prasanth KP, Raj MC, Bajaj HC, Kim TH, and Jasra RV. 2010. Hydrogen sorption in transition metal modified mesoporous materials. International Journal of Hydrogen Energy, 35(6): 2351–2360.
Pundt A, Suleiman M, Bähtz C, Reetz MT, Kirchheim R, and Jisrawi NM. 2004. Hydrogen and Pd-clusters. Materials Science and Engineering B: Solid-State Materials for Advanced Technology, 108(1–2): 19–23.
Sachs C, Pundt A, Kirchheim R, Winter M, Reetz MT, and Fritsch D. 2001. Solubility of hydrogen in single-sized palladium clusters. Physical Review B—Condensed Matter and Materials Physics, 64(7): 754081–7540810.
Schwarz RB, and Khachaturyan AG. 1995. Thermodynamics of open two-phase systems with coherent interfaces. Physical Review Letters, 74(13): 2523–2526.
Theng BKG, and Yuan G. 2008. Nanoparticles in the soil environment. Elements, 4(6): 395–399.
Vogel W, He W, Huang QH, Zou Z, Zhang XG, and Yang H. 2010. Palladium nanoparticles “breathe” hydrogen; a surgical view with X-ray diffraction. International Journal of Hydrogen Energy, 35(16): 8609–8620.
Walter RJ, and Chandler WT. 1965. The Columbian-hydrogen constitution diagram. Transactions of the Metallurgical Society of AIME, 233: 762–765.
Wang CB, and Zhang WX. 1997. Synthesizing nanoscale iron particles for rapid and complete dechlorination of TCE and PCBs. Environmental Science and Technology, 31(7): 2154–2156.
Zhang W, Wang J, Tanev PT, and Pinnavaia TJ. 1996. Catalytic hydroxylation of benzene over transition-metal substituted hexagonal mesoporous silicas. Chemical Communications, 1996(8): 979–980.
Ziolek M, Nowak I, Kilos B, Sobczak I, Decyk P, Trejda M, et al. 2004. Template synthesis and characterisation of MCM-41 mesoporous molecular sieves containing various transition metal elements—TME (Cu, Fe, Nb, V, Mo). Journal of Physics and Chemistry of Solids, 65(2–3): 571–581.
Information & Authors
Information
Published In

FACETS
Volume 1 • Number 1 • January 2017
Pages: 248 - 262
Editor: Yang Song
History
Received: 22 July 2016
Accepted: 13 September 2016
Version of record online: 7 December 2016
Copyright
© 2016 Guthrie and Reardon. This work is licensed under a Creative Commons Attribution 4.0 International License (CC BY 4.0), which permits unrestricted use, distribution, and reproduction in any medium, provided the original author(s) and source are credited.
Data Availability Statement
All relevant data are within the paper.
Key Words
Sections
Subjects
Authors
Author Contributions
All conceived and designed the study.
CPG performed the experiments/collected the data.
CPG analyzed and interpreted the data.
EJR contributed resources.
CPG drafted or revised the manuscript.
Competing Interests
The authors have declared that no competing interests exist.
Metrics & Citations
Metrics
Other Metrics
Citations
Cite As
Colin P. Guthrie and Eric J. Reardon. 2017. Hydrogen absorption in palladized MCM-41. FACETS.
1(): 248-262. https://doi.org/10.1139/facets-2016-0034
Export Citations
If you have the appropriate software installed, you can download article citation data to the citation manager of your choice. Simply select your manager software from the list below and click Download.
Cited by
1. NMR studies of the dynamics of HD adsorbed in MCM-41