Application of phase correction to improve the characterization of photooxidation products of lignin using 7 Tesla Fourier-transform ion cyclotron resonance mass spectrometry
Abstract
Lignin is the second most abundant natural biopolymer and potentially a valuable alternative energy source for conventional fossil fuels. In this study, Fourier-transform ion cyclotron resonance-mass spectrometry (FTICR-MS) in conjunction with phase correction was applied to study photooxidation products of lignin using a 7 Tesla (T) mass spectrometer. The application of 7 T FTICR-MS has often been inadequate for the analysis of complex natural organic matter because of insufficient resolving power as compared with high-field FTICR, which led to incorrect assignments of elemental formulae and discontinuous plots in graphical and statistical analyses. Here, the application of phase correction to the FTICR mass spectra of lignin oxidation products greatly improved the spectral quality, and thus, readily permitted characterization of photooxidation processes of lignin compounds under simulated solar radiation conditions.
Introduction
Petroleum is the most important energy source today, which is unlikely to change in the foreseeable future. Because natural reserves of petroleum are finite and are declining faster than new sources are discovered (Fichman 2012), it is important to supplement fossil energy resources with biofuels. Biofuels do not only serve as alternatives to conventional fuels but also greatly reduce greenhouse gas emissions as compared to fossil fuels (Simmons et al. 2010). Although conventional biofuels are mostly derived from agriculture products such as corn starch and sugar cane, municipal and agricultural wastes such as lignin are of growing interest.
Lignin is a component of the cell wall in woody plants and second most abundant natural biopolymer after cellulose (Calvo-Flores and Dobado 2010). Lignin is considered a promising source of biofuel because its composition is very similar to that of fossil fuels (Mohan et al. 2006). As a side product in the wood industry, the global production of lignin exceeds 50 000 000 tons annually (Banoub et al. 2015). In contrast, the commercial utilization of lignin remains limited and focuses mostly on low-value products, such as dispersants in cement, raw materials for chemical syntheses, and dust suppression agents for roads (Torney et al. 2007; Simmons et al. 2010), leaving the high-value components of lignin highly underutilized as a biofuel alternative (Margeot et al. 2009).
Lignin compounds are cross-linked polymers derived from three basic monolignols: coumaryl alcohol, coniferyl alcohol, and sinapyl alcohol (Fig. S1). Catalyzed by oxidative enzymes, these monolignols can generate macromolecules with molecular masses up to 10 000 Da (Tolbert et al. 2014). The production and storage of lignin is unavoidably accompanied by extended weathering processes in the environment and one of the major natural transformation processes affecting lignin is photooxidation. To better explore the fate of lignin as a petroleum substitute, fundamental research on such natural processes is required. In fact, various photooxidation experiments have been performed for petroleum and natural organic compounds to estimate compositional changes and their environmental impact (Bobinger and Andersson 2009; D’Auria et al. 2009; Fathalla and Andersson 2011; Islam et al. 2013; Griffiths et al. 2014). For lignin, an oxidation study has only been performed under artificial UV-C light (Qi et al. 2016a). Here, we extended the previous study and used a dedicated photooxidation chamber to closely simulate the solar emission profile on the earth’s surface. Thus, the focus of the present study was to study the effects of solar irradiation on lignin compounds, to properly assess their chemical changes, and to provide data that will aid the evaluation of the environmental impact of the solar irradiation of lignin.
Structurally, lignin is a complex heterogeneous mixture of tens of thousands of different compounds with variable relative abundances (Kiyota et al. 2012). The major challenge of lignin analysis is a result of this complexity, similar to those of the analysis of crude oil (Cho et al. 2014). Various analytical methods have been developed to characterize lignin composition, including gel permeation chromatography, total organic carbon analysis, UV, and Fourier-transform infrared spectroscopy (Hanson et al. 2010; Hasegawa et al. 2011). These methods merely provided overviews of lignin compositions and sometimes gave differing estimates of the composition (Brinkmann et al. 2002). Considering the immense complexity of lignin compounds, ultra-high resolution Fourier-transform ion cyclotron resonance-mass spectrometry (FTICR-MS) was applied here for the detailed analyses of lignin samples at the molecular level.
FTICR-MS offers the highest mass resolving power among the various modern mass spectrometry platforms (Jonathan Amster 1996; Marshall et al. 1998) and hence has become the instrument of choice for highly complex mixtures. For example, it provides analyses that distinguish between the 3.4 mDa difference of the isotopic fine structures of C3 and those of SH4 (Cho et al. 2014). In principle, the resolving power of FTICR-MS increases linearly with the strength of the applied magnetic field, and therefore, high-field magnets are advantageous (Qi et al. 2012a). At present, 12 or even 15 T FTICR-MS instruments are recommended for the analysis of crude oil and natural organic matter (NOM) (Bae et al. 2011; Griffiths et al. 2014). The cost of the magnet increases approximately quadratically with field strength, however, and thus, it would be highly beneficial if measurements of complex samples could be performed using less expensive FTICR-MS instruments with smaller magnets. This issue was addressed in recent years by a new data processing method called “phase correction” (Xian et al. 2010; Qi et al. 2011). This method allows the Fourier-transformed mass spectra to be plotted in absorption mode rather than the conventional magnitude mode. In principle, the resolving power of absorption mode data improves by a factor of between and 2 accompanied by a increase in the signal-to-noise ratio (S/N) from the raw data (Comisarow 1971; Marshall 1971; Beu et al. 2004; Qi et al. 2012a). The above advantages and several other benefits (Xian et al. 2010; Qi et al. 2012b; Smith et al. 2013) of the absorption mode greatly improve the spectral quality. For example, Cho et al. (2014) applied the phase correction technique to crude oil mass spectra acquired from a 7 T FTICR-MS and found that the results matched those of magnitude mode data acquired using a 9.4 T FTICR-MS. In the present study, phase correction was applied to lignin data obtained using a 7 T FTICR-MS, and the results were evaluated in terms of improvements in the characterization of the photo-transformation products of lignin.
Experimental materials and methods
Reagents and chemicals
Methanol, acetonitrile, ammonium hydroxide, and alkali lignin powder were purchased from Sigma-Aldrich (Steinheim, Germany). The lignin powder was dissolved in a methanol–acetonitrile–ammonium hydroxide mixture (50:50:1 v/v/v) prior to analysis. Organic-free water was generated using a Millipore (Bedford, Massachusetts, USA) Direct-Q8 purification system.
Photooxidation
Photooxidation experiments were performed using a custom-built oxidation chamber (see Fig. S2) consisting of a light source array of 8 white light-emitting diodes (LED; λ = 400–800 nm; λ maximum at 620 nm; luminous intensity 7.8 cd at 65 mA; luminous flux 23.3 lm at 65 mA), 10 blue LED (λ = 410–540 nm; λ maximum at 465 nm; luminous intensity 2.5 cd at 20 mA), and 5 UV LED (λ = 355–420 nm; λ maximum at 385 nm; radiant flux 350 mW at 500 mA), which simulated the intensity and spectral profile of the solar radiation on the earth’s surface (more technical details of the implemented LEDs are given by Nichia Corp. (2017)). Two lignin samples were used in the photo-degradation experiment: a control sample, and a solar-irradiated sample that was kept in the oxidation chamber for 14 d. For the control, the lignin powder was placed in a sealed conical flask that was wrapped in aluminum foil to prevent exposure to light.
High-resolution mass spectrometry
Samples were analyzed using electrospray ionization in negative ion mode. Mass spectra were recorded using a 7 T FTICR-MS instrument (Bruker, Bremen, Germany), equipped with an Infinity Cell (Caravatti and Allemann 1991). For each mass spectrum, 100 individual transients (duration of 1.89 s) were collected and co-added to enhance S/N (Marshall and Verdun 1989).
Data processing
Broadband phase correction of the mass spectra was performed using the Bruker FTMS processing software version 2.1.0 (a screenshot of the instrument settings is shown in Fig. S3). Both magnitude mode and absorption mode spectra were analyzed using a combination of DataAnalysis 4.2 (Bruker) and Composer 1.5.0 (Sierra Analytics, Modesto, California, USA). The full-scan mass spectra were internally calibrated throughout the m/z range from 121 to 927 using a series of homologous lignin compounds consisting of well-characterized building blocks. Elemental formulae were only assigned to the peaks inside the calibrated m/z range, with the following constraints for the lignin compounds: composition was restricted to C, H, and O; H/C ratios from 0.6 to 2, O/C ratios from 0 to 0.9, and double bond equivalents (DBE) from 4 to 30; the acceptable mass error was set to ±1 ppm for singly-charged ions.
Apodization of mass spectra
When a Fourier transformation is performed for a finite transient recorded by FTICR-MS, it will generate “tails” for the peaks, the extents of which vary depending on the damping mode of the signal. These tails can interfere with adjacent low-intensity peaks (Marshall et al. 1979). For this reason, the time-domain transient is often multiplied by a window function prior to Fourier transformation to smooth peak shapes and to minimize the sideband intensities (Marshall and Verdun 1989). This procedure is called “apodization”. An optimal window function removes the sidebands at a cost of resolving power and S/N (Qi et al. 2013). However, the success of apodization depends on the transient acquisition time and its damping constant; detailed investigations have shown that its effect varies significantly from sample to sample and from spectrum to spectrum (Kilgour and Van Orden 2015). In principle, it has been shown that a full-window apodization is optimal for the magnitude mode (Lee and Comisarow 1987), whereas a half-window is suitable for the absorption mode (Lee and Comisarow 1989). In general, this practice is widely accepted to optimize the different mass spectra obtained from FTICR-MS (Beu et al. 2004; Xian et al. 2012), in particular, in petroleomics applications (Xian et al. 2010; Cho et al. 2014). In this study, lignin degradation provided very complex mixtures consisting of tens of thousands of species with variable relative abundances (Reale et al. 2004; Owen et al. 2012), similar to petroleum compounds. Hence, the magnitude and absorption mode spectra acquired were apodized based on the above rule to achieve optimum performance.
Results and discussion
Advantages of the absorption mode
Direct analysis of complex mixtures—without chromatographic pre-separation—is commonly performed with FTICR or orbitrap mass spectrometers, as these instruments provide much higher resolving powers than instruments such as quadrupole-time-of-flight-MS. In crude oil analyses, the petroleum compounds appear regularly in the mass spectrum according to the heteroatom, hydrogen deficiency, and DBE (Rodgers and McKenna 2011). For lignin, in contrast, no universal methodology has yet been proposed for classification; however, several strategies have been reported to identify the characteristic lignin components. For example, the classic Kendrick mass defect (KMD) plot was modified to quickly characterize the different linkages in the lignin oligomers (Qi et al. 2016b). These two-dimensional (2D) matrix plots provided systematic lineups of the different lignin linkages using structure-specific KMD bases, and higher lignin oligomer structures originating from the same linkages were immediately visualized in these matrix plots.
In the present work, broadband mass spectra of lignin were acquired using a 7 T FTICR-MS instrument. Mass spectra were then plotted for both magnitude and absorption modes. The original FTICR-MS signal is a composite signal of all sinusoidal waves of the frequencies of different ions. The sinusoidal waves are Fourier transformed to extract the frequency information from the recorded signal, followed by calibration to obtain the m/z domain. Unfortunately, Fourier transformation produces a complex output expressed in polar terms—magnitude and phase (Comisarow and Marshall 1974; Marshall and Roe 1978). Therefore, the projection of the frequency spectrum ranges from positive to negative as a result of the phase. To overcome this problem, the vector sum is calculated to yield a phase-independent magnitude-mode spectrum, which is displayed by most commercial and custom-made FTICR instruments (Marshall and Verdun 1989). However, the absorption-mode spectrum can be obtained if the phase shift correction is possible. The absorption-mode display offers superior mass resolving power (up to a factor of 2), mass accuracy, and sensitivity over the conventional magnitude mode (Qi et al. 2012a; Kilgour et al. 2013).
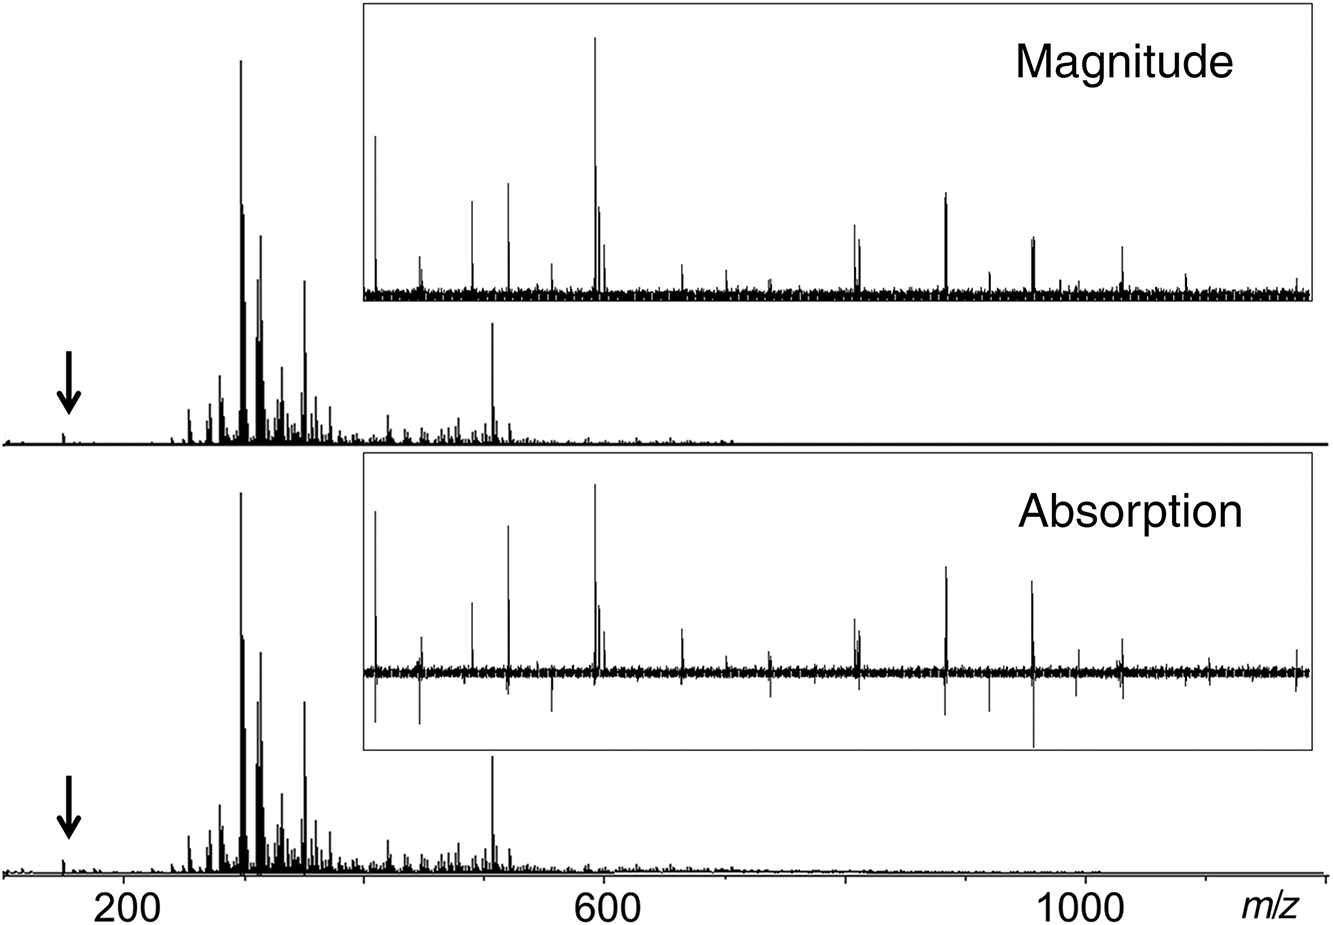
In the magnitude mode display, the average mass resolution (full-width at half maximum; FWHM) of the peak at m/z 400 was about 285 000 (Fig. 1), whereas the absorption mode spectrum demonstrated a resolution of ∼485 000, together with improved S/N of the same order. For low magnetic field FTICR-MS, the resolving power is often not sufficient to resolve the critical mass differences of 3.4 mDa (SH4 vs. C3) and 4.5 mDa (CH vs. 13C). When m/z exceeds 500, this can lead to incorrect assignments of elemental composition to mass spectral peaks and discontinuous DBE vs. carbon number plots (Cho et al. 2014). Fortunately, after phase correction, the absorption mode spectra provided enhanced spectral resolution to at least partially address this problem, as outlined in the following demonstration.
Fig. 1.
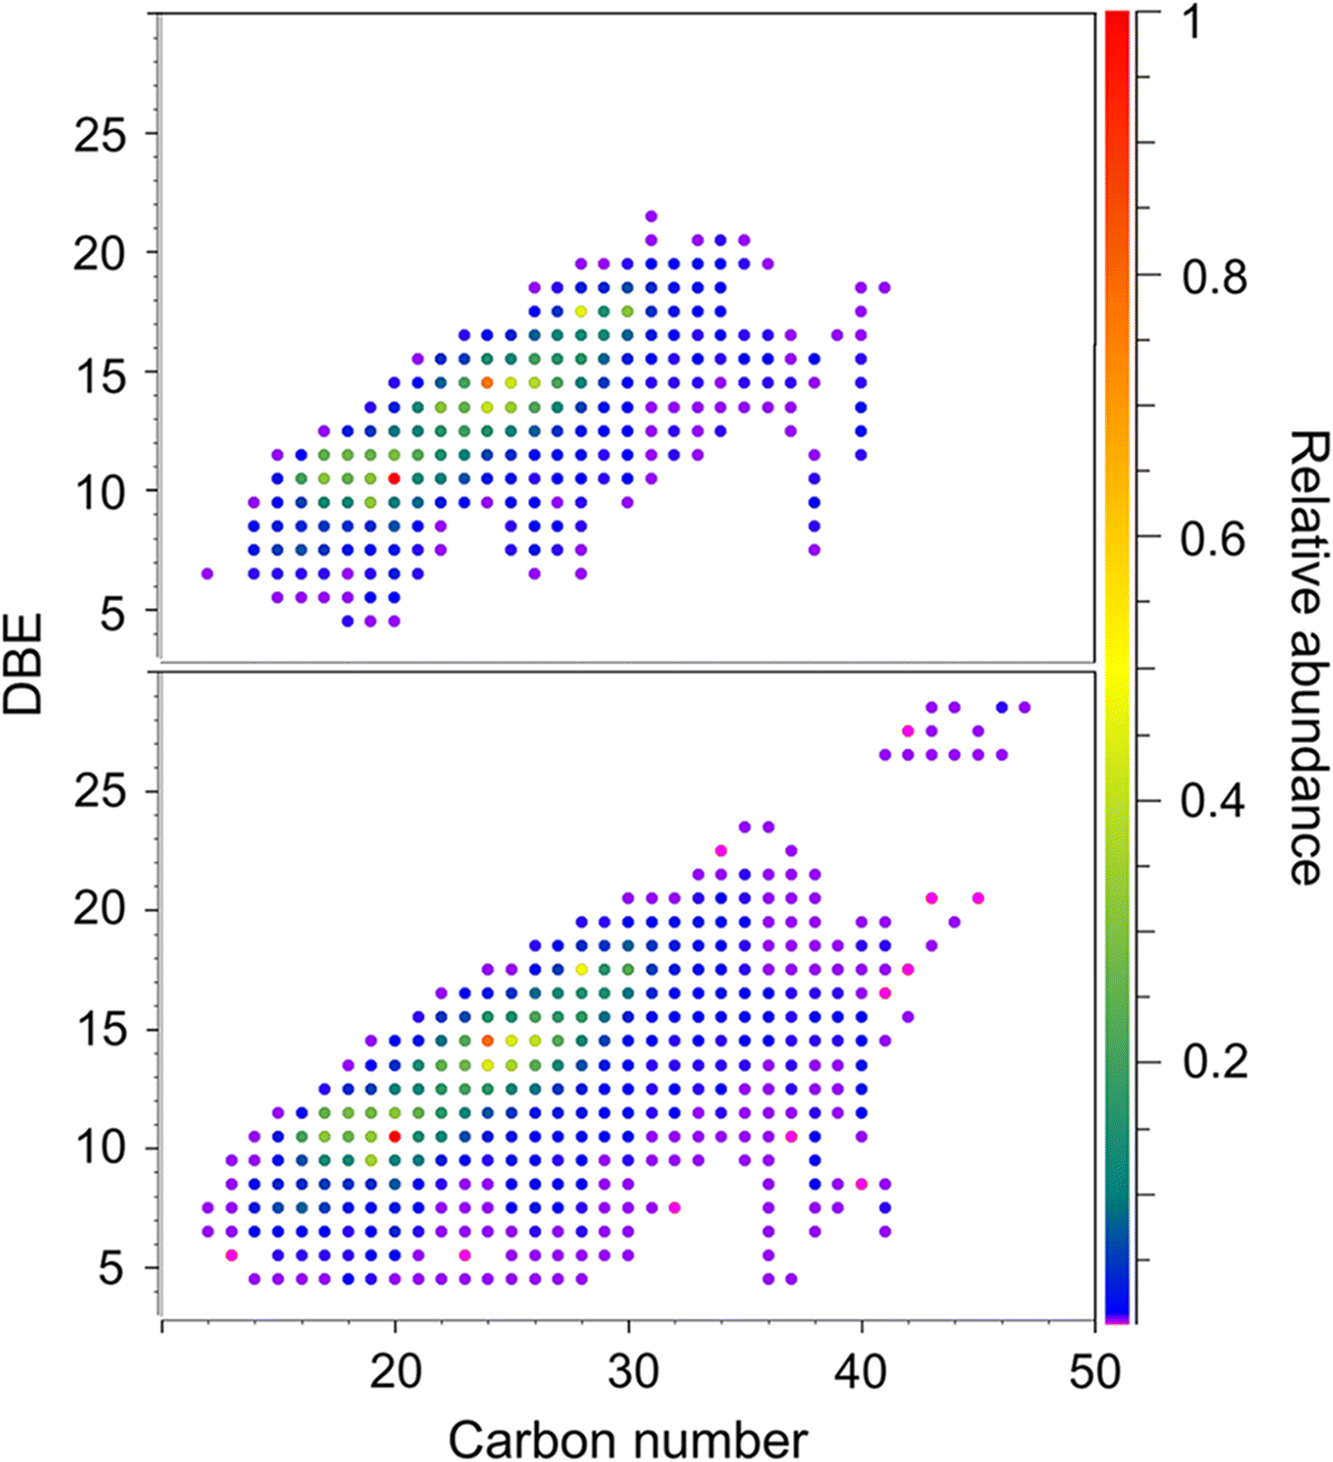
Lignins are cross-linked molecules containing various characteristic chemical linkages, and consequently, lignin molecules with unique functional groups appear at predictable regular positions relative to each other in the mass spectra (Qi et al. 2016b). In our experiments here, we used 2D KMD plots (Kendrick 1963) to recognize series of lignin compounds that contain a dibenzyl ether (C7H7O) linkage and methoxylation (OCH3) throughout the entire mass spectrum (Fig. S4); m/z windows of ∼10 mDa were expanded for the chosen compounds to compare the performance of the two mass spectral modes. As shown in Fig. 2, at low m/z, the elemental formula of compound 1 was calculated to be C16H12O8, with a small adjacent isobaric signal (compound 2, C13H16O8S) at 3.4 mDa distance (SH4 vs. C3). Because the m/z values of these two compounds were relatively low, the two peaks were successfully resolved in the magnitude mode spectrum. In the corresponding absorption mode display, the S/N of compound 2 increased sharply, and this improvement reduced the mass error of the assignment from 0.78 to −0.13 ppm (Fig. 2), even though the additional resolving power did not provide any new information in this particular example. In general, the benefits of the absorption mode display are less pronounced for compounds of low m/z. At higher m/z, however, due to the decrease of mass resolving power in FTICR and the large increase of possible elemental compositions, the improvements from phase correction become significant. This is evident in our lignin analyses, where a series of dibenzyl ether-linked polymers with increasing m/z values were identified in the mass spectra, starting from the isobaric species C16H12O8 and C13H16O8S (C3 vs. SH4). As illustrated in Fig. 2, the resolution of the two isobaric peaks C3 and SH4 decreased with increasing m/z. At m/z 679, the two close mass doublets (C38H32O12 and C35H36O12S) were only partially resolved in the magnitude mode display, whereas in absorption mode, they were almost baseline resolved, accompanied by a significant improvement of mass accuracy. This was generally observed in our lignin experiments; the phase correction method often resolved very close peaks that remained unresolved in the conventional magnitude mode mass spectra, along with greatly increased mass accuracy and a resulting lower number of possible elemental composition assignments in the lignin mass spectra obtained from low magnetic field FTICR-MS. To further demonstrate the magnitude/absorption mode differences, DBE vs. carbon number plots of the O7 lignin compounds class (C x H y O7) were plotted from both magnitude and absorption mode mass spectra (Fig. 3). It was immediately obvious that the dots drawn from the magnitude mode data exhibited gaps in the plot, and the chemical composition was not distributed continuously, especially for species with higher carbon numbers, because the mass resolving power of the 7 T FTICR-MS was not sufficient to resolve the peaks at higher m/z. Very likely, some of the neighbouring peaks (e.g., SH4 vs. C3, Fig. 2) merged; thus, only one of the compounds could be identified in the magnitude mode spectrum. The dots generated from the absorption mode display, in contrast, exhibited a more continuous pattern (Fig. 3, bottom).
Fig. 2.
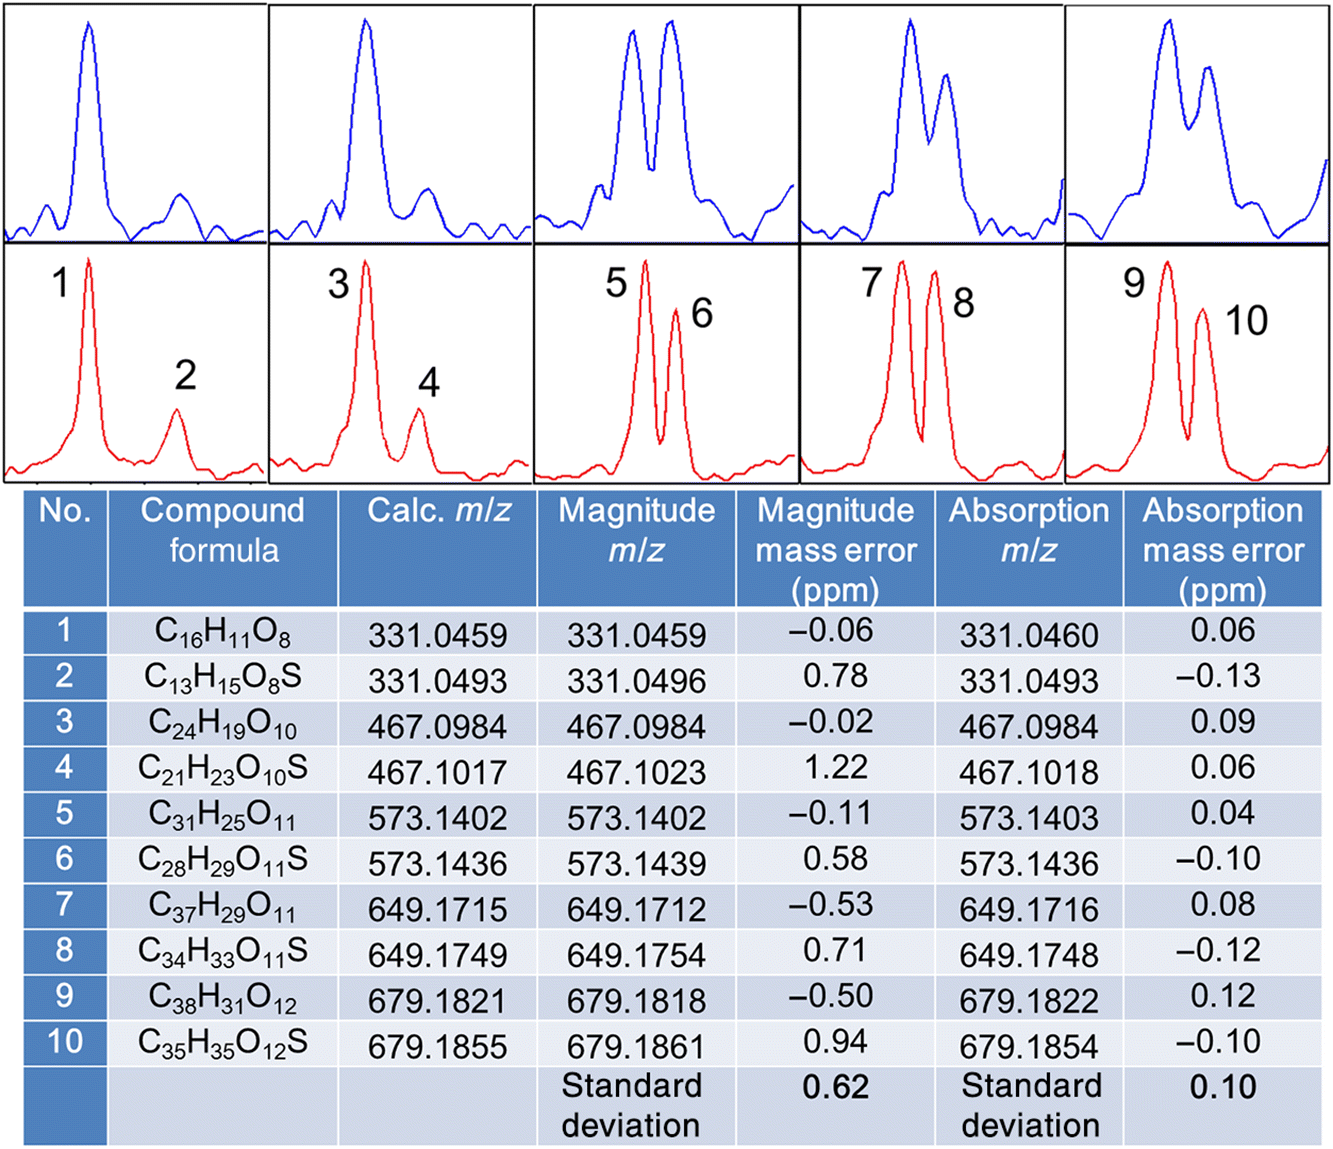
Fig. 3.
In addition to the improved spectral quality, it was also interesting to discover that the low m/z region (<200) of the absorption mode spectrum consisted of a variety of signals with negative intensities (Fig. 1, inset). A closer look at the spectrum revealed that these signals were also present in the magnitude mode spectra as regular mass spectral peaks. In fact, the negative signals were due to spectral artefacts from harmonic signals, electronic noise, or radio-frequency interference, which are common in some mass spectrometers (e.g., FTICR, orbitrap, and ion trap) (Mathur and O’Connor 2009; Qi et al. 2013). Unfortunately, these artefacts are unavoidable mass spectral features; they contain no chemical information but can seriously complicate data interpretation. For very complex mass spectra, these artefacts can overlap with real peaks, cause wiggles in the baseline and deteriorate the S/N of the spectra, and thus, have the potential to give false positive assignments. Normally, identifying such artefacts requires a comparison and correlation of the peaks in question to higher m/z primary signal peaks (Qi and O’Connor 2014); however, such a procedure would be time consuming and challenging for the complex spectra of lignin. As an example, in Fig. 1 the third harmonic region is expanded in the lignin mass spectrum. In the conventional magnitude mode the harmonics appear as typical peaks, whereas in absorption mode all artefacts could be directly recognized because artificial signals cannot be corrected properly. This ease of identifying artefacts is an important additional advantage of absorption mode spectra, in addition to the advantages described above. Thus, all lignin characterization experiments described in the following section were performed in absorption mode.
Transformations induced by solar irradiation
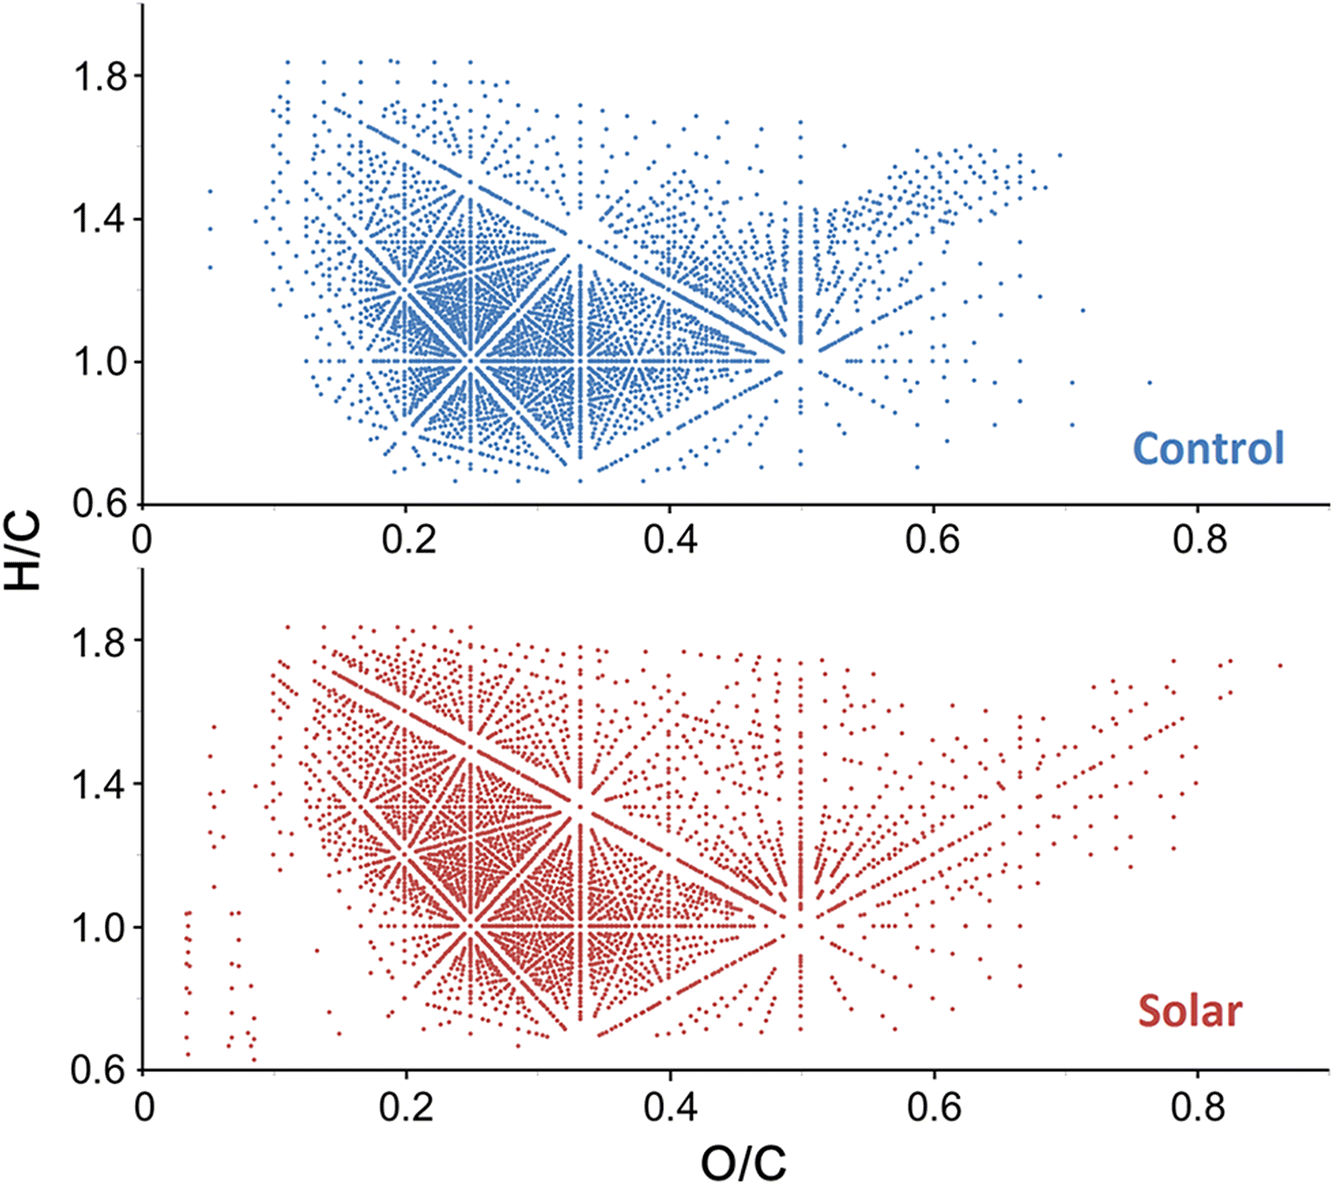
The photooxidation study performed here consisted of simulated solar irradiation of the lignin sample and comparison of the measured product distribution using absorption mode FTICR to an identical control sample that was not exposed to the light source. The simulated solar irradiation treatment was terminated after 14 d, and no visible physical differences were observed between the two sample sets. First, a van Krevelen diagram (van Krevelen 1950) was plotted to visualize the transformation of lignin compounds on a broader scale (Fig. 4). It is immediately obvious that the range of O/C ratios for the lignin compounds extends much farther in the solar-irradiated sample, as illustrated by the product distribution shifts on the x-axis (O/C ratio). This readily demonstrates the formation of new oxygenated species during simulated solar irradiation. In contrast, the y-axis exhibited similar H/C ratio ranges for the two samples. As the H/C ratio directly corresponds to the number of DBE of the lignin compounds, the unchanged H/C ratio suggests that the degree of unsaturation and the core structure of lignin compounds were likely not influenced by the solar light. The newly formed compounds were mostly located in two areas of the van Krevelen diagram: (1) O/C > 0.7, indicating addition of oxygen; and (2) O/C < 0.2 and H/C < 1, corresponding to aromatic compounds at low m/z resulting from photo-induced degradation reactions. A similar behavior was previously reported for lignin and crude oil compounds under UV irradiation (Islam et al. 2013; Qi et al. 2016a) and was explained by UV-triggered radical ion fragmentation of the benzene compounds. It was interesting to observe that the simulated solar irradiation produced far fewer fragment compounds as compared with the UV degradation experiment (Fig. S5). This was probably because the simulated solar light used here exhibited much longer wavelengths compared with the UV light of the previous study and, hence, lacked energy to excite the ions for fragmentation. In addition, some peaks detected in the low m/z region of the mass spectrum were artificial signals generated by electronic noise or harmonic peaks, which caused false positive assignments in the magnitude mode mass spectrum previously applied. Here, these noise artefacts were directly eliminated from the absorption mode display.
Fig. 4.
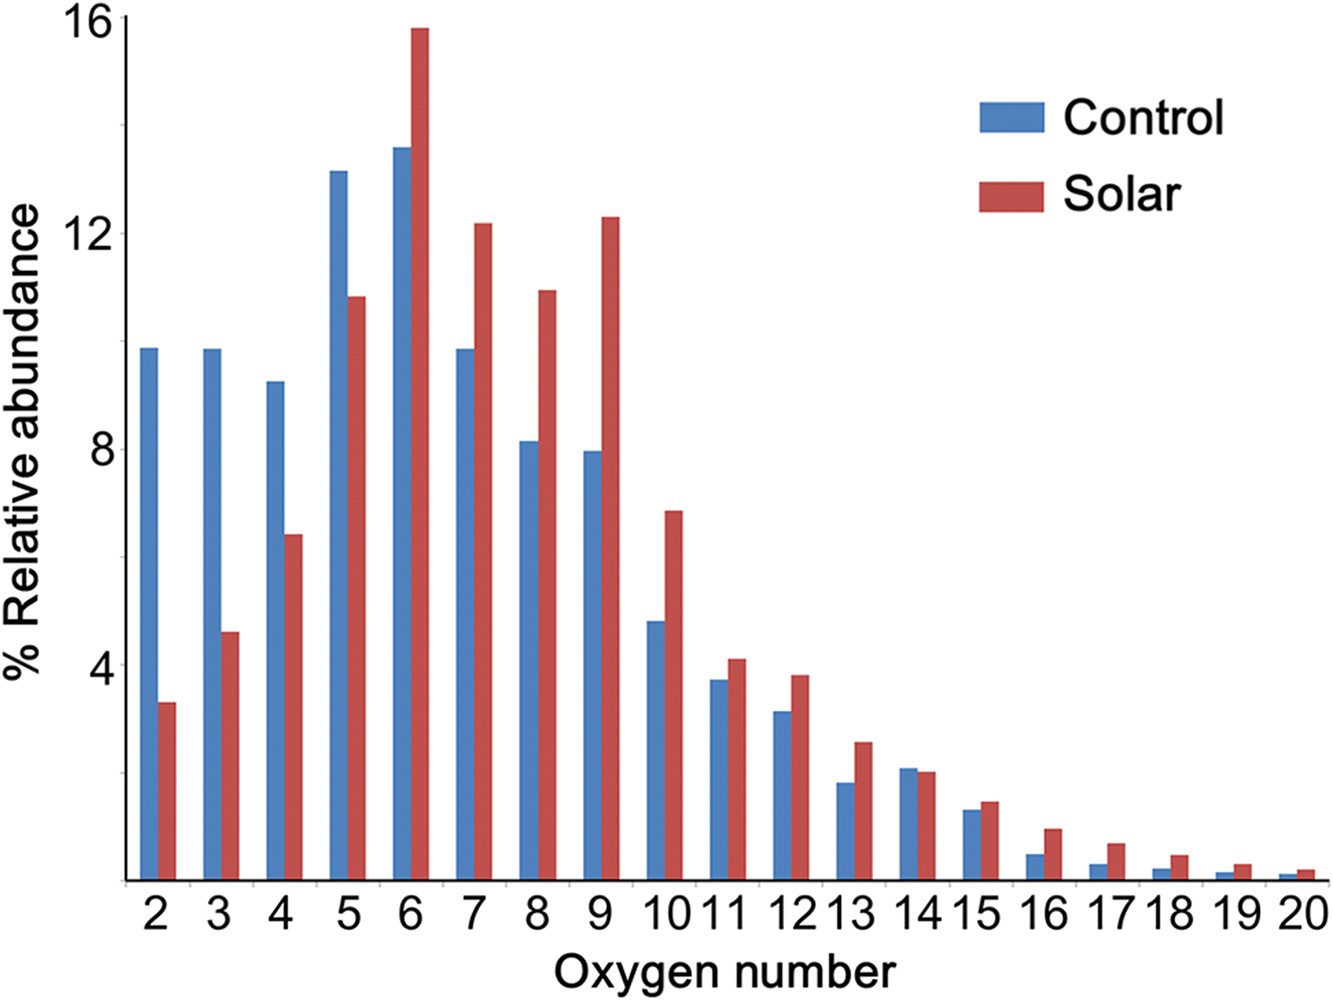
In addition to the van Krevelen diagrams, bar charts were used to visualize the different oxygen compositions of the lignin samples (Fig. 5). The oxygen number distribution shows that the abundance of compounds with two to five oxygen atoms decreased sharply and shifted to classes with higher O content (O6–10). That is, the compounds with low oxygen content were either degraded or oxidized during solar irradiation. Furthermore, compounds with more than 10 oxygen atoms in their structures appeared to be less reactive under photooxidation conditions, as the change of abundance was not significant. This phenomenon was probably caused by the photo-stability of the conjugated π-systems in lignin. Compounds with a low oxygen number are likely lignin monomers with a simple aromatic ring structure and methoxy groups; hence, they have a strong tendency to undergo rapid excited electronic state quenching by photooxidation, which results in either compound fragmentation or oxidation (Ashfold et al. 2010). In contrast, lignin compounds with a higher oxygen number are obviously polymers, likely consisting of several adjoined aromatic rings. Such conjugated π-systems can readily redistribute vibrational energy over the entire system and stabilize their core structures.
Fig. 5.
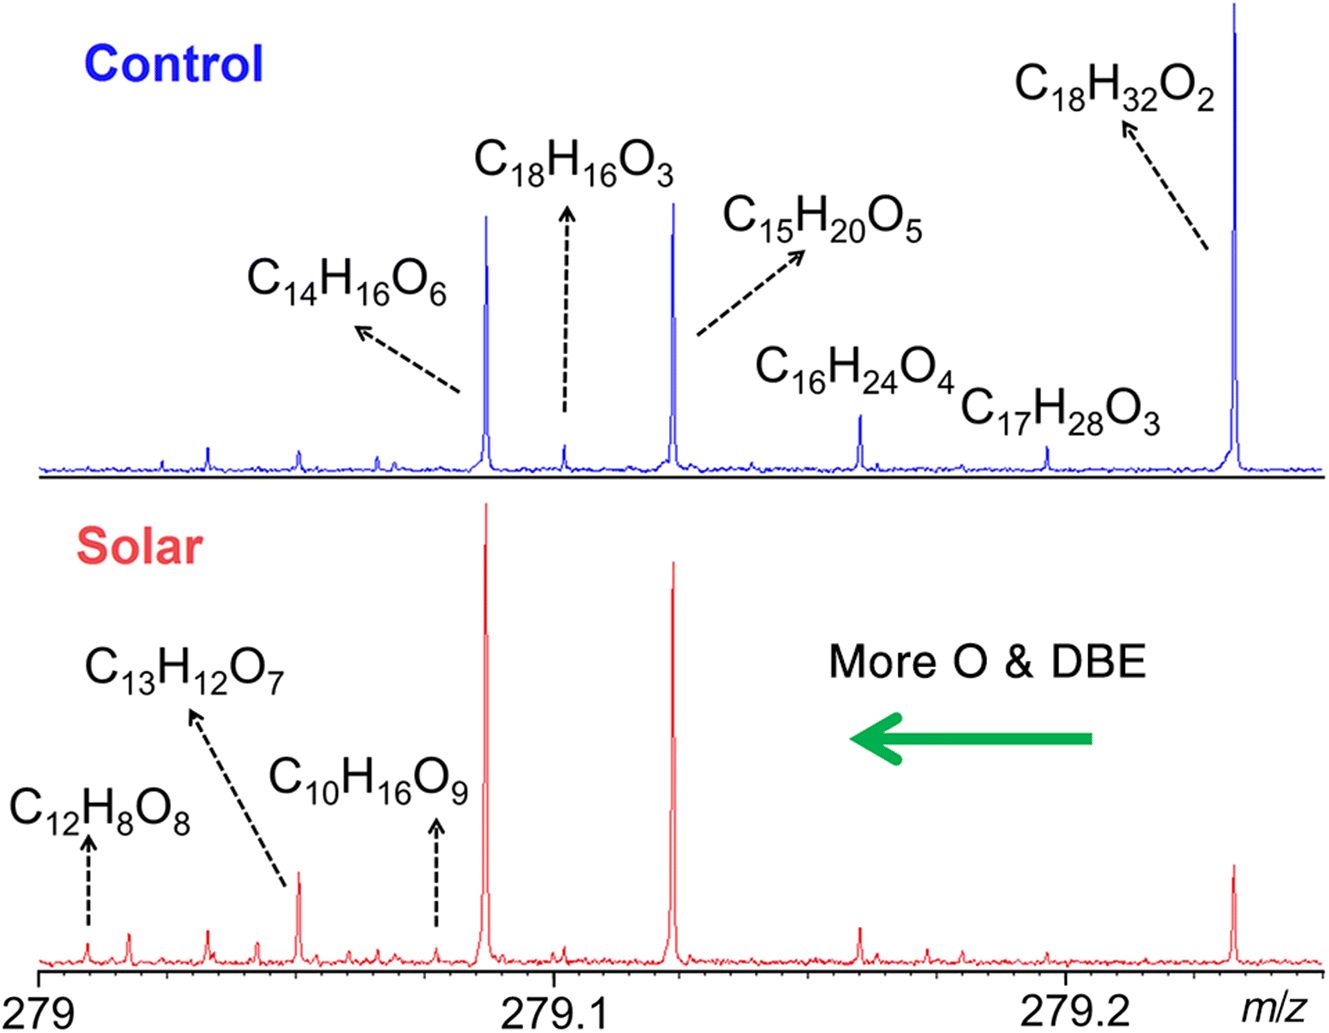
The result of simulated solar irradiation can also be observed on a micro-scale, from individual peaks of expanded segments of the mass spectra. Figure 6 shows a ∼0.25 m/z segment of the two samples, allowing 11 and 19 peaks to be assigned with unique elemental formulae in the two spectra. As lignin is composed of only three elements(C, H, and O), only six species in the control and nine species in the oxidized sample were confirmed to be lignin compounds. The other peaks were not related to lignin as they contained nitrogen or sulphur. This finding agrees with our previous oxidation experiment using UV light (Fig. S6). Several other abundant low peaks were detected in comparison with the previous UV-oxidation experiments, which was due to the enhanced capabilities of the absorption mode mass spectral analysis used in the present study, offering greatly improved S/N and mass resolution over the previous study. Nevertheless, the new lignin compounds generated by the simulated solar irradiation experiment were consistent with the compound distribution from UV experiments, indicating very similar oxidation pathways. In the solar-irradiated FTICR spectra, the overall peak abundance shifted to species with lower mass defects, due to the negative mass defects of oxygen, except for three new lignin compounds with much higher O content that were observed here.
Fig. 6.
Conclusions
This work applied the phase correction technique to mass spectra of lignin acquired using a 7 T FTICR instrument. The new absorption mode display simultaneously eliminated false positive assignments from artificial signals and improved resolving power to distinguish isotopic fine structures (such as SH4 vs. C3), which often remain unresolved in conventional magnitude mode spectra. These benefits greatly improve the performance of low magnetic field FTICR-MS for the measurement of lignin or other NOM. For lignin, we expanded the previous UV exposure experiments to simulated solar irradiation, which closely resembled the intensity and the spectral profile of sunshine on the earth’s surface. The mass spectrometry measurements demonstrated that photooxidation occurred extensively for lignin and resulted in significant abundance changes of compounds with a low number of oxygen atoms, which were particularly sensitive to the photo-irradiation. In contrast, compounds with high oxygen content were more stable than in the experiment using UV irradiation. The major difficulty of lignin analysis is the complexity of the molecular structures, with various lignin components varying over several orders of magnitude in the samples. The mechanism of lignin oxidation is not well understood, but global product shifts within the “lignome” induced by the controlled photo-transformation processes, as shown here, may provide useful insight into remediation of industrial waste, thus, supporting the use of lignin as advanced source of biofuels.
Acknowledgements
This work was supported by the German Research Foundation (DFG VO 1355/4-1 and FTICR-MS Facility, INST 256/356-1). DAV acknowledges general research support by the Alfried Krupp von Bohlen und Halbach-Stiftung.
References
Ashfold MNR, King GA, Murdock D, Nix MGD, Oliver TAA, and Sage AG. 2010. πσ* excited states in molecular photochemistry. Physical Chemistry Chemical Physics, 12(6): 1218–1238.
Bae E, Yeo IJ, Jeong B, Shin Y, Shin K-H, and Kim S. 2011. Study of double bond equivalents and the numbers of carbon and oxygen atom distribution of dissolved organic matter with negative-mode FT-ICR MS. Analytical Chemistry, 83(11): 4193–4199.
Banoub J, Delmas GH Jr, Joly N, Mackenzie G, Cachet N, Benjelloun-Mlayah B, et al. 2015. A critique on the structural analysis of lignins and application of novel tandem mass spectrometric strategies to determine lignin sequencing. Journal of Mass Spectrometry, 50(1): 5–48.
Beu SC, Blakney GT, Quinn JP, Hendrickson CL, and Marshall AG. 2004. Broadband phase correction of FT-ICR mass spectra via simultaneous excitation and detection. Analytical Chemistry, 76(19): 5756–5761.
Bobinger S, and Andersson JT. 2009. Photooxidation products of polycyclic aromatic compounds containing sulfur. Environmental Science & Technology, 43(21): 8119–8125.
Brinkmann K, Blaschke L, and Polle A. 2002. Comparison of different methods for lignin determination as a basis for calibration of near-infrared reflectance spectroscopy and implications of lignoproteins. Journal of Chemical Ecology, 28(12): 2483–2501.
Calvo-Flores FG, and Dobado JA. 2010. Lignin as renewable raw material. ChemSusChem, 3(11): 1227–1235.
Caravatti P, and Allemann M. 1991. The “infinity cell”: a new trapped-ion cell with radiofrequency covered trapping electrodes for Fourier transform ion cyclotron resonance mass spectrometry. Journal of Mass Spectrometry, 26(5): 514–518.
Cho Y, Qi Y, O’Connor PB, Barrow MP, and Kim S. 2014. Application of phase correction to improve the interpretation of crude oil spectra obtained using 7 T Fourier transform ion cyclotron resonance mass spectrometry. Journal of the American Society for Mass Spectrometry, 25(1): 154–157.
Comisarow MB. 1971. Comprehensive theory for ion cyclotron resonance power absorption: application to line shapes for reactive and nonreactive ions. The Journal of Chemical Physics, 55(1): 205–217.
Comisarow MB, and Marshall AG. 1974. Selective-phase ion cyclotron resonance spectroscopy. Canadian Journal of Chemistry, 52(10): 1997–1999.
D’Auria M, Emanuele L, Racioppi R, and Velluzzi V. 2009. Photochemical degradation of crude oil: comparison between direct irradiation, photocatalysis, and photocatalysis on zeolite. Journal of Hazardous Materials, 164(1): 32–38.
Fathalla EM, and Andersson JT. 2011. Products of polycyclic aromatic sulfur heterocycles in oil spill photodegradation. Environmental Toxicology and Chemistry, 30(9): 2004–2012.
Fichman B. 2012. Annual energy review 2011. US Energy Information Administration, Washington, DC [online]: Available from eia.gov/totalenergy/data/annual/pdf/aer.pdf.
Griffiths MT, Da Campo R, O’Connor PB, and Barrow MP. 2014. Throwing light on petroleum: simulated exposure of crude oil to sunlight and characterization using atmospheric pressure photoionization Fourier transform ion cyclotron resonance mass spectrometry. Analytical Chemistry, 86(1): 527–534.
Hanson SK, Baker RT, Gordon JC, Scott BL, and Thron DL. 2010. Aerobic oxidation of lignin models using a base metal vanadium catalyst. Inorganic Chemistry, 49(12): 5611–5618.
Hasegawa I, Inoue Y, Muranaka Y, Yasukawa T, and Mae K. 2011. Selective production of organic acids and depolymerization of lignin by hydrothermal oxidation with diluted hydrogen peroxide. Energy & Fuels, 25(2): 791–796.
Islam A, Cho Y, Yim UH, Shim WJ, Kim YH, and Kim S. 2013. The comparison of naturally weathered oil and artificially photo-degraded oil at the molecular level by a combination of SARA fractionation and FT-ICR MS. Journal of Hazardous Materials, 263: 404–411.
Jonathan Amster I. 1996. Fourier transform mass spectrometry. Journal of Mass Spectrometry, 31(12): 1325–1337.
Kendrick E. 1963. A mass scale based on CH2 = 14.0000 for high resolution mass spectrometry of organic compounds. Analytical Chemistry, 35(13): 2146–2154.
Kilgour DPA, and Van Orden SL. 2015. Absorption mode Fourier transform mass spectrometry with no baseline correction using a novel asymmetric apodization function. Rapid Communications in Mass Spectrometry, 29(11): 1009–1018.
Kilgour DPA, Wills R, Qi Y, and O’Connor PB. 2013. Autophaser: an algorithm for automated generation of absorption mode spectra for FT-ICR MS. Analytical Chemistry, 85(8): 3903–3911.
Kiyota E, Mazzafera P, and Sawaya ACHF. 2012. Analysis of soluble lignin in sugarcane by ultrahigh performance liquid chromatography–tandem mass spectrometry with a do-it-yourself oligomer database. Analytical Chemistry, 84(16): 7015–7020.
Lee JP, and Comisarow MB. 1987. Advantageous apodization functions for magnitude-mode Fourier transform spectroscopy. Applied Spectroscopy, 41(1): 93–98.
Lee JP, and Comisarow MB. 1989. Advantageous apodization functions for absorption-mode Fourier transform spectroscopy. Applied Spectroscopy, 43(4): 599–604.
Margeot A, Hahn-Hagerdal B, Edlund M, Slade R, and Monot F. 2009. New improvements for lignocellulosic ethanol. Current Opinion in Biotechnology, 20(3): 372–380.
Marshall AG. 1971. Theory for ion cyclotron resonance absorption line shapes. The Journal of Chemical Physics, 55(3): 1343–1354.
Marshall AG, and Roe DC. 1978. Dispersion versus absorption: spectral line shape analysis for radiofrequency and microwave spectrometry. Analytical Chemistry, 50(6): 756–763.
Marshall AG, and Verdun FR. 1989. Fourier transforms in NMR, optical, and mass spectrometry: a user’s handbook. Elsevier, Amsterdam, the Netherlands.
Marshall AG, Comisarow MB, and Parisod G. 1979. Relaxation and spectral line shape in Fourier transform ion resonance spectroscopy. The Journal of Chemical Physics, 71(11): 4434–4444.
Marshall AG, Hendrickson CL, and Jackson GS. 1998. Fourier transform ion cyclotron resonance mass spectrometry: a primer. Mass Spectrometry Reviews, 17(1): 1–35.
Mathur R, and O’Connor PB. 2009. Artifacts in Fourier transform mass spectrometry. Rapid Communications in Mass Spectrometry, 23(4): 523–529.
Mohan D, Pittman CU, and Steele PH. 2006. Pyrolysis of wood/biomass for bio-oil: a critical review. Energy & Fuels, 20(3): 848–889.
Nichia Corp. 2017. Light emitting diode [online]: Available from nichia.co.jp/en/product/led.html.
Owen BC, Haupert LJ, Jarrell TM, Marcum CL, Parsell TH, Abu-Omar MM, et al. 2012. High-performance liquid chromatography/high-resolution multiple stage tandem mass spectrometry using negative-ion-mode hydroxide-doped electrospray ionization for the characterization of lignin degradation products. Analytical Chemistry, 84(14): 6000–6007.
Qi Y, and O’Connor PB. 2014. Data processing in Fourier transform ion cyclotron resonance mass spectrometry. Mass Spectrometry Reviews, 33(5): 333–352.
Qi Y, Thompson CJ, Van Orden SL, and O’Connor PB. 2011. Phase correction of Fourier transform ion cyclotron resonance mass spectra using MatLab. Journal of the American Society for Mass Spectrometry, 22(1): 138–147.
Qi Y, Barrow MP, Li H, Meier JE, Van Orden SL, Thompson CJ, et al. 2012a. Absorption-mode: the next generation of Fourier transform mass spectra. Analytical Chemistry, 84(6): 2923–2929.
Qi Y, Witt M, Jertz R, Baykut G, Barrow MP, Nikolaev EN, et al. 2012b. Absorption-mode spectra on the dynamically harmonized Fourier transform ion cyclotron resonance cell. Rapid Communications in Mass Spectrometry, 26(17): 2021–2026.
Qi Y, Li H, Wills RH, Perez-Hurtado P, Yu X, Kilgour DP, et al. 2013. Absorption-mode Fourier transform mass spectrometry: the effects of apodization and phasing on modified protein spectra. Journal of the American Society for Mass Spectrometry, 24(6): 828–834.
Qi Y, Hempelmann R, and Volmer DA. 2016a. Shedding light on the structures of lignin compounds: photo-oxidation under artificial UV light and characterization by high resolution mass spectrometry. Analytical and Bioanalytical Chemistry, 408(28): 8203–8210.
Qi Y, Hempelmann R, and Volmer DA. 2016b. Two-dimensional mass defect matrix plots for mapping genealogical links in mixtures of lignin depolymerisation products. Analytical and Bioanalytical Chemistry, 408(18): 4835–4843.
Reale S, Di Tullio A, Spreti N, and De Angelis F. 2004. Mass spectrometry in the biosynthetic and structural investigation of lignins. Mass Spectrometry Reviews, 23(2): 87–126.
Rodgers RP, and McKenna AM. 2011. Petroleum analysis. Analytical Chemistry, 83(12): 4665–4687.
Simmons BA, Loqué D, and Ralph J. 2010. Advances in modifying lignin for enhanced biofuel production. Current Opinion in Plant Biology, 13(3): 312–319.
Smith DF, Kilgour DP, Konijnenburg M, O’Connor PB, and Heeren RM. 2013. Absorption mode FTICR mass spectrometry imaging. Analytical Chemistry, 85(23): 11180–11184.
Tolbert A, Akinosho H, Khunsupat R, Naskar AK, and Ragauskas AJ. 2014. Characterization and analysis of the molecular weight of lignin for biorefining studies. Biofuels, Bioproducts and Biorefining, 8(6): 836–856.
Torney F, Moeller L, Scarpa A, and Wang K. 2007. Genetic engineering approaches to improve bioethanol production from maize. Current Opinion in Biotechnology, 18(3): 193–199.
van Krevelen DW. 1950. Graphical-statistical method for the study of structure and reaction processes of coal. Fuel, 29: 269–284.
Xian F, Hendrickson CL, Blakney GT, Beu SC, and Marshall AG. 2010. Automated broadband phase correction of Fourier transform ion cyclotron resonance mass spectra. Analytical Chemistry, 82(21): 8807–8812.
Xian F, Corilo YE, Hendrickson CL, and Marshall AG. 2012. Baseline correction of absorption-mode Fourier transform ion cyclotron resonance mass spectra. International Journal of Mass Spectrometry, 325–327: 67–72.
Supplementary material
Supplementary Material 1 (PDF / 6.71 MB).
- Download
- 6.72 MB
Information & Authors
Information
Published In

FACETS
Volume 2 • Number 1 • January 2017
Pages: 461 - 475
Editor: Ian S. Butler
History
Received: 24 November 2016
Accepted: 19 April 2017
Version of record online: 30 May 2017
Copyright
© 2017 Qi et al. This work is licensed under a Creative Commons Attribution 4.0 International License (CC BY 4.0), which permits unrestricted use, distribution, and reproduction in any medium, provided the original author(s) and source are credited.
Data Availability Statement
All relevant data are within the paper and in the Supplementary Material.
Key Words
Sections
Subjects
Authors
Author Contributions
DAV conceived and designed the study.
YQ performed the experiments/collected the data.
YQ and DAV analyzed and interpreted the data.
RL and WS contributed resources.
YQ and DAV drafted or revised the manuscript.
Competing Interests
DAV is currently serving as a Subject Editor for FACETS, but was not involved in review or editorial decisions regarding this manuscript.
Metrics & Citations
Metrics
Other Metrics
Citations
Cite As
Yulin Qi, Ruoji Luo, Wolfgang Schrader, and Dietrich A. Volmer. 2017. Application of phase correction to improve the characterization of photooxidation products of lignin using 7 Tesla Fourier-transform ion cyclotron resonance mass spectrometry. FACETS.
2(): 461-475. https://doi.org/10.1139/facets-2016-0069
Export Citations
If you have the appropriate software installed, you can download article citation data to the citation manager of your choice. Simply select your manager software from the list below and click Download.
Cited by
1. FT-ICR MS Spectral Improvement of Dissolved Organic Matter by the Absorption Mode: A Comparison of the Electrospray Ionization in Positive-Ion and Negative-Ion Modes
2. Mass spectrometry‐based methods for the advanced characterization and structural analysis of lignin: A review
3. Trash-to-fuel: Converting municipal waste into transportation fuels by pyrolysis
4. Phase Correction for Absorption Mode Two-Dimensional Mass Spectrometry
5. Quadrupole detection FT‐ICR mass spectrometry offers deep profiling of residue oil: A systematic comparison of 2ω 7 Tesla versus 15 Tesla instruments
6. Characterization of Lignin Compounds at the Molecular Level: Mass Spectrometry Analysis and Raw Data Processing
7. Understanding “Fouling” in Extremely Complex Petroleum Mixtures
8. Development of a Non-Targeted Method to Study Petroleum Polyaromatic Hydrocarbons in Soil by Ultrahigh Resolution Mass Spectrometry Using Multiple Ionization Methods
9. High-resolution mass spectrometry strategies for the investigation of dissolved organic matter
10. Phase relationships in two-dimensional mass spectrometry
11. Chemical diversity of lignin degradation products revealed by matrix-optimized MALDI mass spectrometry
12. Rapid mass spectral fingerprinting of complex mixtures of decomposed lignin: Data‐processing methods for high‐resolution full‐scan mass spectra
