Open access

Risk factors associated with soft-shelled lobsters (Homarus americanus) in southwestern Nova Scotia, Canada

Publication: FACETS
18 January 2017

Abstract

Soft-shelled lobsters pose economic challenges to the lobster industry due to low meat yields and survivability during holding and transportation. Our objectives were to describe spatio-temporal patterns of soft-shelled lobsters in southwestern Nova Scotia, and identify environmental and lobster-related factors associated with shell quality. We analyzed data obtained from a broad-scale, intensive monitoring project and remotely sensed water temperatures. Mixed-effect logistic regression and linear regression methods analyzed more than 130 000 samples collected between 2004 and 2014. The annual overall prevalence of soft-shelled lobsters ranged from 9% to 38% and varied significantly among fishing areas. Shell quality was influenced by sex and size, and in the 2 months before the fishing season, lower water temperatures (4–6 weeks prior to sampling) were associated with reduced prevalence of soft-shells. High annual variability of soft-shell prevalence, that water temperature alone could not explain, suggests that adjusting fishing seasons, arbitrarily, in two fishing areas will not improve the overall shell quality of landed lobsters. Further research is needed to evaluate the effects of long-term temperature and ecosystem changes on lobster health in eastern Canada.

Introduction

The Atlantic lobster (Homarus americanus), fished across 40 managed lobster fishing areas (LFAs) in the Atlantic provinces and Québec, is one of the most important iconic seafood exports of Canada and is worth more than $1 billion (CAD) annually (Department of Fisheries and Oceans (DFO) 2014) with sustained increases in market demands.
Since the early 2000s, there has been a significant increase (from historically 5–10% to over 30–40% in recent years) in the proportion of soft-shelled lobsters landed in southwest Nova Scotia (SWNS) (ASHS 2014). Soft-shelled lobsters have lower meat yields (Rosa and Nunes 2004) and poorer survivability during handling and transportation (Factor 1995), which have negative economic consequences to the lobster industry, as well as affecting consumer confidence (Jaffry et al. 2004; Bremner 2007).
Lobster shell hardness is directly related to the timing of their molting stages, a natural process whereby they shed their exoskeleton, allowing them to grow (Cobb and Phillips 2012; Howell 2012). While they molt, a new, soft shell is formed, and lobsters actively take in water to expand and stretch this soft exoskeleton (Glenn and Pugh 2006; Laufer et al. 2013). Therefore, recently molted lobsters have reduced meat yield and excess water content, which is sometimes undesirable to consumers (Wang and Mcgaw 2014). In the days to weeks following molting, excess water is replaced with new tissue growth and re-mineralization of the newly formed exoskeleton, producing harder shells (Howell 2012).
Environmental and ecosystem-related factors such as water temperature and diet can affect the molt timing and influence shell hardness and product quality (Waddy and Aiken 1992; Mikami 2005; Hammond et al. 2006). Lobster molting occurs most frequently in the summer months, with evidence to suggest that there are some regional differences. For example, Comeau and Savo (Kunkel et al. 2012) reported that most lobsters in their study molted between early July and early September in the southern Gulf of St. Lawrence, while Campbell (Aiken and Waddy 1986) suggested that the majority of lobsters molted during the period from August to October in the Bay of Fundy.
Physiologically, an important lobster-related indicator for the molting stage and shell hardness is their hemolymph total protein level (Cobb, 1976). A rapid decrease in hemolymph protein concentrations occurs after molting when the lobster absorbs a significant amount of water to expand the capacity of its newly formed soft shell, which dilutes the hemolymph protein values. The concentrations of hemolymph protein, measured via refractometry, increase thereafter, peaking just prior to the next molt, when muscle tissue reaches its maximum capacity within the existing shell (Barlow and Ridgway 1969; Mercaldo-Allen 1991; Wang and Mcgaw 2014).
Since 2004, the Atlantic Lobster Molt and Quality (ALMQ) monitoring project (www.lobstermoult.ca) has been routinely collecting information on lobster shell quality, including lobster-related characteristics and hemolymph protein concentrations. The primary objective of the present study was to use the information collected by the ALMQ monitoring project to investigate the increased prevalence of soft-shelled lobsters in eastern Canada. More specifically, the present study attempted to describe spatio-temporal patterns of soft-shelled lobsters in SWNS, and identify lobster-related (e.g., sex and size) and environmental (sea surface temperatures (SST)) factors associated with shell quality.

Materials and methods

Lobster data

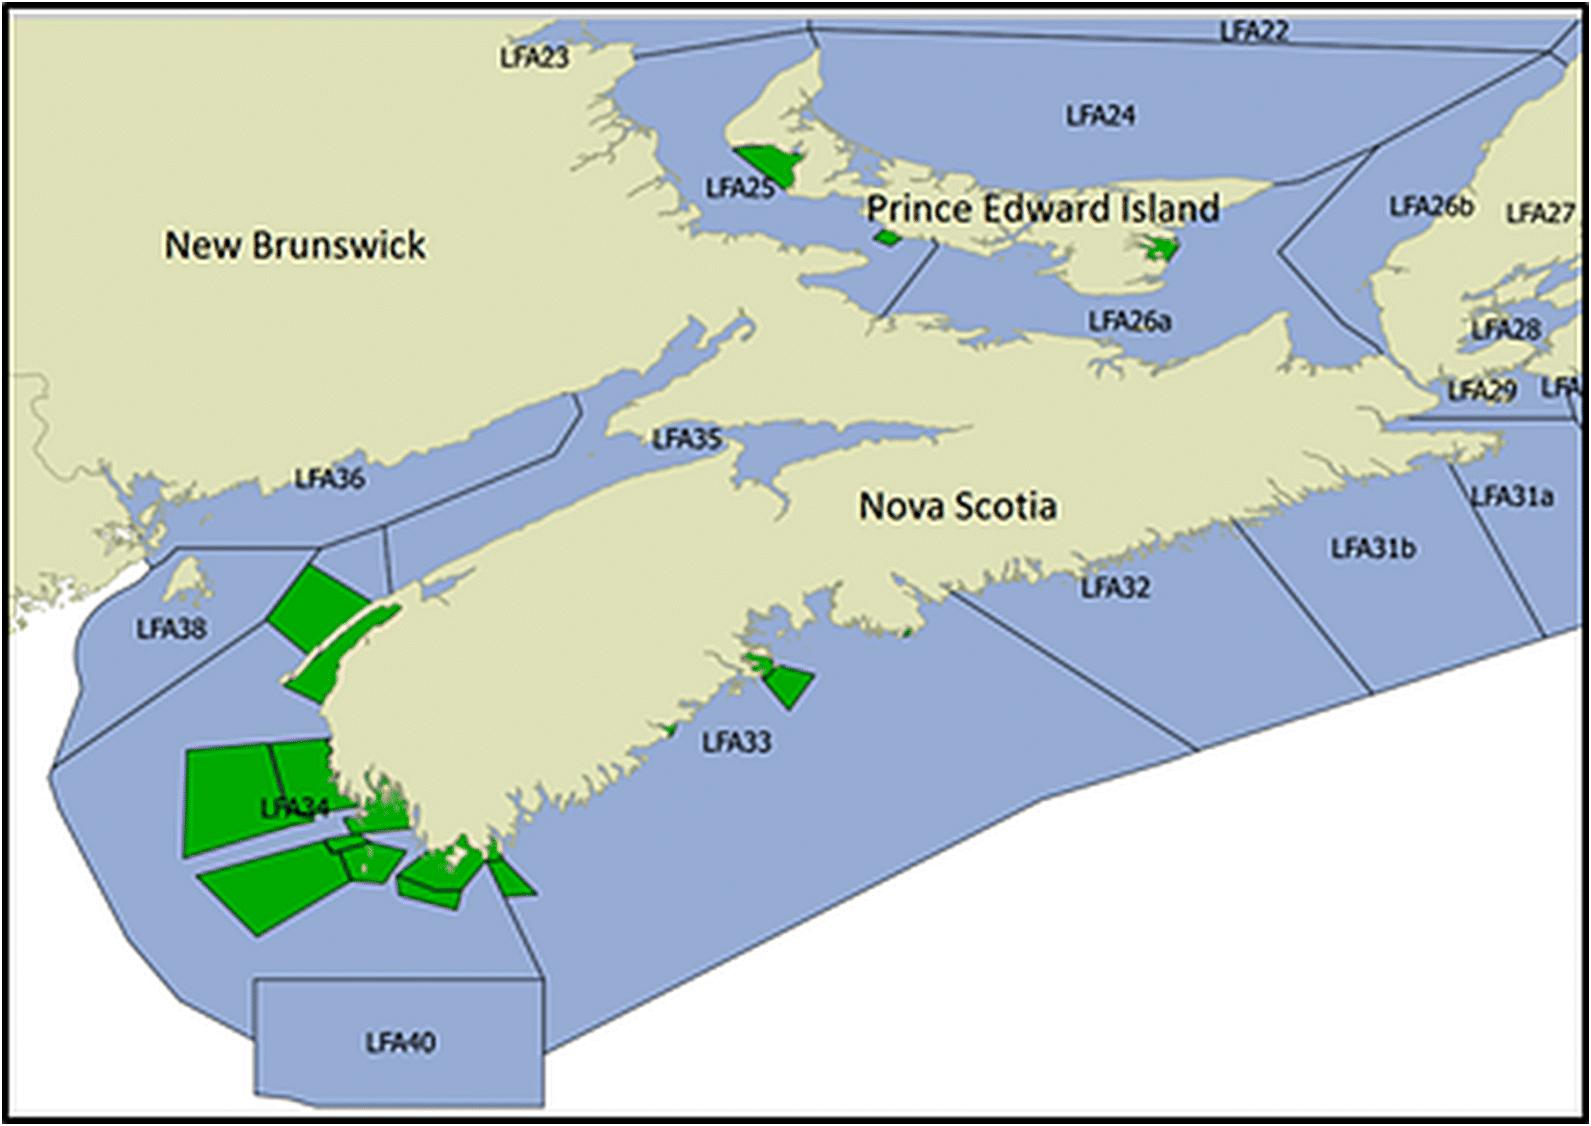
Since 2004, the ALMQ project on the east coast of Canada has sampled approximately 125 lobsters per sampling event from multiple fishing locations, within several LFAs, every 2–3 weeks (weather permitting) throughout the year, regardless of the commercial fishing seasons (Fig. 1). The sampling was carried out by technicians either from the Atlantic Veterinary College’s Lobster Science Center or from the Fishermen and Scientists Research Society by setting commercial gear in predetermined locations. The sampling frequency was chosen based on logistics and the availability of resources for sampling different fishing locations on a relatively regular basis. During sampling events, the following lobster characteristics were recorded: sex, carapace length (mm), liveliness/vigor, physical damage, molt stage, and shell hardness. The database also includes information on the sampling event date and location (LFA, fishing location, and occasionally coordinates). In addition, hemolymph was collected to estimate protein concentrations (in a Brix refractometer, and recorded as °Bx). Lobsters sampled outside of the fishing season were immediately returned to the ocean after sampling. All data were entered and stored in the ALMQ database (www.lobstermoult.ca).
Fig. 1.
Fig. 1. Map of the Maritime Provinces in eastern Canada, showing the lobster fishing areas (LFAs) in light blue, and the fishing locations (green) recorded by the Atlantic Lobster Moult and Quality monitoring project. The vast majority (93%) of the recorded lobsters in the database came from LFAs 33 and 34 in southwestern Nova Scotia; these two LFAs account for approximately 40% of all lobsters landed in Canada. Map data obtained from diva-gis.org for country level administrative data and the ALMQ project for LFA and lobster fishing location level data.

Sea surface temperatures

SST data were obtained freely online from the Ocean Color Web (http://oceancolor.gsfc.nasa.gov), which is maintained by the National Aeronautics and Space Administration (NASA). For the present study, night-time sea surface temperature (NSST) data were acquired at a 4-km spatial resolution aggregated within an 8- day composite temporal window (NASA Level 3 data access) and re-scaled to degrees Celsius. Global NSSTs were available for the period from 2004 to 2014, inclusive, as: daily, 3 day, 8 day, monthly, 32 day, seasonal, or annual composites. We chose the 8 day composites to represent weekly averages of temperatures (hereafter referred to as NASA weeks) because it was deemed the shortest time interval for which we could aggregate sufficient lobster sampling events and minimize temporal gaps—the daily and 3 day composite datasets often contained missing information due to poor satellite coverage or cloud cover. The median NSSTs for each of the fishing locations were extracted from their datasets using the statistical programming language R package (R Core Team 2015): raster (Hijmans and van Etten 2012). For the present study, median values per fishing location were used instead of the actual sampling event locations because too few samples (approximately 20%) with fully specified coordinates were available for the sampling events in the ALMQ database, and median temperature values were deemed to have appropriate spatial scales as a risk factor.

Statistical analyses

Data analysis consisted of summarizing ALMQ data, describing spatio-temporal patterns of soft-shelled lobsters, and identifying lobster-related and environmental risk factors associated with shell quality. Shell hardness was redefined as a dichotomous variable by combining soft- and medium-shelled lobsters as soft-shelled lobsters. The spatio-temporal patterns were described as the prevalence of soft-shelled lobsters stratified across LFAs and years, and all maps were created using QGIS (2015). Only two LFAs (33 and 34) had sufficient and consistent data throughout the years and were included in our analyses for the present study. These two LFAs contributed to more than 93% of the records in the ALMQ database and represent approximately 40% of the annual lobster landings in Canada.
As hemolymph protein concentrations were also available, and previous studies reported an association with shell quality, the level of agreement between °Bx and lobster shell hardness was evaluated for its predictive ability. More specifically, two-graph receiver operating characteristic analyses were used for this task and to evaluate appropriate °Bx cut-point values to potentially classify shell hardness.
The risk factor analyses were separated into three parts. The first consisted of identifying lobster-related risk factors, namely sex and carapace length, on the prevalence of soft shells, using mixed-effect logistic regression models, and adjusting for LFAs (33 and 34), year, and months (January to December). The second consisted of linear mixed-effect regressions describing short-term (within a few weeks) effects of NSSTs on weekly-aggregated proportions of soft-shelled lobsters. The third analysis consisted of evaluating the long-term effects of NSST and carapace length, using linear mixed effect regression, on weekly aggregated proportions of soft-shelled lobsters. The random effects for the logistic and linear models were sampling event, and the unique combination of year and fishing location, respectively. Fishing locations are smaller areas within LFAs (see Fig. 1); our analyses included 12 fishing locations from LFAs 32 and 33. The model-building process included the assessment of potentially non-linear relationships between predictors and outcomes, with two-term fractional polynomials (FPs). All models were evaluated by calculating their best linear unbiased predictions (BLUPs) for their random effect, and were plotted against their predicted outcome to verify the assumption of homoscedasticity. Normality assumption was verified by plotting the quantiles of their BLUPs, for both random effects and the lowest level residuals against the quantiles of normal distribution (Dohoo et al. 2009). Statistical significance was set at P < 0.05, and all statistical analyses were performed using Stata (Release 14.1; StataCorp, College Station, Texas, USA, 2015).

Risk factor analyses

Mixed-effect logistic regression models (Hosmer and Lemeshow 2004) with soft shell (1/0) as the dependent variable and sampling event as random effect, were fit to identify lobster-related factors associated with soft-shelled lobsters. These models also included LFAs, and year and month of sampling as fixed effect variables to show spatio-temporal patterns of shell quality. An approximate intra-class correlation coefficient (ICC) was computed for sampling events to represent the similarity between observations within sampling events.

Temporal linear mixed models with SST

One of the main interests for modeling water temperature was to investigate the effect of temperature (starting several weeks before the fishing season) on the shell quality of landed lobsters for that particular fishing season. It might be possible to reduce the prevalence of soft-shelled lobster landings by adjusting the start of the fishing periods in LFA 33 and 34 based on recent historical water temperatures, instead of using the current fixed dates. To achieve this goal, the temporal dataset was truncated to straddle the start of fishing seasons; fortunately, the fishing seasons for both LFAs are identical, starting every year on the last Monday of November (approximately the 42nd NASA week) and ending 31 May.
For these analyses, all ALMQ data were aggregated by NASA week and fishing location, to produce averages (proportions) of soft-shelled lobsters as the outcome, and averages for carapace lengths, year, and sex ratios as predictors. The dataset was truncated (interrupted) from the 32nd NASA week (starting in early September) to the end of the year (46th NASA week), in an attempt to reduce the strong seasonal effect present on shell quality. Sensitivity analyses were used to select the most appropriate study period with the aim of producing the narrowest temporal window prior to the fishing season, while preserving temperature estimates with the strongest statistical power (sample size).
The aggregated proportions of soft-shelled lobsters (within a NASA week and fishing location) were modeled with a linear mixed model, with location–year as a random effect. Power transformations, based on Box-Cox analyses, were performed to correct for model violations for continuous outcomes. For the temporal models, several scenarios for lagged temperature effects were created to represent recent historical water temperatures. More specifically, moving averages (MAs), which are averaged temperatures from several combinations of lagged NASA weeks, were created: from 1 to 3, 4, 5, 6 and 7; from 3 to 6 and 7; and from 4 to 6 (MA4–6) and 7 NASA weeks prior to the sampling NASA week. The potential influence of temporal autocorrelation was evaluated with the addition of either a first-order autoregressive (AR1) or an exponential autocorrelation structure to the residuals in the model.
In addition to the analyses on the truncated dataset, separate analyses were performed for the full dataset (uninterrupted temporal model from 2004 to 2014) to model the long-term trends of the probabilities for soft-shelled lobsters, temperatures, and lobster carapace length as the outcome variables throughout the decade of data. For these models, Fourier terms (sine and cosine) were created to account for seasonal patterns (intra-annual variation).

Assessing the impact of moving fishing season

We evaluated the potential impact of moving the fishing season from its current start time (last week of November: approximately week 42), one week at a time, and estimated the corresponding changes in probability of soft-shelled lobsters up to three weeks before and three weeks after the current fishing season.
We also evaluated the effect of making the fishing season dynamic, depending upon water temperature profiles in preceding weeks, by choosing the week for the start of the fishing season in each study year based on a cutoff temperature, and estimated the corresponding changes in probability of soft-shelled lobsters three weeks before and three weeks after that week.
In these two analyses, the uninterrupted dataset with the aggregated proportions of soft-shelled lobsters (within a NASA week and fishing location) was modeled using linear mixed regression, using a combination of year–location and location as the random effect, respectively.

Recommendations for future sampling strategies

Given the considerable amount of data collected by the ALMQ monitoring project, one additional study objective was to determine whether the sample sizes of lobsters per sampling event were appropriate, and if resources could be allocated differently to gain more information. To achieve this, a simulation with series of subsampling schemes (ranging from 25 to 100 lobsters, in increments of 25, per sampling event) was performed to determine whether smaller samples sizes per sampling event would produce similar results to those from the full study.

Results

ALMQ description

The ALMQ database contained records for 133 445 lobsters sampled between 2004 and 2014 from 1013 sampling events in 25 different fishing locations within six LFAs (see Table 1). Overall, 21.1% (95% CI: 20.8–21.3) of the lobsters had soft shells, which ranged annually from 9% to 38%. LFAs 33 and 34 had higher proportions of soft-shelled lobsters than the other LFAs in the study (P = 0.01). The sample sizes and prevalence of soft-shelled lobsters for each of the sampled LFAs during years 2004–2014 is presented in Table 1. The overall proportion of males (0.54, 95% CI: 0.54–0.55) was higher than that of females, and was consistently higher throughout the years in the sampled lobsters. The overall median carapace length of lobsters was 87 mm (interquartile range (IQR): 80–93); however, there was a long-term trend of an increase in the average carapace lengths for LFA 33 and 34 between 2004 and 2014, as noted in the results from the uninterrupted temporal model from 2004 to 2014.
Table 1.
Table 1. Number of lobsters collected by the Atlantic Lobster Molt and Quality (ALMQ) monitoring project together with soft-shelled prevalence (%), by year and lobster fishing area (LFA) on the east coast of Canada between 2004 and 2014.
 n (%) by LFA 
Year242526A333435Overall
20042615 (16.8)3942 (18.2)6557 (17.7)
20053946 (23.9)11 598 (29.1)15 544 (27.8)
20063140 (22.2)14 657 (23.4)17 797 (23.2)
20072223 (30.3)13 688 (14.1)15 911 (16.3)
20081803 (15.6)295 (6.1)3498 (31.4)8916 (16.9)14 637 (19.9)
2009434 (8.5)1644 (6.8)1834 (8.6)3637 (29.3)7239 (20.6)125 (14.4)14 913 (19.3)
2010494 (14.8)1964 (10.6)1447 (3.4)3580 (16.3)8056 (6.1)125 (4.8)15 791 (8.9)
20111610 (22.6)1744 (7.8)3226 (26.9)8876 (14.6)15 456 (17.2)
20122061 (39.5)6722 (37.1)125 (37.6)8908 (37.7)
20131692 (38.6)5865 (32.6)7557 (33.9)
2014374 (27.5)374 (27.5)
Overall928 (11.9)7021 (13.7)5320 (6.8)29 992 (26.5)89 559 (20.8)375 (18.9)133 445 (21.1)

Hemolymph protein

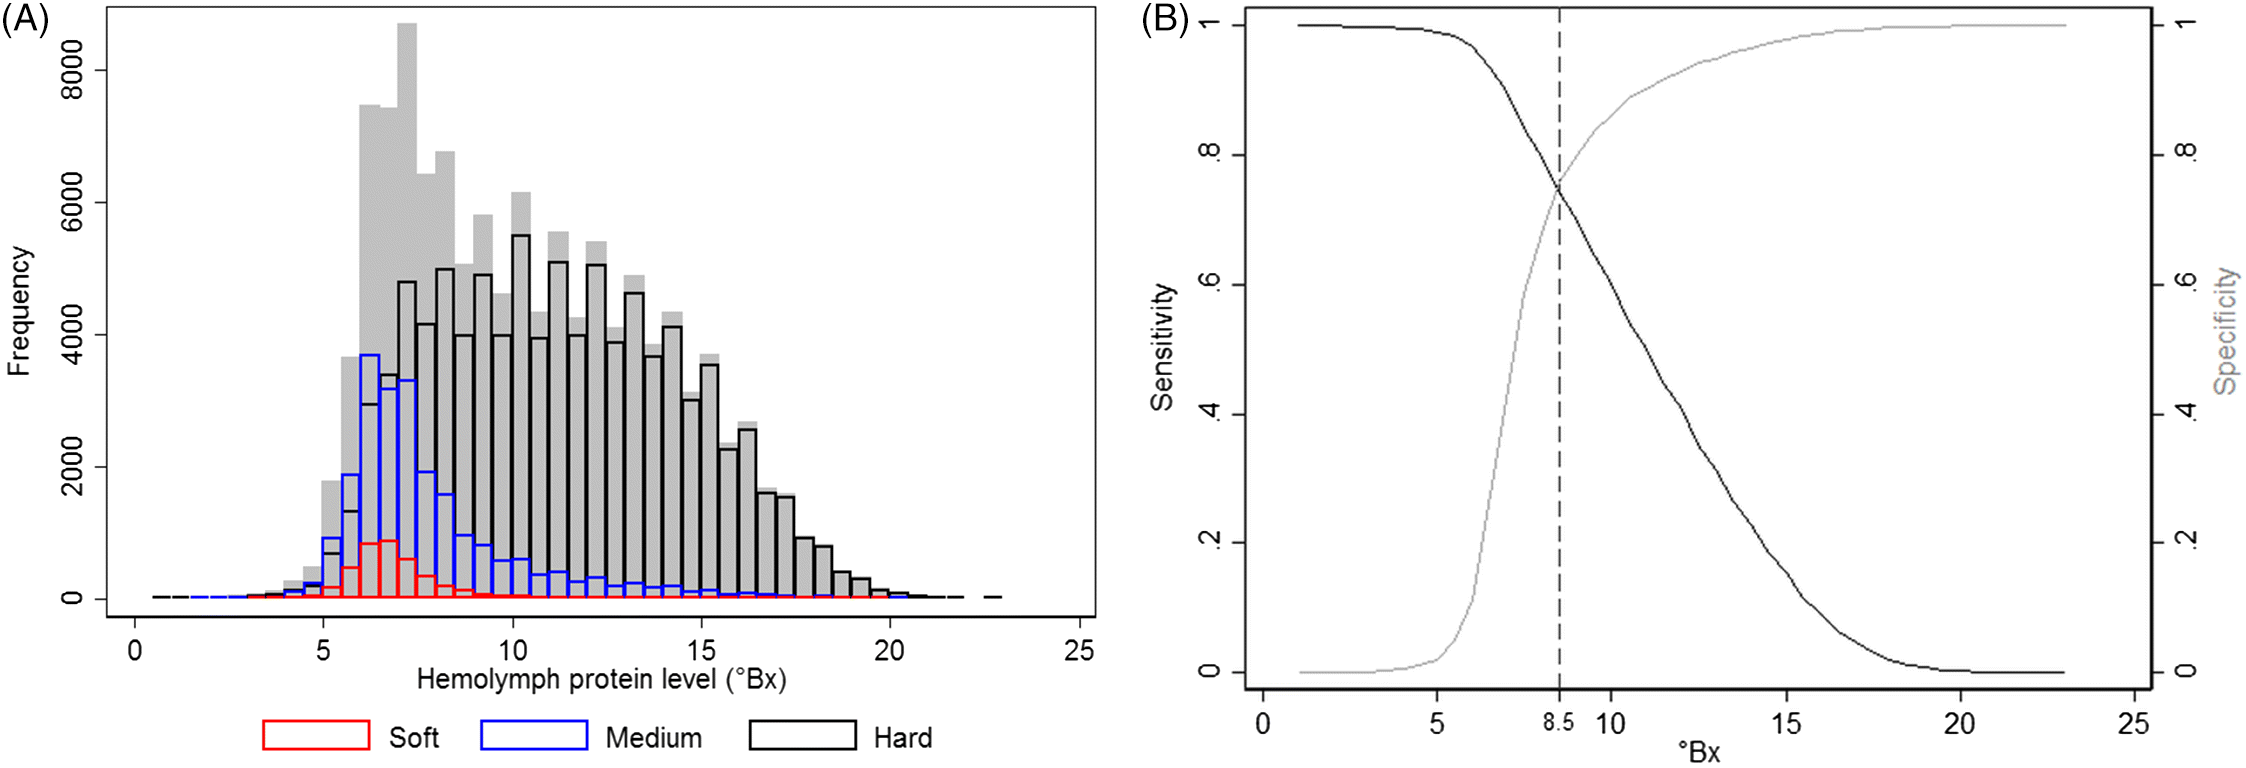
The median hemolymph protein level in individual lobsters was 9.8 °Bx (IQR: 7.3–12.9). As expected, there was a significant inverse association between the probability of lobsters having soft shells and their levels of hemolymph protein (every decrease of 1 °Bx increased the odds of having a soft shell by 52%; P < 0.001, model not shown). However, using absolute hemolymph protein values and (or) applying cut-points to classify shell hardness had some limitations, with only a moderate ability to correctly classify shell hardness (see Fig. 2). For example, even when using the cut-point with the highest level of agreement (set at 8.5 °Bx), both the sensitivity and specificity were less than 80%.
Fig. 2.
Fig. 2. Histogram (A) for hemolymph protein (measured in °Brix), for all lobsters (shaded gray), and by shell hardness (Soft, Medium, and Hard). A two-graph receiver operating characteristic (ROC) curve (B) for the classification of shell hardness (Soft and Medium versus Hard) by °Bx.

Spatio-temporal trends and risk factors

The final logistic regression model, used to describe lobster-related risk factors and spatio-temporal trends of soft-shelled lobsters, included 119 758 observations and demonstrated a significant interaction between carapace length and sex. For each additional mm in length for males the odds of having a soft shell increased by 0.042 (95% CI: 0.039–0.041), while it increased by 0.037 (95% CI: 0.035–0.038) for females. LFA 33 had on average higher probabilities of having soft-shelled lobsters compared to LFA 34, but these differences varied by month (Fig. 3A). The approximate ICC within sampling events was 0.243 (95% CI: 0.222–0.266), indicating a sizeable clustering in the probabilities of having soft-shelled lobsters within each sampling event group. The model also showed that years accounted for a large portion of the variability (strong inter-annual variation); specifically, in 2005 and from 2012 onward, the probability of soft-shelled lobsters was higher than for other years (P < 0.001, Fig. 3B).
Fig. 3.
Fig. 3. Estimated probabilities of soft-shelled lobsters (n = 119 758) in LFAs 33 and 34 in eastern Canada by (A) calendar month and LFA from 2004 to 2014 and (B) year, as fixed effects as determined from a mixed logistic regression, with sampling event as a random effect. The same model was re-run as a simulationshowing respective estimates by (C) calendar month and LFA and (D) from 2004 to 2014, with 25, 50, 75, and 100 lobsters sampled within each sampling event.

Temporal effects of NSST

Short-term temperature effects approaching fishing seasons (interrupted temporal models)

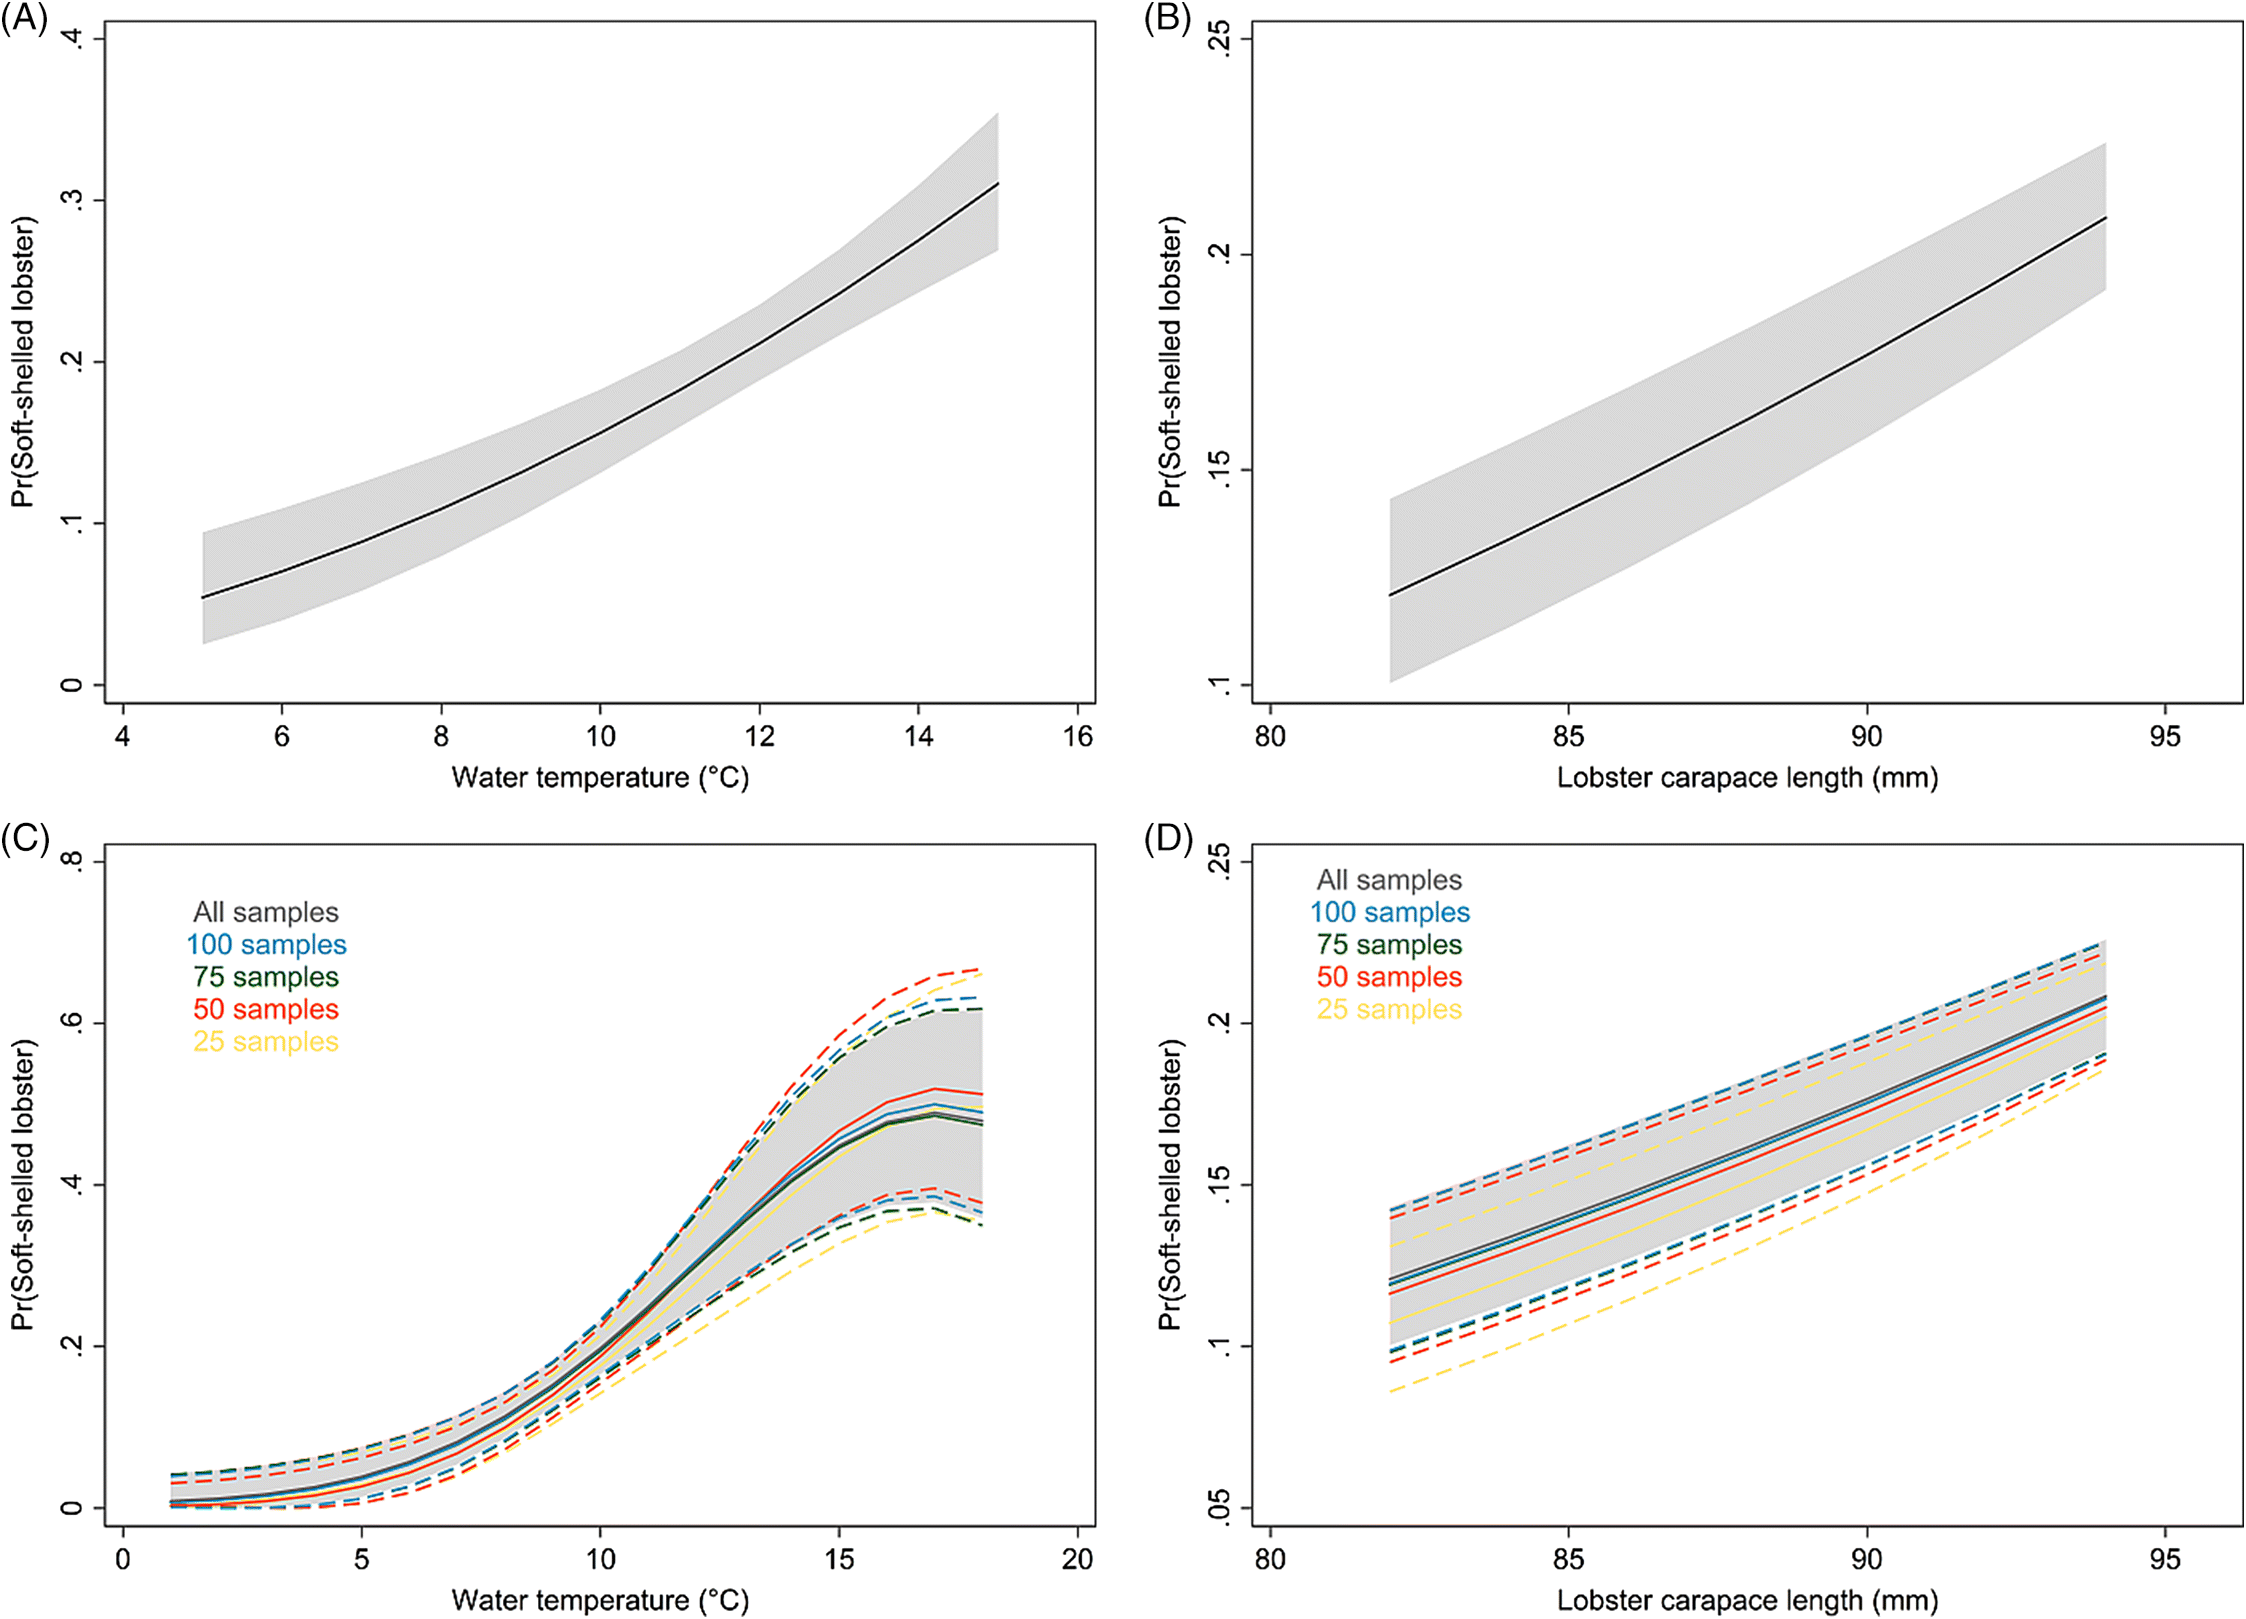
The final linear regression model with short-term effect of NSST included 229 observations. A sensitivity analysis determined that the six-week period (NASA weeks) leading up to the fishing season, and continuing to the end of the year, was the optimal study period that preserved temperature estimates while maximizing the sample size. The outcome variable for these linear mixed models (aggregated probabilities of soft-shelled lobsters within a location and NASA week) underwent a square root transformation to meet model assumptions, and there were no significant autocorrelation structures present in any of these model residuals. Within the present study period, there was a lagged short-term effect of water temperature on shell quality, where the best-fitting predictor was found to be a moving average of 4–6 NASA weeks (MA4–6), and there was a significant year effect. Figure 4A shows the back-transformed (original scale) estimated lagged temperature effect (MA4–6) on the probabilities of soft-shelled lobsters, which demonstrates a linear and positive relationship during this lagged moving-average window.
Fig. 4.
Fig. 4. (A) Estimated probabilities of soft-shelled lobsters on the east coast of Canada (LFAs 33 and 34) as determined using a mixed linear regression model (n = 229), with lagged effect of water temperature (moving average 4–6 weeks prior to sampling; MA4–6) and (B) year as fixed effects (lines increasing in darkness from 2004 to 2014) and year–location as a random effect. (C) Locally weighted scatterplot smoothing for weekly (NASA) water temperatures (moving average 4–6 weeks prior to sampling; MA4–6) aggregated by year—lines increasing in darkness from 2004 to 2014.
The ICC for the year–location random component of this model was 0.254 (95% CI: 0.107–0.507), in contrast to 0.285% (95% CI: 0.145–0.483) when all fixed effect variables (lagged temperature and year) were removed and 0.417 when fixed effect of years were removed in alternate baseline models (not shown). In general, increasing ICCs indicate greater similarities in the outcome values (i.e., soft-shelled probabilities) within the specified random variable (i.e., year–location groups). However, adding the lagged temperature effect and improving the ICC did not greatly enhance the predictive ability of the model, particularly as the estimated effect of changing fishing season by a few weeks (equivalent to changing short-term temperatures by approximately 1–2 °C; see Fig. 4C) would be relatively modest in comparison to the estimated inter-annual differences (between year–location groups, see Figs. 3B, 4B).

Uninterrupted temporal model from 2004 to 2014

The final uninterrupted temporal model (n = 735) included one sine and cosine term (NASA week as the degree variable, with one pair of variables specified) to capture the inter-annual variability of the soft-shelled lobster proportions. There were two other significant predictors in this model: lagged temperatures (moving average of 4–6 NASA weeks), modeled with fractional polynomial terms (two cubed terms, P < 0.001 for both), and average carapace length (P < 0.001)—the effect of both predictors are presented graphically in Fig. 5. The autoregressive first-order (AR1) autocorrelation structure to the residuals significantly improved the regression models, yielding an estimated AR1 coefficient (ρ) of 0.628.
Fig. 5.
Fig. 5. Estimated probabilities of soft-shelled lobsters on the east coast of Canada (LFAs 33 and 34) as determined using a mixed linear regression model (uninterrupted temporal model from 2004 to 2014, n = 735) with (A) lagged effect of water temperature (moving average 4–6 weeks prior to sampling; MA4–6) and (B) carapace length as a fixed effect, and year–location as a random effect. The same model was re-run as a simulation showing respective estimates for (C) temperature and (D) carapace length, with 25, 50, 75, and 100 lobsters sampled within each sampling event.
Interestingly, there was a non-significant temporal trend (capturing the order of the weeks throughout the study; P = 0.064), suggestive of a progressive increase in soft-shells over the decade. However, this marginal temporal effect was only present if temperatures were removed from the model, suggesting that a portion of the long-term temporal trend of increased soft-shell prevalence may be attributed to long-term increases in water temperatures, and water temperature was a better predictor than the temporal predictor, which was not included in the final model.
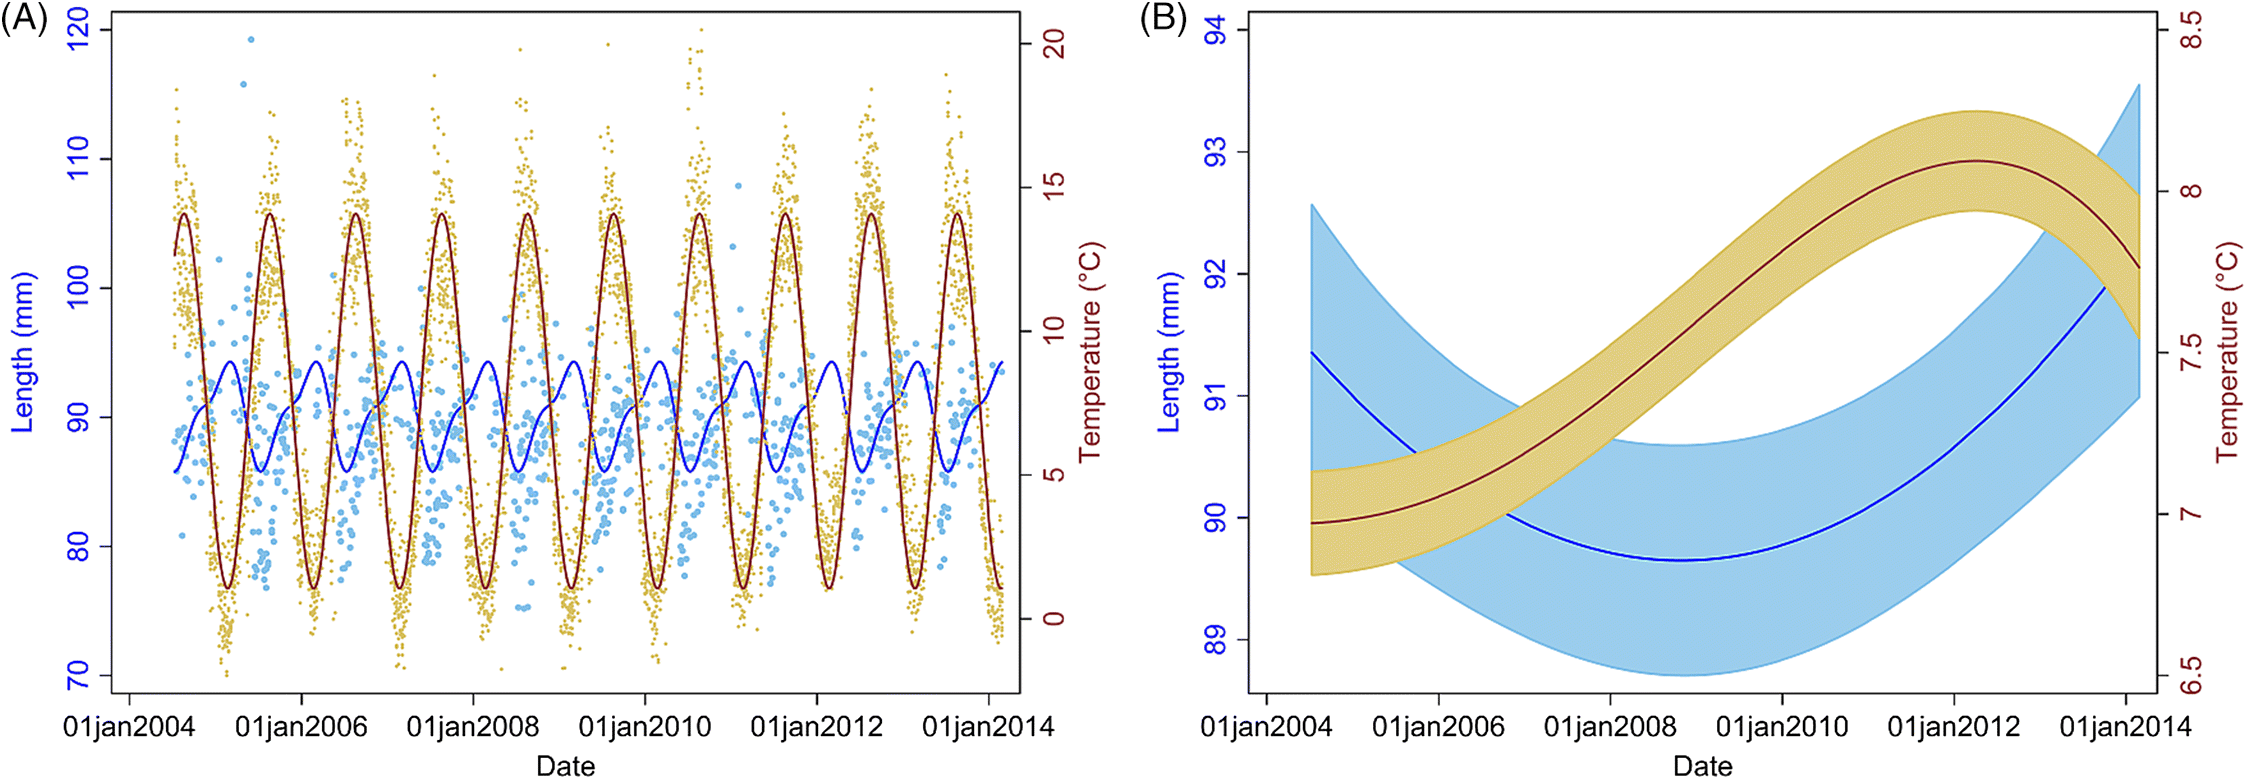
Separate linear mixed models (uninterrupted temporal model) were run for water temperature and lobster carapace length as outcomes, with Fourier terms (one sine and cosine term), to demonstrate their respective long-term temporal trends—these are graphically presented in Fig. 6. The analysis further indicated that water temperature as well as lobster carapace length significantly increased over time. The seasonal and long-term trends for water temperature and carapace length of lobsters in LFAs 33 and 34 are presented in Fig. 6.
Fig. 6.
Fig. 6. The (A) seasonal and (B) long-term trends with a 95% confidence band for water temperature and lobster carapace lengths in the east coast of Canada (LFAs 33 and 34) during the years 2004 to 2014.
Outputs from all three models (mixed logistic regression, model with short-term effect of temperature, and uninterrupted temporal model from 2004 to 2014) are included in Tables S1, S2, and S3, respectively.

Assessing the impact of moving fishing season

The overall probability of soft-shelled lobsters before and during the fishing season were 0.22 (95% CI: 0.19–0.25) and 0.09 (95% CI: 0.07–0.12), respectively. In contrast, the probability of soft-shelled lobsters three weeks before and three weeks after the fishing season, given the current start date, were 0.27 (95% CI: 0.23–0.31) and 0.14 (95% CI: 0.11–0.17), respectively (Table S4).
This analysis indicated that changing the fishing season arbitrarily by a few weeks, or even moving it to begin at the end of January of following year (week 4), would have little effect on the expected probabilities of soft-shelled lobsters before and after the start of fishing season.
However, as our analysis suggested strong inter-annual variability in the prevalence of soft-shelled lobsters (Fig. 3B) and average water temperature 4–6 weeks prior to sampling was significantly associated with soft-shelled lobsters (again, the effect varied across years; see Figs. 4C and S1). We also evaluated the effect of making the fishing season dynamic, depending upon water temperature profiles 4–6 weeks prior. For this analysis, we chose a cutoff temperature of 11 °C (mean temperature for MA4–6 for weeks 39–42), identified the week for each study year when the MA4–6 temperature went below that cutoff temperature, and selected that week as the start week for the fishing season. For six of the seven study years (thosewith sufficient data), the probability of soft-shelled lobsters was significantly less (Table 2) after the start of the fishing season than before it.
Table 2.
Table 2. The effect of starting the fishing season at the week when average water temperature 4–6 weeks prior reaches below 11 °C (mean temp for MA4–6) and corresponding changes in the probability of soft-shelled lobsters three weeks before and three weeks into the start of the fishing season for each of the study years, after adjusting for location random effect.
  Pre-fishing seasonFishing season
   95% CI 95% CI
YearStart weekProbabilityLower limitUpper limitProbabilityLower limitUpper limit
2004440.2630.1780.3650.1090.0580.175
2005420.1580.1050.2230.2140.1220.333
2006430.3620.2950.4380.1230.0700.183
2007430.3840.2320.5770.0370.0130.074
2008420.3140.2090.4380.1890.1620.220
200943***0.1870.1360.248
201043***0.1060.0330.217
2011440.1140.0730.164*
2012460.2090.1570.2680.1150.0890.145
201344******

Note: CI, confidence interval.

*
Insufficient data.
We chose a three week window because the difference was more marked at the beginning of the season (likely due to transition from warm to cold water temperature regime) than when comparing overall probabilities for the fishing season and pre-fishing season (Table S5). These two analyses suggest that moving the fishing season by a fixed number of weeks may not have much impact on the shell quality of landed lobsters. However, there might be potential for changing the start date for the fishing season dynamically, from year to year, depending on average water temperature profiles 4–6 weeks prior to reduce the proportion of landed soft-shelled lobsters during initial weeks of fishing.

Recommendations for future sampling strategies

Table 3 shows (lobster-related and water-temperature related) regression model results from the simulation with multiple sub-sampling schemes (ranging from 25 to 100 lobsters per sampling event) in comparison to the results obtained from the full study (“All”). These results indicate that sample sizes could be reduced to as few as 50–75 lobsters per sampling event and still produce significant and similar estimates, with only slightly less precision, compared to the full study with approximately 125 lobsters per sampling event.
Table 3.
Table 3. Simulation for sample size with series of sub-sampling schemes (fewer number of lobsters selected per sampling event) for the mixed-effect logistic regression and linear regression models with the short-term effect of water temperature. Only samples from LFA 33 and 34 are included.
Mixed-effect logistic regression
Lobsters collected per sampling eventModel, nCoefficient (SE): carapace length for femalesCoefficient (SE): carapace length for malesMonth and LFA/year interactionCoefficient (SE): ICCa
All119 7581.0369 (8.1 × 10⁻⁴)1.0417 (7.7 × 10⁻⁴)See Fig. 30.243 (0.011)
10081 4781.0349 (9.7 × 10⁻⁴)1.0396 (9.2 × 10⁻⁴)See Fig. 30.229 (0.011)
7562 9051.0342 (10.9 × 10⁻⁴)1.0390 (10.4 × 10⁻⁴)See Fig. 30.225 (0.012)
5043 5091.0346 (13.0 × 10⁻⁴)1.0374 (12.3 × 10⁻⁴)See Fig. 30.214 (0.012)
2523 2941.0294 (17.0 × 10⁻⁴)1.0343 (16.0 × 10⁻⁴)See Fig. 30.179 (0.013)
Linear regression models with short-term effect of water temperature
Lobsters collected per sampling eventModel, n bCoefficient (SE): moving average (4–6 weeks)Coefficient (SE): ICCc
All2290.0290 (5.1 × 10⁻³)0.254 (0.107)
1002290.0305 (5.3 × 10⁻³)0.248 (0.110)
752290.0311 (5.5 × 10⁻³)0.228 (0.113)
502290.0313 (5.8 × 10⁻³)0.131 (0.113)
252290.0358 (6.4 × 10⁻³)0.157 (0.101)

Note: SE, standard error; ICC, intra-class correlation coefficient.

a
Intra-class correlation coefficient for sampling event random effect.
b
Aggregated lobsters within NASA week.
c
Intra-class correlation coefficient for year-location random effect.

Discussion

The present study sought to provide preliminary insights into the spatio-temporal patterns of soft-shelled lobster prevalence in recent years on the east coast of Canada, and attempted to identify environmental and lobster-related factors that could explain such trends. The ALMQ database, one of the largest datasets of lobster catches in the world, provided useful data from 2004–2014 for the present study. The prevalence of soft-shelled lobsters varied annually (ranging from 9 to 38%) and among the LFAs. The analytical part of the present study focused on LFAs 33 and 34, as the majority of data originated from these LFAs and, combined they represent approximately 40% of the annual Canadian lobster production.
Hemolymph protein levels are not an entirely adequate predictor of shell hardness but can be useful as an indicator of shell quality, as in over 80% of cases they accurately identified shell hardness. However, caution should be exercised when interpreting these results, as several other factors may affect serum protein concentration, such as lobsters’ diets (McLeese 1972; Hagerman 1983) and live wet weight (Stewart et al. 1967). Taking these into consideration, one potential explanation for the inconsistency in predicting shell hardness based only on °Bx is that changes in protein levels during the molt cycles are more important for shell hardness than are their absolute values at any given point. As only a single value was recorded for each lobster, we were not able to assess individual changes in protein levels over time. A future longitudinal study with repeated measures of °Bx may help explain the relationship between hemolymph and shell hardness, and the role it may have on survivability of lobsters during storage and transportation.
The present study documents an increase in the prevalence of soft-shelled lobsters in SWNS. Our findings also suggest that larger lobsters are more likely to have soft shells, and that males are more likely to have soft shells than females. We do not have full biological explanations for these associations; however, it is known that sexually mature female lobsters molt less frequently than males (Cobb and Phillips 2012). Common knowledge dictates that larger lobsters do not molt as often as smaller lobsters, and therefore we would expect to have an overall higher prevalence of soft shells in small animals. That may be true when comparing very young with mature lobsters, but the present study included mostly market-sized lobsters (i.e., adults). In addition, the frequency and duration of molting also influence shell hardness, which we could not evaluate in the present study, as additional data for individual lobsters were not available. Lobster carapace length for the samples in the database varied between fishing and non-fishing seasons, due to a preference for the legal cut-off (82.5 mm) for landed lobsters’ size; during the fishing season, approximately 5% of sampled lobsters were of sub-legal size. This should be considered when interpreting the effect of size on shell hardness, as it may have created an upward bias in the estimate. The study also indicated a high level of variability among fishing locations and years on the prevalence of soft-shelled lobsters. However, inter-year variability was more pronounced, suggesting differences in climatic conditions across the years. Lagged SST was an important predictor for shell quality, and surprisingly, inter-year variability was not fully accounted for, even when water temperature was included as a predictor, suggesting a role for some unmeasured factor(s) on the differences in soft-shelled lobsters over the study years. Molting probability is highly temperature dependent, with increased water temperature being associated with a higher rate of molting (Templeman 1936; McLeese 1956; Schmalenbach and Buchholz 2013), and thus a higher probability that a captured lobster will have a soft shell. We used SST in the present study as a surrogate for water temperature, as studies comparing remote-sensed SSTs with in-situ records have suggested a high level of agreement between the two (Castillo and Lima 2010; Williams et al. 2013).
The average water-temperature 4–6 weeks prior to sampling was the best predictor for shell quality among the temperature metrics evaluated. In the results from the model with short-term temperature effect, we observed strong seasonal trends in the prevalence of soft-shelled lobsters that generally coincided with the fishing season for LFAs 33 and 34. Based on temperature profiles, the best time for lobster fishing would appear to be from January to early February. However, the data suggest that the prevalence of soft-shelled lobsters is low from the beginning of the year through May or June.
Our results suggest that lower temperatures are associated with fewer soft-shelled lobsters. The initial motivation to include SST in our analysis was to investigate changes in fishing season periods or to assess the potential for dynamic fishing “windows” based on previous years’ SST and its lagged effect. Because the inter- and intra-year variability of the prevalence of soft-shelled lobsters were high and SST could not explain much of this variability, changes or dynamic fishing seasons are not recommended. Nonetheless, there might be potential to change the start date of the fishing season dynamically, year to year, depending on the average water temperature profiles 4–6 weeks prior to the start date. However, increased sampling efforts close to the start of the fishing season and data on total landings are needed to improve the confidence of our current estimates and to evaluate potential confounding due to variations in landed catch. Additionally, we do not know if landed soft-shelled lobsters were proportionally representative of the population from which they were sampled, which was an assumption we had to make when interpreting our results. If, however, a selection bias did exist where soft-shelled lobsters were preferentially caught (i.e., higher observed proportions of soft-shelled lobsters than were present in the population), we would expect prevalence to be influenced by the intensity of the landed catch in an area and would likely have observed a higher prevalence of soft-shelled lobsters outside of the fishing season than were actually present in the population.
Similarly, the AR1 coefficient (ρ) of 0.628 indicated a relatively strong correlation in the soft-shelled lobster prevalence from week to week, which decreased exponentially as the time periods increased, with a negligible correlation among lobsters caught six weeks apart. These findings indicate that if start of the fishing season was moved to February and continued until June, then we might expect a reduction in soft-shelled lobsters. In contrast, moving the fishing season by a fixed number of weeks in December, without considering recent water temperature profile, would likely have little effect.
However, given the trend toward increasing temperatures long term and that our study shows an association of soft-shelled lobsters with an increase in SST, our model predictions indicate that this problem will likely persist and worsen in SWNS. Our findings also indicate that lobsters are getting larger over time (since 2006, size has been increasing), and anecdotal reports and published studies suggest that the abundance of lobsters is increasing in LFAs 33 and 34 (Howell 2012; Tremblay et al. 2013). These findings raise intriguing questions regarding the interplay among rising temperature, increasing lobster abundance and size, and increased prevalence of soft-shelled lobsters. Other unmeasured factors such as water depth, bottom temperature, and effect of spatial location for the samples are likely present and would help answer these questions. Future sampling strategies should consider sampling consistently in other LFAs and fishing locations, and sampling more frequently, both near the start of and during the initial weeks of the fishing season.
Atlantic lobsters in the coastal waters of southern New England, south of the LFAs in the present study, are under severe stress due to increasing water temperatures. This thermal stress has led to the development of an unusual syndrome in lobsters, known as epizootic shell disease (ESD), characterized by rapid degradation of the shell/cuticle. Stress from temperature, commercial exploitation, and ESD has resulted in massive declines in lobster stocks in southern New England waters (Glenn and Pugh 2006; Howell 2012; Laufer et al. 2013). The direct commercial effect of ESD is that infected lobsters do not command a premier price due to necrosis of the carapace and claws. However, a more important biological effect could be the potential decline in egg production, as ESD is more prevalent in ovigerous females. Female lobsters do not normally molt while bearing eggs (Shields and Sainte-Marie 2013), which could lead to death if lesions from ESD are severe, or they may molt prematurely, causing death of the larvae (Kunkel et al. 2012). In contrast to these declines in lobster stocks in southern New England waters, studies have suggested an increase in lobster stocks in northern US waters and in LFAs on the east coast of Canada (Howell 2012; Tremblay et al. 2013).
Water temperature is the most important environmental variable, as it affects the growth, reproduction, metabolic rate, and survival of lobsters (Cobb 1976; Aiken and Waddy 1986; Cobb and Phillips 2012). Studies indicate that ocean water temperatures are increasing globally (Harvell et al. 2002; Domingues et al. 2008; Maynard et al. 2015, 2016), and our study reflects this trend with evidence of increasing water temperatures in SWNS in recent years. Increasing water temperatures in SWNS and the Gulf of Maine may provide a favorable environment for ESD to expand from southern coastal waters into these areas (Maynard et al. 2016). Lobsters in these areas (LFAs 33 and 34) and the Bay of Fundy will likely be among the first to be affected in Canada. With ESD present in New England lobsters and the potential for emergence in lobsters in Canadian waters, the ongoing ALMQ project should be able to detect emergence of the disease and provide surveillance data for future studies.
More specific location data would have been required to add a range of environmental predictors to the study. Had detailed sampling locations for each observation been available, buffer zones could have been generated around each location to extract more precise environmental predictors (water depth and SST). Without individual sample locations in the database we were limited to using entire fishing locations to extract median values for our environmental predictors, greatly reducing the amount of information and variability in these predictors. The addition of higher resolution bathymetry (water depth) data would have enabled us to generate additional predictors, such as ocean floor slope, distance to the edge of the coastal shelf, and depth variability within buffer zones (surrounding sampled location points)—all potentially useful predictors. Similarly, using algorithms to predict bottom temperatures from the SST could add precision to the estimates (Maynard et al. 2016). It should also be noted that for the temporal models with water temperature, we aggregated observations at the fishing location levels, and thus the estimates from these models should not be interpreted as individual-level estimates.
For spatio-temporal modeling, continuous sampling over space and time is very important. The ALMQ database contains large amounts of data (>130 000 entries); however, the temporal gaps in some areas and the lack of sampling in others forced us to restrict the analyses to a small portion of the lobster industry. LFAs 33 and 34 make up approximately 40% of the annual lobster landings in Canada, while 93% of the database samples come from these two LFAs. To better understand spatio-temporal trends across the whole fishery, more frequent sampling across all fishing locations would be required. Naturally, sampling more locations more frequently is associated with higher costs and increased use of resources. However, a tradeoff can be achieved by decreasing the number of samples per sampling event. Currently, the number of lobsters sampled per event ranges from 2 to 398, with an interquartile range from 125 to 199 (mean = 151, median = 125). This number could effectively be halved (with an aim to catch approximately 50–75 lobsters/sampling event) with little effect on model estimates.
Studies have also suggested an association between water temperature and catch size (Fogarty 1988; Drinkwater et al. 1996). Forecast models have been developed using water temperature as a predictor to suggest the best time to start fishing in the state of Maine, USA (http://www.gmri.org/our-work/research/projects/gulf-maine-lobster-forecasting). Our findings suggest that similar forecast models for Atlantic Canada, with water temperature as a key predictor, may be helpful in forecasting the best time for fishing both in terms of catch size as well as to help lower the proportion of soft-shelled lobsters caught.
Conclusion

The prevalence of soft-shelled lobsters is increasing in SWNS in Canada. Associations between this trend and seasonal water temperatures, carapace length, and sex of lobsters were found to be important. The longer-term trend of increasing water temperatures in the North Atlantic together with the recent observed increases in both the abundance and size of lobsters in Canadian fishing areas make it difficult to identify a single risk factor associated with soft-shelled lobsters. To better understand the likely multifactorial effects at work and (or) the role of as yet unmeasured risk factors, we recommend the Atlantic Lobster Molt and Quality monitoring project be expanded to include sampling in other LFAs, and also that sampling be carried out more frequently toward the start and during the initial weeks of the fishing season. The findings of the present study also suggest that adjusting the fishing season start date by a few weeks, arbitrarily, in December, would have little effect on reducing the probability of soft-shelled lobsters. However, if the start of the fishing season were moved to February and continued until June, then we might reasonably expect a reduction in soft-shelled lobsters. Moreover, we found some evidence that allowing for a dynamic start to the fishing season, based on temperature cutoff values 4–6 weeks prior to the start date, could reduce the probability of soft-shelled lobsters during the initial weeks of fishing. In addition to an increased prevalence of soft-shelled lobsters, the increasing water temperature poses a potential threat for the emergence of ESD in the lobsters of SWNS, and warrants future research to evaluate the effects of long-term ecosystem change on shell-quality, shell-diseases, and sustainability of the lobster industry on the east coast of Canada.

Acknowledgements

We thank the Canada Excellence Research Chairs Program in Aquatic Epidemiology for funding support for this study, and William Chalmers for editorial assistance with the manuscript. We also thank the reviewers of this manuscript for their constructive comments.

References

Aiken D, and Waddy S. 1986. Environmental influence on recruitment of the American lobster Homarus americanus: a perspective. Canadian Journal of Fisheries and Aquatic Sciences, 43: 2258–2270.
ASHS. 2014. Atlantic Lobster Moult and Quality project: 2013. Aquatic Science and Health Services, Charlottetown, Prince Edward Island.
Barlow J, and Ridgway GJ. 1969. Changes in serum protein during the molt and reproductive cycles of the American lobster (Homarus americanus). Journal of the Fisheries Board of Canada, 26: 2101–2109.
Bremner HA. 2007. SEAFOODplus: international seafood research. In Sixth World Congress on Seafood Safety, Quality and Trade, Sydney, Australia, 14–16 September 2005. p. 175.
Castillo KD, and Lima FP. 2010. Comparison of in situ and satellite-derived (MODIS-Aqua/Terra) methods for assessing temperatures on coral reefs. Limnolology and Oceanography: Methods, 8: 107–117.
Cobb JS, and Phillips BF. 2012. The biology and management of lobsters: physiology and behavior. Elsevier, New York, New York.
Cobb SJ. 1976. The American lobster: the biology of Homarus americanus. University of Rhode Island Kingston, Kingston, Rhode Island, USA.
DFO. 2014. Facts on Canadian Fisheries: 2014. Department of Fisheries and Oceans Canada, Ottawa, Ontario.
Dohoo I, Martin W, and Stryhn H. 2009. Mixed models for discrete data. Veterinary Epidemiologic Research, 2: 584–585.
Domingues CM, Church JA, White NJ, Gleckler PJ, Wijffels SE, Barker PM, et al. 2008. Improved estimates of upper-ocean warming and multi-decadal sea-level rise. Nature, 453: 1090–1093.
Drinkwater K, Harding G, Mann K, and Tanner N. 1996. Temperature as a possible factor in the increased abundance of American lobster, Homarus americanust during the 1980s and early 1990s. Fisheries Oceanography, 5: 176–193.
Factor JR. 1995. Biology of the lobster: Homarus americanus. Academic Press, San Diego, California.
Fogarty MJ. 1988. Time series models of the Maine lobster fishery: the effect of temperature. Canadian Journal of Fisheries and Aquatic Sciences, 45: 1145–1153.
Glenn RP, and Pugh TL. 2006. Epizootic shell disease in American lobster (Homarus americanus) in Massachusetts coastal waters: interactions of temperature, maturity, and intermolt duration. Journal of Crustacean Biology, 26: 639–645.
Hagerman L. 1983. Haemocyanin concentration of juvenile lobsters (Homarus gammarus) in relation to moulting cycle and feeding conditions. Marine Biology, 77: 11–17.
Hammond KS, Hollows JW, Townsend CR, and Lokman PM. 2006. Effects of temperature and water calcium concentration on growth, survival and moulting of freshwater crayfish, Paranephrops zealandicus. Aquaculture, 251: 271–279.
Harvell CD, Mitchell CE, Ward JR, Altizer S, Dobson AP, Ostfeld RS, et al. 2002. Climate warming and disease risks for terrestrial and marine biota. Science, 296: 2158–2162.
Hijmans RJ, and van Etten J. 2012. Raster: geographic analysis and modeling with raster data. R package version, 19–92. R Core Team, Vienna, Austria.
Hosmer DW Jr, and Lemeshow S. 2004. Applied logistic regression. John Wiley & Sons.
Howell P. 2012. The status of the southern New England lobster stock. Journal of Shellfish Research, 31: 573–579.
Jaffry S, Pickering H, Ghulam Y, Whitmarsh D, and Wattage P. 2004. Consumer choices for quality and sustainability labelled seafood products in the UK. Food Policy, 29: 215–228.
Kunkel JG, Nagel W, and Jercinovic MJ. 2012. Mineral fine structure of the American lobster cuticle. Journal of Shellfish Research, 31: 515–526.
Laufer H, Chen M, Baclaski B, Bobbitt JM, Stuart JD, Zuo Y, et al. 2013. Multiple factors in marine environments affecting lobster survival, development, and growth, with emphasis on alkylphenols: a perspective. Canadian Journal of Fisheries and Aquatic Sciences, 70: 1588–1600.
Maynard J, Van Hooidonk R, Eakin CM, Puotinen M, Garren M, Williams G, et al. 2015. Projections of climate conditions that increase coral disease susceptibility and pathogen abundance and virulence. Nature Climate Change, 5: 688–694.
Maynard J, van Hooidonk R, Harvell CD, Eakin CM, Liu G, Willis BL, et al. 2016. Improving marine disease surveillance through sea temperature monitoring, outlooks and projections. Philosophical Transactions of the Royal Society of London B: Biological Sciences, 371: 1–11.
McLeese D. 1956. Effects of temperature, salinity and oxygen on the survival of the American lobster. Journal of the Fisheries Board of Canada, 13: 247–272.
McLeese D. 1972. Initial experiments on growth of the American Lobster in captivity. Fisheries Research Board of Canada, Biological Station, St. Andrews, New Brunswick.
Mercaldo-Allen R. 1991. Changes in the blood chemistry of the American lobster, Homarus americanus, H. Milne Edwards, 1837, over the molt cycle. Journal of Shellfish Research, 10: 147–156.
Mikami S. 2005. Moulting behaviour responses of Bay lobster, Thenus orientalis, to environmental manipulation. New Zealand Journal of Marine and Freshwater Research, 39: 287–292.
QGIS. A. 2015. Free and open source geographic information system (Open Source Geospatial Foundation Project) [online]: Available from http://www.qgis.org/en/site/.
R Core Team. 2015. R: a language and environment for statistical computing. R Foundation for Statistical Computing, Vienna, Austria [online]: Available from http://www.R-project.org/.
Rosa R, and Nunes ML. 2004. Nutritional quality of red shrimp, Aristeus antennatus (Risso), pink shrimp, Parapenaeus longirostris (Lucas), and Norway lobster, Nephrops norvegicus (Linnaeus). Journal of the Science of Food and Agriculture, 84: 89–94.
Schmalenbach I, and Buchholz F. 2013. Effects of temperature on the moulting and locomotory activity of hatchery-reared juvenile lobsters (Homarus gammarus) at Helgoland (North Sea). Marine Biology Research, 9: 19–26.
Shields JD, and Sainte-Marie B. 2013. Complex etiologies of emerging diseases in lobsters (Homarus americanus) from Long Island Sound. Canadian Journal of Fisheries and Aquatic Sciences, 70: 1576–1587.
Stewart JE, Cornick JW, Foley DM, Li M, and Bishop C. 1967. Muscle weight relationship to serum proteins, hemocytes, and hepatopancreas in the lobster, Homarus americanus. Journal of the Fisheries Board of Canada, 24: 2339–2354.
Templeman W. 1936. The influence of temperature, salinity, light and food conditions on the survival and growth of the larvae of the lobster (Homarus americanus). Journal of the Biological Board of Canada, 2: 485–497.
Tremblay M, Pezzack D, Gaudette J, Denton C, Cassista-Da Ros M, and Allard J. 2013. Assessment of lobster (Homarus americanus) off southwest Nova Scotia and in the Bay of Fundy (Lobster Fishing Areas 34–38). DFO Canadian Science Advisory Secretariat Scientific Research Document 2013/78. 121 p. [online]: Available from http://www.dfo-mpo.gc.ca/Library/350286.pdf.
Waddy S, and Aiken D. 1992. Seasonal variation in spawning by preovigerous American lobster (Homarus americanus) in response to temperature and photoperiod manipulation. Canadian Journal of Fisheries and Aquatic Sciences, 49: 1114–1117.
Wang G, and Mcgaw IJ. 2014. Use of serum protein concentration as an indicator of quality and physiological condition in the lobster Homarus americanus (Milne-Edwards, 1837). Journal of Shellfish Research, 33: 805–813.
Williams GN, Dogliotti A, Zaidman P, Solis M, Narvarte M, Gonzalez R, et al. 2013. Assessment of remotely-sensed sea-surface temperature and chlorophyll-a concentration in San Matías Gulf (Patagonia, Argentina). Continental Shelf Research, 52: 159–171.

Supplementary material

Supplementary Material 1 (DOCX / 38.6 KB):

Information & Authors

Information

Published In

cover image FACETS
FACETS
Volume 2Number 1January 2017
Pages: 15 - 33
Editor: Jeffrey Hutchings

History

Received: 28 July 2016
Accepted: 11 October 2016
Version of record online: 18 January 2017

Data Availability Statement

All relevant data are within the paper, the Supplementary Material, www.lobstermoult.ca/ (for lobster data), and http://oceancolor.gsfc.nasa.gov (for sea surface temperature data).

Key Words

  1. Atlantic lobster
  2. soft shells
  3. risk factors
  4. spatio-temporal
  5. remote sensing
  6. sea surface temperature

Sections

Subjects

Authors

Affiliations

Krishna K. Thakur [email protected]
Department of Health Management, Atlantic Veterinary College, University of Prince Edward Island, Charlottetown, C1A 4P3 PE, Canada
Crawford Revie
Department of Health Management, Atlantic Veterinary College, University of Prince Edward Island, Charlottetown, C1A 4P3 PE, Canada
Henrik Stryhn
Department of Health Management, Atlantic Veterinary College, University of Prince Edward Island, Charlottetown, C1A 4P3 PE, Canada
Shannon Scott Tibbetts
Fishermen and Scientists Research Society, Halifax, B3M 4H4 NS, Canada
Jean Lavallée
Aquatic Science & Health Services, Charlottetown, C1A 9H6 PE, Canada
Raphaël Vanderstichel
Department of Health Management, Atlantic Veterinary College, University of Prince Edward Island, Charlottetown, C1A 4P3 PE, Canada

Author Contributions

KKT, CR, HS, and RV conceived and designed the study.
SST and JL performed the experiments/collected the data.
KKT, CR, HS, and RV analyzed and interpreted the data.
SST and JL contributed resources.
All drafted or revised the manuscript.

Competing Interests

The authors have declared that no competing interests exist.

Metrics & Citations

Metrics

Other Metrics

Citations

Cite As

Export Citations

If you have the appropriate software installed, you can download article citation data to the citation manager of your choice. Simply select your manager software from the list below and click Download.

Cited by

1. Lobster quality indicators for grading
2. Effect of acclimation temperature on thermal tolerance between American lobster (Homarus americanus) collected in different lobster fishing areas in Atlantic Canada
3. Observed size distribution changes in American lobsters over a 12-year period in southwestern Nova Scotia, Canada
4. Validation of the water content of the digestive gland as an indicator of nutritional condition in the American lobster Homarus americanus (H. Milne Edwards, 1837) (Decapoda: Nephropidae)
5. Fisheries dataset on moulting patterns and shell quality of American lobsters H. americanus in Atlantic Canada
6. Spatial and temporal patterns in the sex ratio of American lobsters (Homarus americanus) in southwestern Nova Scotia, Canada
7. Novel carbohydrate blend enhances chemical and sensory properties of lobster (Homarus americanus) after one-year frozen storage
8. It’s about time: A synthesis of changing phenology in the Gulf of Maine ecosystem
9. Spatiotemporal variability in the phenology of the initial intra‐annual molt of American lobster ( Homarus americanus Milne Edwards, 1837) and its relationship with bottom temperatures in a changing Gulf of Maine
10. Rising Temperatures, Molting Phenology, and Epizootic Shell Disease in the American Lobster

View Options

View options

PDF

View PDF

Media

Media

Other

Tables

Share Options

Share

Share the article link

Share on social media