Open access

Selection towards larger body size in both herbivorous and carnivorous synapsids during the Carboniferous

Publication: FACETS
2 February 2017

Abstract

Body size is one of the most important characteristics of an organism, impacting a great variety of ecological characteristics. The influence of diet on body size has received considerable attention, with previous studies suggesting a greater tendency towards increased body size in herbivores than macro-carnivores. The earliest known herbivorous and macro-carnivorous synapsids provide an ideal case study for examining body size evolution in different dietary regimes. Sphenacomorpha contains two lineages: Edaphosauridae (some of the most abundant terrestrial herbivores in the late Carboniferous and early Permian), and Sphenacodontia (the largest and most abundant carnivores of that time). Phylogenetic comparative analyses are used to compare trait evolution in sphenacomorphs, including a Bayesian method for identifying branches along which phenotypic selection occurred. Two branches show rapid increases in body size in the late Carboniferous. The first occurred in Edaphosauridae, along the branch leading to the herbivorous members. The later shift towards larger size occurred in Sphenacodontia, producing a clade of large carnivores. It is possible that the rapid appearance of large herbivorous synapsids in the Carboniferous provided the selective pressure for carnivores to increase their size. Following these two shifts, rates of evolution in edaphosaurids slowed significantly, but the carnivorous sphenacodontians showed further increases.

Introduction

The link between body size and diet evolution has a long history of study, with discussion based on a wide variety of biological disciplines. A number of putative links between the two have been discussed, including energy requirements (Geist 1974; Gaulin 1979; Fleming 1991; Isbell 1998; Müller et al. 2013; Olsen 2015), food abundance and prey size (Sinclair et al. 2003; Price and Hopkins 2015), defence from predation (Sinclair et al. 2003), and digestive requirements (Demment 1982; Demment and Van Soest 1985; Farlow 1987; Ilius and Gordon 1992; Sues and Reisz 1998; Reisz and Sues 2000; Müller et al. 2013). One of the most frequently discussed relationships between diet and body size is the correlation between herbivory and large body size (e.g., Pough 1973; Morton 1978; Gaulin 1979; Schluter 1984; Fleming 1991; Dudley and Vermeij 1992; Isbell 1998; Klasing 1998; Smith et al. 2010; Zanno and Mackovicky 2012; Reisz and Fröbisch 2014; Olsen 2015; Price and Hopkins 2015; Brocklehurst 2016).
Terrestrial vertebrate herbivores first appeared in the fossil record in the late Carboniferous and diversified during the early Permian (Sues and Reisz 1998; Reisz and Sues 2000; Pearson et al. 2013; Reisz and Fröbisch 2014; Brocklehurst et al. 2015). The adaptations for herbivory appeared independently in five clades at this time (Sues and Reisz 1998): Diadectidae (non-amniote tetrapods), Captorhinidae and Bolosauridae (sauropsid amniotes), and Edaphosauridae and Caseidae (synapsid amniotes). It has been hypothesized that the onset of herbivory was related to an increase in body size in some, but not all, of these lineages (Reisz and Fröbisch 2014; Brocklehurst 2016). During the early Permian, Edaphosauridae were the most diverse and abundant herbivores, whereas their sister clade Sphenacodontia includes the largest and most abundant macro-carnivores of the early Permian (Romer and Price 1940; Brocklehurst et al. 2013). Edaphosauridae and Sphenacodontia are recovered as sister groups in the most recent, inclusive analyses of non-mammalian synapsids (Benson 2012; Brocklehurst et al. 2016) and together form the clade Sphenacomorpha (Ivakhnenko 2003).
Sphenacomorpha is the only group of medium-to-large bodied non-mammalian synapsids to have developed elongate neural spines forming a dorsal sail, the function of which has been subject to intense scrutiny (Romer 1927; Rodbard 1949; Pivorunas 1970; Bramwell and Felqett 1973; Haack 1986; Tracy et al. 1986; Bennett 1996; Florides et al. 2001; Huttenlocker et al. 2010, 2011; Tomkins et al. 2010; Rega et al. 2012). It has been suggested that sphenacomorphs were the largest terrestrial vertebrates of the Permo-Carboniferous because of their dorsal sails, as the sail would act to strengthen the vertebral column at large body masses and increase the efficiency of thermoregulation (Romer 1927; Pivorunas 1970; Florides et al. 2001). Recent studies have questioned the use of the dorsal sail as a thermoregulatory organ based on histological analyses of the neural spines (Huttenlocker et al. 2010, 2011), the suggestion that Dimetrodon was nocturnal (Angielczyk and Schmitz 2014), and the positive allometry of neural spine height through evolutionary time as evidence that the sail was used for sexual selection (Bakker 1986; Tomkins et al. 2010). However, the idea of whether or not dorsal sails are related to body size in sphenacomorphs has never been quantitatively tested.
Sphenacomorpha is an ideal case study group for comparing body size evolution in carnivores and herbivores. The two lineages within this clade both appear in the fossil record in the same locality, the Garnett Quarry of Kansas (Currie 1977; Reisz and Berman 1986), and the fossils of both lineages are found alongside each other throughout the Carboniferous and Permian (Romer and Price 1940; Brocklehurst et al. 2013)—sometimes thought to be living in a predator-prey relationship (Romer and Price 1940). Edaphosauridae died out in the Kungurian/Roadian extinction event known as Olson’s Extinction (Sahney and Benton 2008; Brocklehurst et al. 2013). One lineage of Sphenacodontia did survive this extinction event (Therapsida), but no information on this lineage is available from the early Permian; the family Sphenacodontidae, which represents the majority of sphenacodontians during the early Permian, died out during Olson’s Extinction alongside edaphosaurids (Sahney and Benton 2008; Brocklehurst et al. 2013). Thus, the Sphenacomorpha allows one to compare and contrast the evolution of two closely related lineages: one producing large high-fibre herbivores, and the other producing large macro-carnivores. Moreover, both lineages have recently been subjected to comprehensive phylogenetic analyses (Mazierski and Reisz 2010; Brink et al. 2015), providing a framework for analyses of their evolution.
We used a number of quantitative methods to examine body size evolution in Sphenacomorpha and, in particular, to compare this evolution within the two sub-clades to test whether increases in body size are related to herbivory. A recently proposed Bayesian method was used to analyse whether positive phenotypic selection can be identified along any lineage within these clades, whereas likelihood methods were used to identify shifts in the rate of body mass evolution. A time series of body masses within Sphenacomorpha was created, and model-fitting analysis was used to identify trends and punctuations in these data.

Materials and methods

Body mass estimates

Body mass was estimated using a method suggested by Romer and Price (1940). The cross-sectional area of the dorsal vertebrae (estimated from the radius of the dorsal vertebral centrum squared) was used as a proxy for mass. Mass estimates of Sphenacomorpha were taken from the original compendium, and were calculated for those taxa not included in these publications but that possessed dorsal vertebrae. Body masses were log-transformed prior to analysis. The data are presented in Supplementary Material 1.
It should be noted that a more recent method of estimating body mass is available: using the shaft circumference of the femur and the humerus (Campione and Evans 2012). However, the use of this method would result in a smaller sample size, as there are fewer sphenacomorph specimens with both a femur and humerus preserved than with dorsal vertebrae preserved, and the largest specimens of several taxa do not preserve these bones.

Phylogeny

The phylogeny used in this study is a composite tree formed from the phylogenies of Mazierski and Reisz (2010) and an expanded version of Brink et al. (2015). The former is the most comprehensive phylogenetic analysis of Edaphosauridae, and the latter is the most comprehensive phylogenetic analysis of Sphenacodontidae. To expand the analysis of Brink et al. (2015), the taxa Ctenorhachis jacksoni and Cryptovenator hirschbergeri were added, along with non-sphenacodontid outgroups (Varanops, Ophiacodon, and Edaphosaurus). The matrix used in this analysis is presented in Supplementary Material 2. In the edaphosaurid phylogeny, a polytomy is present due to the lack of overlap between Glaucosaurus and Lupeosaurus. This polytomy was resolved according to the Bayesian analysis of Brocklehurst et al. (2016), where Lupeosaurus was found to be more closely related to Edaphosaurus than Glaucosaurus. The two resulting phylogenies were combined in such a way that Sphenacodontia was the sister to Edaphosauridae, and non-sphenacomorph outgroups were deleted. The resulting tree is shown in Fig. 1.
Fig. 1.
Fig. 1. One of the 100 time-calibrated phylogenies used in this study (the relationships in all 100 are identical; the relative ages of the nodes and tips differ). The therapsid lineage and taxa for which a body mass could not be calculated are not included in subsequent analyses. Node labels: (A) Edaphosauridae, (B) Sphenacodontia, and (C) Sphenacodontidae.
The phylogeny was time-calibrated using the method of Brusatte et al. (2008) in the R 3.14 package (R Core Team 2014) paleotree (Bapst 2012). Under this method, zero-length branches resulting from inconsistencies between the order of branching observed in the phylogeny and the order of appearances of the taxa in the fossil record were treated by sharing the length of the branch immediately ancestral to them equally between ancestor and descendants. Uncertainty surrounding the ages of taxa was accounted for using the method of Pol and Norrel (2006). For each taxon, 100 first appearances and last appearances were drawn at random from a uniform probability distribution covering the full possible range of ages for that taxon. One hundred time-calibrated trees were produced from the 100 sets of ages, and all phylogenetic comparative analyses were performed on all 100 of these trees. The age ranges used are presented in Supplementary Material 1.
Taxa for which body mass estimates could not be calculated due to the lack of dorsal vertebrae were retained in the phylogeny during time calibration, as they provide important information on branch lengths and the ages of nodes; however, they were dropped after time calibration. These include Cryptovenator, Dimetrodon borealis, Tetraceratops, and Glaucosaurus. The therapsid lineage was also pruned, as no information is available on the body size evolution of this clade during the Carboniferous and the early Permian. The 100 trees subjected to analysis after pruning are presented in Supplementary Material 3.
Another possible source of uncertainty is the existence of taxa not included in the phylogeny. The analysis of Mazierski and Reisz (2010) included all valid edaphosaurid taxa with the exception of Edaphosaurus mirabilis. However, because this taxon is currently the smallest known member of the genus Edaphosaurus, its absence could potentially have a large impact on the results. The analysis of Brink et al. (2015), though comprehensive in terms of genera, only included four out of the 11 species of Dimetrodon considered valid in the most recent summary of early synapsids (Brocklehurst et al. 2013). There are also species of Haptodus and Sphenacodon not included. To test the impact of these exclusions, another set of 100 time-calibrated trees were produced, in which all missing species for which body masses could be estimated were added at random to the tree, within the genera to which they had been assigned. These 100 trees are presented in Supplementary Material 4. The analyses of phenotypic selection (see below) were performed again on these 100 trees.

Testing for phenotypic selection

Morphological evolution is not homogeneous. Different selective pressures acting on different lineages will lead to deviations from a “Brownian motion” (random walk) model of evolution. Recently, Baker et al. (2015) proposed a method of identifying lineages along which “positive phenotypic selection” occurred. The concept of positive selection was defined as change beyond what would be expected under Brownian motion. The difference between the morphological change occurring along a lineage and the change that might be expected was calculated using the variable rates model of Venditti et al. (2011). This model has Brownian motion as its basis, but scales branch lengths within the phylogeny to represent deviations from this model. A Markov Chain Monte Carlo reversible-jump framework was used to generate posterior distributions of scalars for each branch and to deduce what pattern of rate variation best fits the morphological data observed. Baker et al. (2015) proposed (somewhat arbitrarily) that positive phenotypic selection could be deemed to have occurred along a branch if the amount of morphological change occurring along that branch was more than double that which would be expected under Brownian motion.
All the time-calibrated trees described above were analysed using the method proposed by Baker et al. (2015). The analyses were performed in BayesTraits V2.0. Markov chains were run for 10 000 000 iterations, with 100 000 discarded as burn-in.
To ascertain the direction in which the morphology was being selected, ancestral body masses were calculated using likelihood with the ace function in the package ape in R (Paradis et al. 2004). This function assumes a Brownian motion model of evolution, but here the branch lengths of the phylogeny were rescaled as described above to represent the variation in rate.

Analysis of rate shifts

A likelihood approach was used to identify points in the sphenacomorph phylogeny where heritable shifts in the rate of body size evolution occurred. The 100 time-calibrated phylogenies were analysed using the trait medusa algorithm (TM1) in the R package models of trait macroevolution on trees (MOTMOT) (Thomas and Freckleton 2012). This algorithm uses a stepwise Akaike information criterion (AIC) approach to identify the combination of rate shifts that best fit the observed data. First, the likelihood of a single-rate Brownian motion model was calculated. Then, a two-rate model was evaluated, with the likelihood of a rate shift at each node calculated in turn. Models with more than two rate shifts were evaluated with the location of one of the shifts constrained at the node identified in the previous step. This process continued until a user-specified number of shifts had been identified (in this case five). AIC and Akaike weights were used to assess which pattern of rate shifts best fits the body mass data and phylogeny.

Time series analysis

While phylogenetic comparative methods allow one to incorporate the relationships of taxa in analyses of evolution, they do have some limitations. First, one is limited by the taxa that have been included in the phylogeny. Also, at present, the model-fitting analyses do not allow one to incorporate information on changes in body size within a single tip taxon. To examine whether incorporating such factors might not alter the results, body mass data were analysed as a time series rather than within a phylogeny. This allowed one to use all species for which a body mass could be calculated. It also allowed the inclusion of different specimens of the same taxon; the largest specimen of each taxon in each time bin was used, thus allowing the same taxon to have different body masses at different points in time. The specimens included in this dataset, their ages, and estimated masses are presented in Supplementary Material 5. In each time bin, the sample size, trait median, and standard error were calculated. Four evolutionary models were fit to the time series. The first, an unbiased random walk (URW) model, represents evolution by Brownian motion; one expects random trait variation around a constant mean, with the trait variance increasing through time (Hunt 2006). The generalised random walk (GRW) model also represents a Brownian motion process, but the trait mean shows a trend in a particular direction. The stasis model represents the trait being held to an adaptive optimum through time by a “rubber band” parameter; the further the trait deviates from the optimum, the more strongly it is drawn to it (Hunt 2006). Thus, the trait mean will remain constant, as will the variance. Finally, a model of punctuated evolution was tested: a stasis model with a shift in the adaptive optimum between two time bins. Model-fitting was performed in the R package paleoTS (Hunt et al. 2008), and models were selected based on the Akaike weights.

Results

Phenotypic selection

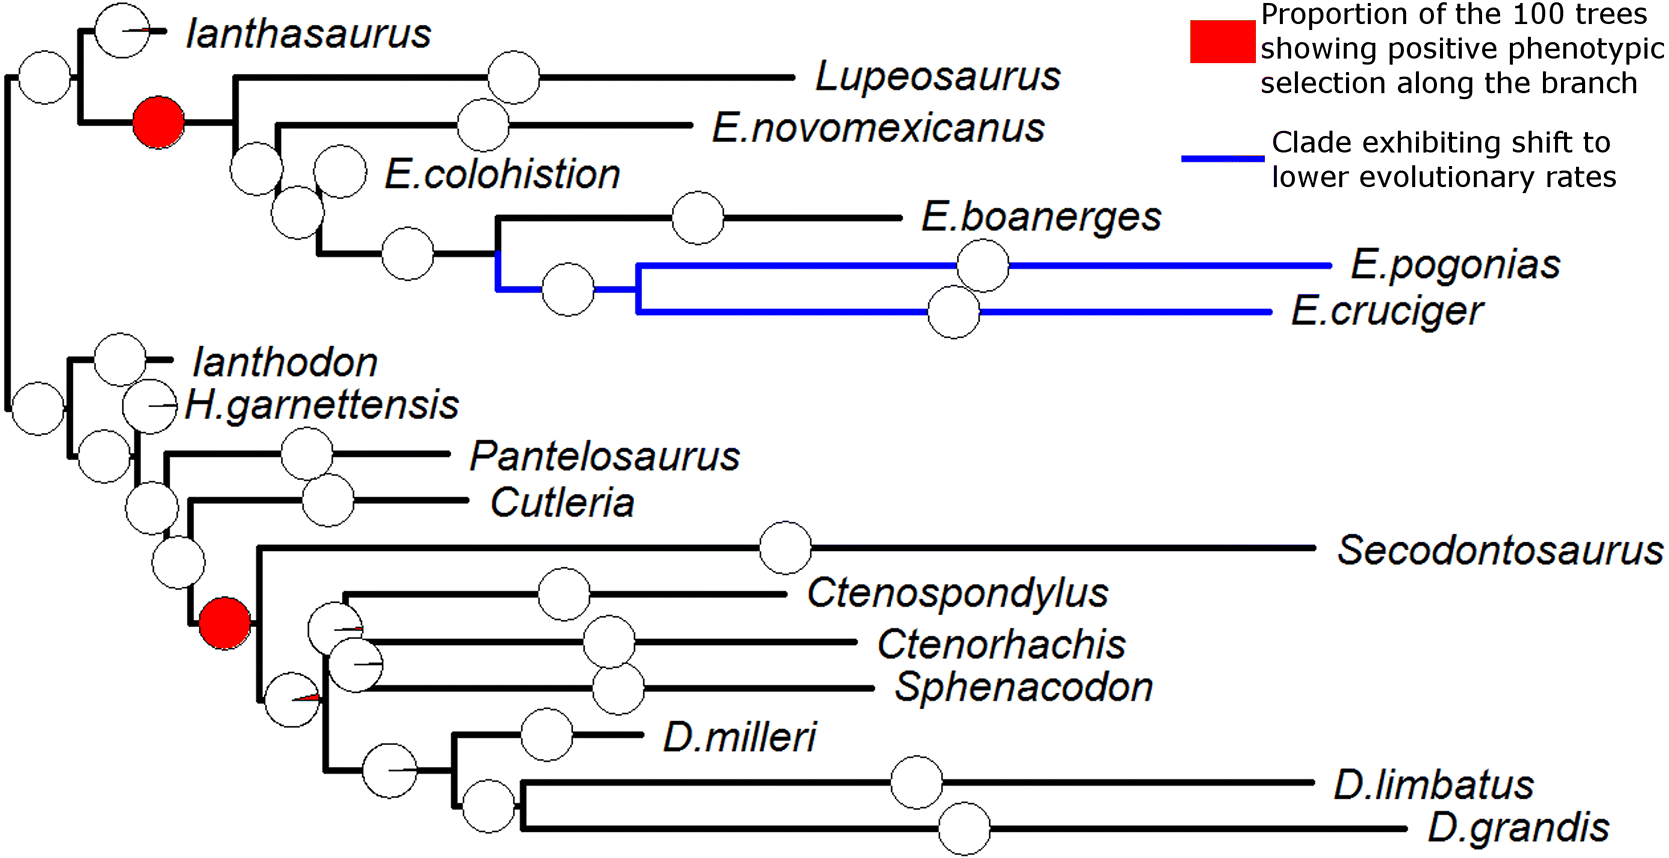
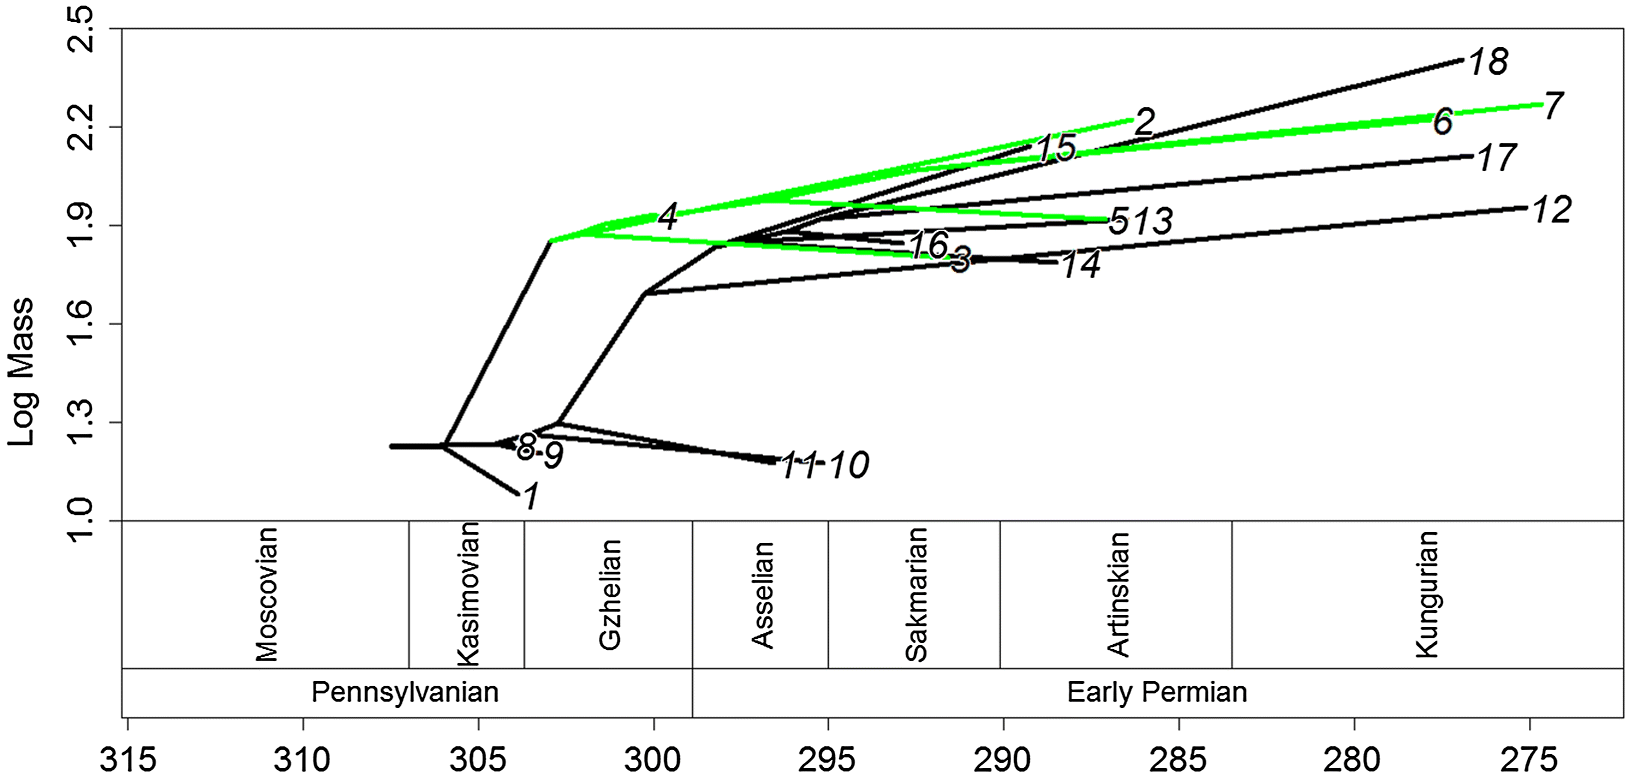
Two lineages exhibited positive phenotypic selection in all 100 of the time-calibrated phylogenies (Fig. 2). The first of these lineages was within Edaphosauridae: the lineage leading to the clade containing Lupeosaurus and Edaphosaurus. The second was the lineage leading to Sphenacodontidae. When one examines the inferred ancestral body masses (Fig. 3), it can be observed that both of these lineages demonstrate a rapid increase in body size. All other lineages were found to experience phenotypic selection in either none or an extreme minority of the 100 trees.
Fig. 2.
Fig. 2. The results of the phylogenetic comparative analyses illustrated over one of the 100 time-calibrate phylogenies. The pie charts over the branches represent the proportion of the 100 phylogenies in which positive phenotypic selection is identified along that branch. The clade in blue is the clade in which the TM1 algortithm identified a rate decrease in the majority of the 100 phylogenies.
Fig. 3.
Fig. 3. One of the 100 time-calibrated phylogenies, illustrating both the age and inferred body size of each node. Ancestral body sizes were reconstructed using likelihood, assuming evolution by Brownian motion but scaling the branches to represent rate variation. Herbivorous lineages are coloured green (the clade containing Lupeosaurus and Edaphosaurus). Taxon labels: (1) Ianthasaurus, (2) Lupeosaurus, (3) E. novomexicanus, (4) E. colohistion, (5) E. boanerges, (6) E. cruciger, (7) E. pogonias, (8) Ianthodon, (9) H. garnettensis, (10) Pantelosaurus, (11) Cutleria, (12) Secodontosaurus, (13) Sphenacodon, (14) Ctenorhachis, (15) Ctenospondylus, (16) D. milleri, (17) D. limbatus, and (18) D. grandis.
The addition of taxa not yet tested in phylogenetic analysis to the tree did not change the inference of positive phenotypic selection within Edaphosauridae; the same lineage was found to have experienced significant selection in all trees. Edaphosaurus mirabilis, one of the taxa added to random locations within Edaphosaurus and the smallest included member of this genus, was also found to have experienced significant phenotypic selection in most of these trees. However, the inference of positive selection towards larger body size in the lineage leading to Sphenacodontidae was less certain when the new taxa were added; significant selection along this lineage was found in only 42 of the 100 phylogenies.

Rate shifts

In 91 of the 100 phylogenies, the TM1 analysis identified a single rate shift as best fitting in the observed data. This shift is located at the node ancestral to the two youngest and largest species of the genus Edaphosaurus: E. cruciger and E. pogonias (Fig. 2). The shift is towards lower rates of body size evolution in this clade. The results of the 100 TM1 analyses are presented in Supplementary Material 6.

Time series analysis

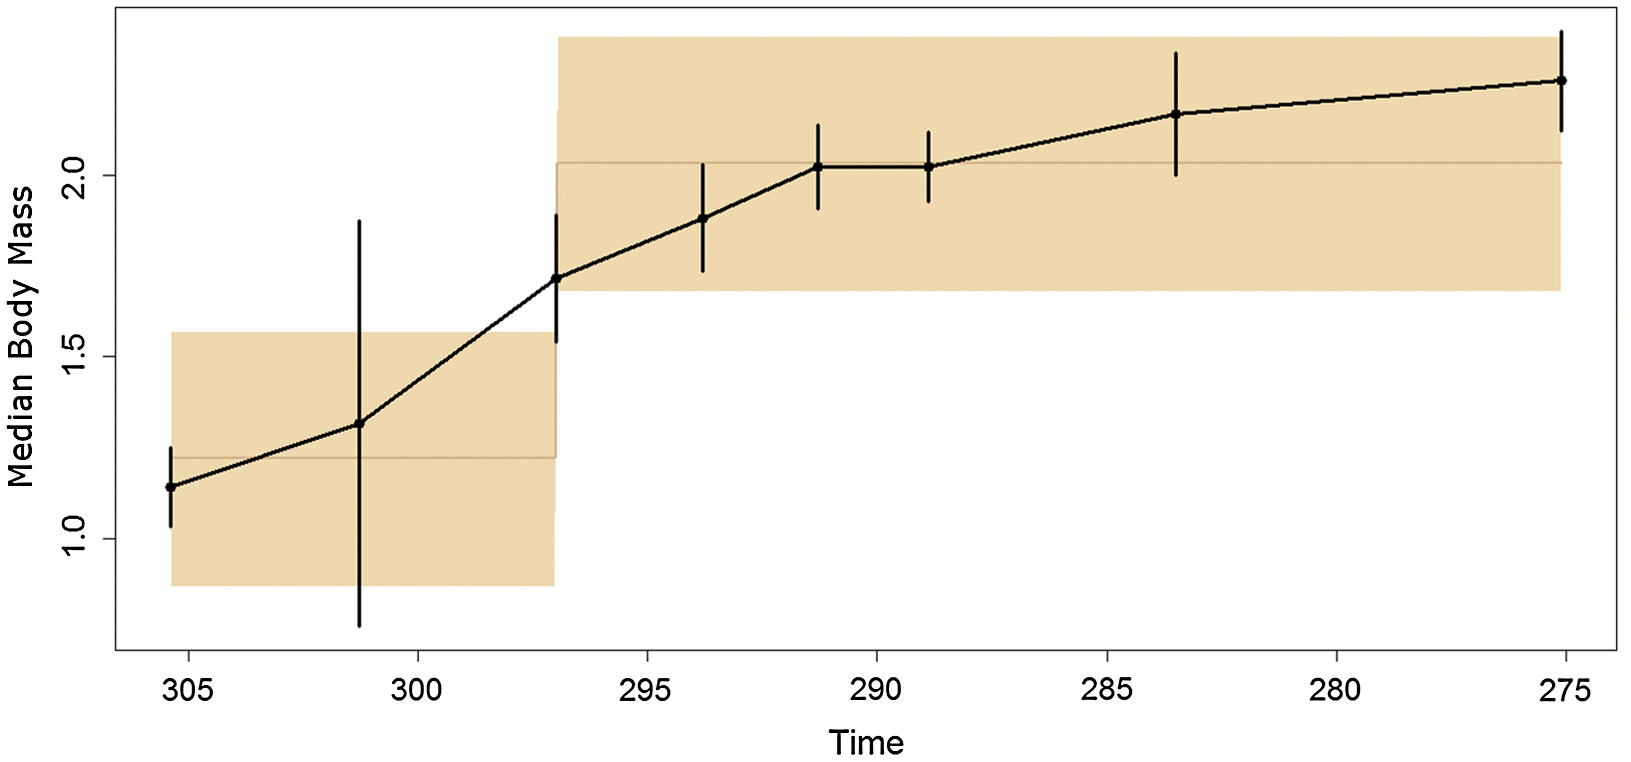
According to the Akaike weights, the time series of body masses best fits the punctuated model (Table 1), with an increase in trait optimum occurring at the end of the Gzhelian (Fig. 4). The support for this model was not overwhelming, however, and the URW model received an almost identical Akaike weight. The lack of overwhelming support for any particular model is likely due to the short time series.
Fig. 4.
Fig. 4. Time series illustrating changes in body size of Sphenacomorpha through time. The points represent the median body mass for each time bin, and the bars represent squared standard errors. The brown line and shaded region represent the trait optima in the best-fitting evolutionary model (punctuated increase in body size in the latest Carboniferous).
Table 1.
Table 1. Parameters of models fit to the time series.
ModelLogLAICAkaike weightTheta 1Theta 2Shift locationMstep
URW1.70−1.390.33NANANANA
GRW2.39−0.780.24NANANA0.0215
Stasis1.451.100.092.02NANANA
Punctuated3.73−1.450.341.222.053NA

Note: URW, unbiased random walk; GRW, generalised random walk; LogL, log likelihood; AIC, Akaike information criterion; Theta 1, adaptive optimum before shift; Theta 2, adaptive optimum after shift; Mstep, step-change in mean.

Discussion

A Carboniferous increase in sphenacomorph body size

An increase in body size in Permo-Carboniferous non-mammalian synapsids has been qualitatively noted since specimens were first placed in a stratigraphic context (Romer and Price 1940; Olson 1962; Gould 1967; Pivorunas 1970; Gould and Littlejohn 1973; Bakker 1986; Tracy et al. 1986; Berman et al. 2001; Tomkins et al. 2010; Reisz and Fröbisch 2014; Brink et al. 2014, 2015). Reisz and Fröbisch (2014) proposed that a trend towards increased body size can be observed in all herbivorous lineages, and also posited a body size increase in the Sphenacodontidae; although they suggested that this increase was less than that observed in herbivores. The results of this study support the hypothesis of Reisz and Fröbisch (2014); a body size increase was observed in edaphosaurids and sphenacodontids. However, this increase was not a gradual trend occurring throughout the Carboniferous and early Permian. Only two sphenacomorph lineages consistently showed phenotypic selection towards larger body size regardless of the uncertainty surrounding the ages of taxa. All other lineages exhibited changes in body mass not significantly different from what would be expected from Brownian motion.
Both of these short, rapid increases in body size occurred during the latest Carboniferous, during the Kazimovian and Gzhelian stage. This observation is supported by the time series of body masses, which showed an increase in mass at this time, followed by a period of relative stability (Fig. 3). The fitting of evolutionary models to the time series suggests that the punctuated model, with stasis during the Carboniferous and early Permian and a shift to a larger body size in between, best fits the data (although one should again emphasise the weakness of the support for this model). The timing of the shift in body mass is interesting, as it contradicts a suggestion made previously on body mass evolution in pelycosaurian-grade synapsids. In an analysis of changes in species richness of early synapsids (Brocklehurst et al. 2013), it was tentatively suggested that a rapid trend towards warming and drying during the early Permian at the end of the Sakmarian (Montanez et al. 2007), which reduced the extent of the equatorial forests, may have promoted the evolution of larger body sizes; a more open environment would allow larger inhabitants (Brocklehurst et al. 2013). The results here show that this is unlikely to have been the case; although many of the largest pelycosaurian-grade synapsids do not appear in the fossil record until after this event, the initial evolution of large body size appears to have occurred much earlier, during the late Carboniferous. The transition to a more open habitat may have allowed larger taxa to become more abundant, and thus more likely to be preserved (Brocklehurst and Fröbisch 2014), but it did not precipitate the increase in body size.
The evolution of the dorsal sail showed differing patterns in edaphosaurids and sphenacodontids. The dorsal sail evolved independently in each clade, and evolved more than once in sphenacodontids (once in Secodontosaurus and once at the base of the Dimetrodon clade). Sphenacodontids increased in body size before the first occurrence of the dorsal sail in Secodontosaurus, and species within Sphenacodontidae that do not have extremely elongate neural spines (Sphenacodon Ctenorhachis and Ctenospondylus) still evolved large body sizes, comparable to contemporaneous species of Dimetrodon. This pattern suggests no correlation between the evolution of large body sizes and the development of a dorsal sail in sphenacodontids. However, edaphosaurids increased in body size after the first occurrence of the dorsal sail in Ianthasaurus, and so it is possible that the two traits are related. Given the differences in patterns between body size and dorsal sail evolution, the differences in neural spine shape and ornamentation, and that thermoregulatory hypotheses for the dorsal sail have been questioned, these results lend support to the hypothesis that elongate neural spines are a secondary sexual character in Sphenacomorpha (Tomkins et al. 2010). The dorsal sail, along with increased body mass, became more prominent after the decline of rainforests at the end of the Carboniferous (Sahney et al. 2010), where a dorsal sail would have been less cumbersome.

Phenotypic selection in Edaphosauridae

Selection towards larger body size in edaphosaurids appears to coincide with the evolution of herbivory. Although no skull material from Lupeosaurus has been preserved, the ribs show curvature throughout their length (Sumida 1989). This produces the barrel-like chest cavity characteristic of herbivorous pelycosaurian-grade synapsids, thought to be necessitated by the long intestine required for gut fermentation of plant material (Sumida 1989; Reisz and Fröbisch 2014). Edaphosaurus’s status as an herbivore is clear; the leaf-shaped serrated teeth and occluding tooth plates formed from the palatal and dentary teeth are indicative of an herbivorous diet (Romer and Price 1940; Modesto 1995; Sues and Reisz 1998).
The coincidence of the evolution of herbivory and selection towards large body size in edaphosaurids provides support for the observation of Reisz and Fröbisch (2014) that the earliest terrestrial herbivores showed a tendency towards larger body size, although it should be noted that the universality of this “rule” has been challenged; in captorhinids, the evolution of large size was found to be unrelated to diet (Brocklehurst 2016). One must also consider the precise reason behind this relationship. In African ungulates, larger body size is correlated with reduced predation; larger taxa have fewer predators and a lower percentage of their mortalities are caused by predation (Sinclair et al. 2003). However, the increase in body size in the predatory sphenacodontids, the largest and most abundant terrestrial predators of their time, occurred later than the increase in herbivorous edaphosaurids (Fig. 3). Therefore, increased predation seems an unlikely selective pressure towards larger size. Alternative explanations are physiological. The abundance-packet size hypothesis (Olsen 2015) suggests that because larger taxa have greater energy requirements, a lineage that evolves a larger body size will experience a selective pressure towards finding a more abundant food source, such as plant matter (or alternatively find food in larger “packets”, i.e., feed on larger prey). However, this explanation does not fit in the case of edaphosaurids. The abundance-packet size hypothesis suggests that the transition to herbivory should occur in larger taxa; that is, the diet transition should follow the change in body size. This hypothesis provides no selective pressure towards larger body size in herbivores, and cannot explain the phenotypic selection identified in this lineage.
A more fitting model linking herbivory and body size is the Jarman-Bell principle (Geist 1974). This principle posits that although larger animals have larger absolute energy requirements, smaller animals have higher metabolic energy requirements relative to their body size. Therefore, larger herbivores are able to subsist on lower quality plant material such as leaves. Because such low quality plant material is more abundant than higher quality material such as roots and fruits, this model does supply a selective pressure towards larger body size in an herbivorous lineage, and can therefore provide an explanation for the positive phenotypic selection observed in edaphosaurids.
One must consider the small specimen from the Stephanian-aged Rakonitz coal basin (equivalent to Gzhelian) of the Czech Republic, assigned to the species Edaphosaurus mirabilis. If its assignment to Edaphosaurus is correct, this would represent the smallest species of this genus, with an estimated mass of 5 kg (Romer and Price 1940). The assignment of this specimen to Edaphosaurus is unclear due to its incompleteness (only a single dorsal centrum and partial neural spine is preserved), and it has been suggested that it may belong to Ianthasaurus (Modesto and Reisz 1990a), a small insectivorous edaphosaurid from the Carboniferous of the USA (Reisz and Berman 1986; Modesto and Reisz 1990b; Mazierski and Reisz 2010). Nevertheless, even if its assignment to the herbivorous Edaphosaurus is assumed to be correct, this does not alter the inference of phenotypic selection; when E. mirabilis is added 100 times to random positions within Edaphosaurus, positive phenotypic selection towards larger body size is still identified along the same lineage leading to the herbivorous edaphosaurids. Significant phenotypic selection is also identified in E. mirabilis itself in the majority of these 100 phylogenies, indicating that if its assignment to Edaphosaurus is correct and it is not a juvenile, it represents an example of miniaturisation. It does not overturn the inference of selection towards larger body size in the herbivores.

Phenotypic selection in Sphenacodontia

The known Carboniferous and early Permian Sphenacodontia form an entirely carnivorous set of taxa. While therapsids are included in the clade Sphenacodontia, and do include herbivorous taxa, they are unknown from the Carboniferous and early Permian fossil record with the exception of a set of sacral vertebrae (Spindler 2014). As such, therapsid body size evolution cannot be compared with the Sphenacodontidae or Edaphosauridae, and is discounted from this discussion.
As was observed in edaphosaurids, Sphenacodontia showed significant selection towards a larger body size occurring along a single lineage leading to the Sphenacodontidae, the dominant clade of large terrestrial marco-carnivores in the early Permian. This rapid increase in body size occurred shortly after it occurred in Edaphosauridae, and the two may have been linked. It is unsurprising that larger carnivores have been shown to be able to feed on a wider range of prey (Sinclair et al. 2003). As the appearance of large Edaphosauridae provided a wider range of available prey sizes, there would have been a selective pressure towards larger carnivores able to exploit the greater variety of prey items available.
It should be noted, however, that this explanation does rely on the inference of a predator–prey relationship in the absence of definite evidence. While Dimetrodon and Edaphosaurus are often assumed to have existed in a predator–prey relationship (Romer and Price 1940), there is little actual data for the diet of sphenacodontids in the fossil record (although one notable example is a skeleton of the temnospondyl Zatrachys in the body cavity of Dimetrodon milleri (Romer and Price 1940)). There is a definite disparity in the abundance of sphenacomorphs, with edaphosaurids being considerably less common than their supposed sphenacodontid predators (Olson 1966). This latter point implies that sphenacodontids must have, at the very least, supplemented their diet with other tetrapods or fish (Romer and Price 1940; Olson 1966; Bakker 2015).
Moreover, the nature of the body size increase in Sphenacodontia is less clear than in Edaphosauridae. While positive phentotypic selection is well supported in all 100 time-calibrated trees containing the taxa subjected to cladistic analysis, when the sphenacodontian taxa not subjected to phylogenetic analysis were added at random to their supposed genera, support for phenotypic selection was only found in 42% of analyses. It appears that the inference of significant selection towards larger body size at the base of Sphenacodontidae is highly dependent on the taxa included in the analysis.
Even if we accept the results of the analyses including the smaller sample of taxa, the magnitude of the increase in size at the base of the Sphenacodontidae is less than that of Edaphosauridae. A further difference between the two can be observed in the period following these two rapid increases. While the carnivorous Sphenacodontidae continued to increase in size throughout the early Permian, the herbivorous members of Edaphosauridae showed little change in body mass following their initial increase (Fig. 3). The results of the TM1 analysis support this observation; a shift towards lower rates of size evolution was identified at the node containing the largest species of Edaphosaurus (Fig. 2), which presumably have converged on this adaptive optimum.
This last contrast allows us to infer differing modes of phenotypic selection acting on the high-fibre herbivores and the macro-carnivores. While the lineage leading to herbivores does exhibit selection towards a mass larger than that of the ancestral taxa, this appears to be selection towards an adaptive optimum rather than a constant trend. Once this optimum is reached, there is a shift towards lower rates of evolution and body sizes remain within a relatively narrow range. On the other hand, the sphenacodontid top-predators continued to evolve ever-larger body sizes throughout the early Permian. By the Kungurian, the lineage leading to Dimetrodon grandis had exceeded the largest known edaphosaurid. The increased diversity and abundance of some of the largest terrestrial animals of the early Permian, the caseids, in the latter stages of the Cisuralian (Olson 1954, 1968; Reisz et al. 2011; Brocklehurst et al. 2013; Romano and Nicosia 2014) may provide a reason for the continued increase in body size: the need to expand the possible diet range to include these even larger prey items. The sphenacodontids also evolved a more sophisticated dental apparatus at this time: “true” ziphodonty, where the serrations of the teeth have denticles with a dentine core (Brink and Reisz 2014).

Conclusions

The data presented here support the hypothesis of a tendency towards increased body size in the earliest terrestrial vertebrate herbivores, at least in Edaphosauridae. Phenotypic selection towards larger body size was identified along the lineage leading to the herbivorous members of this clade. A similar increase in body size was observed early on in the evolutionary history of the closely related clade of macro-carnivores, the Sphenacodontidae. The carnivorous and herbivorous lineages both exhibited selection towards larger sizes early in their history; however, their subsequent evolution demonstrates different modes of body size evolution rather than simply different magnitudes. The Edaphosauridae appear to have been held to an adaptive optimum of large size, with low rates of evolution once this size had been reached. The Sphenacodontidae, on the other hand, experienced an initial rapid increase in mass, but did not show the subsequent decrease in rate, and instead continued to show increases throughout the early Permian. The Sphenacomorpha represent a reminder that one cannot only consider the direction and magnitude of changes in morphology; rates and modes are no less important if one is to understand the selective pressures driving evolution.

Acknowledgements

We would like to thank Roger Benson, Nicolàs Campione, Robert Reisz, and the anonymous reviewers for helpful comments and discussion. Joanna Baker and Gavin Thomas provided assistance and instruction in BayesTraits and MOTMOT, respectively. This study was financially supported by a Deutsche Forschungsgemeinschaft grant (number FR 2457/5-1), awarded to Professor Jörg Fröbisch (supporting NB).

References

Angielczyk K, and Schmitz L. 2014. Nocturnality in synapsids predates the origin of mammals by over 100 million years. Proceedings of the Royal Society B: Biological Sciences, 281: 20141642.
Baker J, Meade A, Pagel M, and Venditti C. 2015. Positive phentypic selection inferred from phylogenies. Biological Journal of the Linnean Society, 118: 95–115.
Bakker RT. 1986. The dinosaur heresies: new theories unlocking the mystery of the dinosaurs and their extinction. Morrow, New York, New York.
Bakker RT. 2015. Dimetrodon and the earliest apex predators: the Craddock Bone Bed and George Ranch Facies show that aquatic prey, not herbivores, were key food sources. Journal of Vertebrate Paleontology Program and Abstracts, 86: 83.
Bapst DW. 2012. paleotree: an R package for paleontological and phylogenetic analyses of evolution. Methods in Ecology and Evolution, 3: 803–807.
Bennett SC. 1996. Aerodynamics and thermoregulatory function of the dorsal sail of Edaphosaurus. Paleobiology, 22: 496–506.
Benson RBJ. 2012. Interrelationships of basal synapsids: cranial and postcranial morphological partitions suggest different topologies. Journal of Systematic Palaeontology, 10: 601–624.
Berman DS, Reisz RR, Martens T, and Henrici AC. 2001. A new species of Dimetrodon (Synapsida: Sphenacodontidae) from the Lower Permian of Germany records first occurrence of genus outside North America. Canadian Journal of Earth Sciences, 38: 803–812.
Bramwell C, and Fellgett P. 1973. Thermal regulation in sail lizards. Nature, 242: 203–205.
Brink KS, and Reisz RR. 2014. Hidden dental diversity in the oldest terrestrial apex predator Dimetrodon. Nature Communications, 5: 3269.
Brink KS, LeBlanc A, and Reisz RR. 2014. First record of plicidentine in Synapsida and patterns of tooth root shape change in Early Permian sphenacodontians. Naturwissenschaften, 101: 883–892.
Brink KS, Maddin HC, Evans DC, and Reisz RR. 2015. Re-evaluation of the historic Canadian fossil Bathygnathus borealis from the Early Permian of Prince Edward Island. Canadian Journal of Earth Sciences, 52: 1109–1120.
Brocklehurst N. 2016. Rates and modes of body size evolution in early carnivores and herbivores: a case study from Captorhinidae. PeerJ, 4: e1555.
Brocklehurst N, and Fröbisch J. 2014. Current and historical perspectives on the completeness of the fossil record of pelycosaurian-grade synapsids. Palaeogeography, Palaeoclimatology, Palaeoecology, 399: 114–126.
Brocklehurst N, Kammerer CF, and Fröbisch J. 2013. The early evolution of synapsids and the influence of sampling on their fossil record. Paleobiology, 39: 470–490.
Brocklehurst N, Reisz RR, Fernandez V, and Fröbisch J. 2016. A re-description of ‘Mycterosaurus’ smithae, an Early Permian eothyridid, and its impact on the phylogeny of pelycosaurian-grade synapsids. PLoS ONE, 11: e0156810.
Brocklehurst N, Ruta M, Müller J, and Fröbisch J. 2015. Elevated extinction rates as a trigger for diversification rate shifts: early amniotes as a case study. Scientific Reports, 5: 17104.
Brusatte SL, Benton MJ, Ruta M, and Lloyd GT. 2008. Superiority, competition and opportunism in the evolutionary radiation of dinosaurs. Science, 321: 1485–1488.
Campione NE, and Evans DC. 2012. A universal scaling relationship between body mass and proximal limb bone dimensions in quadrupesal terrestrial tetrapods. BMC Biology, 10: 60.
Currie PJ. 1977. A new haptodontine sphenacodont (Reptilia: Pelycosauria) from the Upper Pennsylvanian of North America. Journal of Paleontology, 51: 927–942.
Demment MW. 1982. The scaling of ruminoreticulum size with body weight in East African ungulates. African Journal of Ecology, 20:43–47.
Demment MW, and Van Soest PJ. 1985. A nutritional explanation for body-size patterns of ruminant and nonruminant herbivores. The American Naturalist, 125: 641–672.
Dudley R, and Vermeij GJ. 1992. Do the power requirements of flapping flight constrain folivory in flying animals? Functional Ecology, 6: 101–104.
Farlow JO. 1987. Speculations about the diet and digestive physiology of herbivorous dinosaurus. Paleobiology, 13: 60–72.
Fleming TH. 1991. The relationship between body size, diet and habitat use in frugivorous bats, genus Carollia (Phyllostomidae). Journal of Mammalogy, 72: 493–501.
Florides GA, Kalogirou SA, Tassou SA, and Wrobel L. 2001. Natural environment and thermal behaviour of Dimetrodon limbatus. Journal of Thermal Biology, 26: 15–20.
Gaulin SJ. 1979. A Jarman/Bell model of primate feeding niches. Human Ecology, 7: 1–20.
Geist V. 1974. On the relationship of social evolution and ecology in ungulates. American Zoologist, 14: 205–220.
Gould SJ. 1967. Evolutionary patterns in pelycosaurian reptiles: a factor-analytic study. Evolution, 21: 385–401.
Gould SJ, and Littlejohn J. 1973. Factor analysis of caseid pelycosaurs. Journal of Paleontology, 47: 886–891.
Haack SC. 1986. A thermal model of the sailback pelycosaur. Paleobiology, 12: 450–458.
Hunt G. 2006. Fitting and comparing models of phyletic evolution: random walks and beyond. Paleobiology, 32: 578–601.
Hunt G, Bell M, and Travis M. 2008. Evolution towards a new adaptive optimum: phenotypic evolution in a fossil stickleback lineage. Evolution, 62: 700–710.
Huttenlocker AK, Mazierski D, and Reisz RR. 2011. Comparative osteohistology of hyperelongate neural spines in the Edaphosauridae (Amniota: Synapsida). Palaeontology, 54: 573–590.
Huttenlocker AK, Rega E, and Sumida S. 2010. Comparative anatomy and osteohistology of hyperelongate neural spines in the sphenacodontids Sphenacodon and Dimetrodon (Amniota: Synapsida). Journal of Morphology, 271: 1407–1421.
Ilius AW, and Gordon IJ. 1992. Modelling the nutritional ecology of ungulate herbivores: evolution of body size and competitive interactions. Oecologia, 89: 428–434.
Isbell LA. 1998. Diet for a small primate: insectivory and gummivory in the (large) patas monkey (Erythrocebus patas pyrrhonotus). American Journal of Primatology, 45: 381–398.
Ivakhnenko MF. 2003. Eotherapsids from the East European placket (Late Permian). Paleontological Journal, 37: 339–465.
Klasing KC. 1998. Comparative avian nutrition. CAB International, Wallingford.
Mazierski DM, and Reisz RR. 2010. Description of a new specimen of Ianthasaurus hardestiorum (Eupelycosauria: Edaphosauridae) and a re-evaluation of edaphodaurid phylogeny. Canadian Journal of Earth Sciences, 47: 901–912.
Modesto S. 1995. The skull of the herbivorous synapsid Edaphosaurus boanerges from the Lower Permian of Texas. Palaeontology, 38: 213–239.
Modesto S, and Reisz RR. 1990a. Taxonomic status of Edaphosaurus raymondi case. Journal of Paleontology, 64: 1049–1051.
Modesto S, and Reisz RR. 1990b. A new skeleton of Ianthasaurus hardestii, a primitive edaphosaur (Synapsida: Pelycosauria) from the Upper Pennsylvanian of Kansas. Canadian Journal of Earth Sciences, 27: 834–844.
Montanez IP, Isabel P, Niemeier D, DiMichele WA, Frank TD, Fielding CR, et al. 2007. CO2-forced climate and vegetation instability during Late Paleozoic deglaciation. Science, 315: 87–91.
Morton ES. 1978. Avian arboreal folivores: why not? In The ecology of arboreal folivores. Edited by MG Gene. Conservation and Research Centre, National Zoological Park, Smithsonian Institution, Washington, DC. pp. 123–130.
Müller DWH, Codron D, Meloro C, Munn A, Schwarm A, Hummel J, et al. 2013. Assessing the Jarman-Bell principle: scaling of intake, digestibility, retention time and gut fill with body mass in mammalian herbivores. Comparative Biology and Physiology, 164: 129–140.
Olsen AM. 2015. Exceptional avian herbivores: multiple transitions toward herbivory in the bird order Anseriformes and its correlation with body mass. Ecology and Evolution, 5: 5016–5032.
Olson EC. 1954. Fauna of the Vale and Choza: 7. Pelycosauria: family Caseidae. Fieldiana: Geology, 10: 193–204.
Olson EC. 1962. Late Permian terrestrial vertebrates, USA and USSR. Transactions of the American Philosophical Society, 52: 1–224.
Olson EC. 1966. Community evolution and the origin of mammals. Ecology, 47: 291–302.
Olson EC. 1968. The family Caseidae. Field Museum Press, Chicago, Illinois.
Paradis E, Claude J, and Strimmer K. 2004. APE: analyses of phylogenetics and evolution in R language. Bioinformatics, 20: 289–290.
Pearson MR, Benson RBJ, Upchurch P, Fröbisch J, and Kammerer CF. 2013. Reconstructing the diversity of early terrestrial herbivorous tetrapods. Palaeogeography, Palaeoclimatology, Palaeoecology, 372: 42–49.
Pivorunas A. 1970. Allometry in the limbs and sail of Dimetrodon. M.S. thesis, University of Illinois, Chicago, Illinois. 100 p.
Pol D, and Norrel M. 2006. Uncertainty in the age of fossils and the stratigraphic fit to phylogenies. Systematic Biology, 55: 512–521.
Pough FH. 1973. Lizard energetics and diet. Ecology, 54: 837–844.
Price SA, and Hopkins SSB. 2015. The macroevolutionary relationship between diet and body mass across mammals. Biological Journal of the Linnean Society, 115: 173–184.
R Core Team. 2014. R: A language and environment for statistical computing. R Foundation for Statistical Computing, Vienna, Austria [online]: Available from https://www.r-project.org/.
Rega EA, Noriega K, Sumida SS, Huttenlocker A, Lee A, and Kennedy B. 2012. Healed fractures in the neural spines of an associated skeleton of Dimetrodon: implications for dorsal sail morphology and function. Fieldiana Life and Earth Sciences, 5: 104–111.
Reisz RR, and Berman DS. 1986. Ianthasaurus hardestii n. sp., a primitive edaphosaur (Reptilia, Pelycosauria) from the Upper Pennsylvanian Rock Lake Shale near Garnett, Kansas. Canadian Journal of Earth Sciences, 23: 77–91.
Reisz RR, and Fröbisch J. 2014. The oldest caseid synapsid from the Late Pennsylvanian of Kansas, and the evolution of herbivory in terrestrial vertebrates. PLoS ONE, 9: e94518.
Reisz RR, and Sues H-D. 2000. Herbivory in late Paleozoic and Triassic terrestrial vertebrates. In Evolution of herbivory in terrestrial vertebrates: perspectives from the fossil record. Edited by H-D Sues. Cambridge University Press, Cambridge. pp. 9–41.
Reisz RR, Maddin HC, Fröbisch J, and Falconnet J. 2011. A new large caseid (Synapsida, Caseasauria) from the Permian of Rodez (France), including a reappraisal of “Casearutena Sigogneau-Russell & Russell, 1974. Geodiversitas, 33: 227–246.
Rodbard S. 1949. On the dorsal sail of Dimetrodon. Copeia, 1949: 224–224.
Romano M, and Nicosia U. 2014. Alierasaurus ronchii, gen. et sp. nov., a caseid from the Permian of Sardinia, Italy. Journal of Vertebrate Paleontology, 34: 900–913.
Romer AS. 1927. Notes on the Permo-Carboniferous reptile Dimetrodon. Journal of Geology, 35: 673–689.
Romer AS, and Price LI. 1940. Review of the Pelycosauria. Geological Society of America Special Publications, 28: 1–538.
Sahney S, and Benton MJ. 2008. Recovery from the most profound mass extinction of all time. Proceedings of the Royal Society B, 275: 759–765.
Sahney S, Benton MJ, and Falcon-Lang HJ. 2010. Rainforest collapse triggered Carboniferous tetrapod diversification in Euramerica. Geology, 38: 1079–1082.
Schluter D. 1984. Body size, prey size and herbivory in the Galapagos lava lizard, Tropidurus. Oikos, 43: 291–300.
Sinclair ARE, Mduma S, and Brashares JS. 2003. Patterns of predation in a diverse predator-prey system. Nature, 425: 288–290.
Smith FA, Boyer AG, Brown JH, Costa DP, Dayan T, Morgan Ernest SK, et al. 2010. The evolution of maximum body size of terrestrial mammals. Science, 330: 1216–1219.
Spindler F. 2014. Reviewing the question of the oldest therapsid. Paläontologie, Stratigraphie, Fazies, 22: 1–7.
Sues H-D, and Reisz RR. 1998. Origins and early evolution of herbivory in tetrapods. Trends in Ecology and Evolution, 13: 141–145.
Sumida SS. 1989. New information on the pectoral girdal and vertebral column in Lupeosaurus (Reptilia, Pelycosauria). Canadian Journal of Earth Sciences, 26: 1343–1349.
Thomas GH, and Freckleton RP. 2012. MOTMOT: models of trait macroevolution on trees. Methods in Ecology and Evolution, 3: 145–151.
Tomkins JL, LeBas NR, Witton MP, Martill DM, and Humphries S. 2010. Positive allometry and the prehistory of sexual selection. The American Naturalist, 176: 141–148.
Tracy C, Turner J, and Huey R. 1986. A biophysical analysis of possible thermoregulatory adaptations in sailed pelycosaurs. In The ecology and biology of mammal-like reptiles. Edited by N Hotton, PD MacLean, JJ Roth, and EC Roth. Smithsonian Institution Press, Washington, District of Colombia. pp. 195–206.
Venditti C, Meade A, and Pagel M. 2011. Multiple routes to mammalian diversity. Nature, 479: 393–396.
Zanno LE, and Mackovicky PJ. 2012. No evidence for directional evolution of body mass in herbivores. Proceedings of the Royal Society B, 280: 20122526.

Supplementary material

Supplementary Material 1 (CSV / 1.39 KB):
Supplementary Material 2 (TRE / 4.20 KB):
Supplementary Material 3 (TRE / 64.8 KB):
Supplementary Material 4 (TRE / 85.5 KB):
Supplementary Material 5 (CSV / 2.56 KB):
Supplementary Material 6 (RDATA / 3.88 KB):

Information & Authors

Information

Published In

cover image FACETS
FACETS
Volume 2Number 1January 2017
Pages: 68 - 84
Editor: Christofer J. Clemente

History

Received: 22 August 2016
Accepted: 5 November 2016
Version of record online: 2 February 2017

Data Availability Statement

All relevant data are within the paper and in the Supplementary Material.

Key Words

  1. diet
  2. Paleozoic
  3. Synapsida
  4. Edaphosauridae
  5. Sphenacodontia
  6. body size

Sections

Subjects

Authors

Affiliations

Neil Brocklehurst [email protected]
Museum für Naturkunde, Leibniz-Institut für Evolutions- und Biodiversitätsforschung, Invalidenstraße 43, D-10115 Berlin, Germany
Kirstin S. Brink
Department of Oral Health Sciences, Life Sciences Institute, University of British Columbia, 2350 Health Sciences Mall, Vancouver, BC V6T 1Z3, Canada

Author Contributions

NB conceived and designed the study.
All performed the experiments/collected the data.
NB analyzed and interpreted the data.
NB contributed resources.
All drafted or revised the manuscript.

Competing Interests

The authors have declared that no competing interests exist.

Metrics & Citations

Metrics

Other Metrics

Citations

Cite As

Export Citations

If you have the appropriate software installed, you can download article citation data to the citation manager of your choice. Simply select your manager software from the list below and click Download.

Cited by

1. The Largest Mesosaurs Ever Known: Evidence from Scanty Records
2. Predatory synapsid ecomorphology signals growing dynamism of late Palaeozoic terrestrial ecosystems
3. First volumetric body mass estimate and a new in vivo 3D reconstruction of the oldest Karoo pareiasaur Bradysaurus baini , and body size evolution in Pareiasauria
4. Derived faunivores are the forerunners of major synapsid radiations
5. Middle to Late Pennsylvanian tetrapod evolution: the Kasimovian bottleneck
6. The postcranial anatomy of Gorgonops torvus (Synapsida, Gorgonopsia) from the late Permian of South Africa
7. Revisiting the evolutionary trend toward the mammalian lower jaw in non-mammalian synapsids in a phylogenetic context
8. Early Origins of Divergent Patterns of Morphological Evolution on the Mammal and Reptile Stem-Lineages
9. The geometry of synapsid skull disparity
10. A Carboniferous synapsid with caniniform teeth and a reappraisal of mandibular size-shape heterodonty in the origin of mammals
11. The First Age of Reptiles? Comparing Reptile and Synapsid Diversity, and the Influence of Lagerstätten, During the Carboniferous and Early Permian
12. Volumetric Body Mass Estimate and in vivo Reconstruction of the Russian Pareiasaur Scutosaurus karpinskii
13. Distributions of extinction times from fossil ages and tree topologies: the example of mid-Permian synapsid extinctions
14. Phylogenetic Comparative Methods: A User's Guide for Paleontologists
15. Evolutionary Change in Locomotion Close to the Origin of Amniotes Inferred From Trackway Data in an Ancestral State Reconstruction Approach
16. Bone histology and microanatomy of Edaphosaurus and Dimetrodon (Amniota, Synapsida) vertebrae from the Lower Permian of Texas
17. Distributions of extinction times from fossil ages and tree topologies: the example of mid-Permian synapsid extinctions
18. The origin of tetrapod herbivory: effects on local plant diversity
19. Antiquity of “Sail-Backed” Neural Spine Hyper-Elongation in Mammal Forerunners
20. Edaphosauridae (Synapsida, Eupelycosauria) from Europe and their relationship to North American representatives
21. Re-evaluation of an early sphenacodontian synapsid from the Lower Permian of England
22. The skull of Tetraceratops insignis (Synapsida, Sphenacodontia)
23. Morphological evolution in therocephalians breaks the hypercarnivore ratchet
24. A reexamination of Milosaurus mccordi , and the evolution of large body size in Carboniferous synapsids
25. Gut Microbiota as a Trigger of Accelerated Directional Adaptive Evolution: Acquisition of Herbivory in the Context of Extracellular Vesicles, MicroRNAs and Inter-Kingdom Crosstalk
26. Rates of morphological evolution in Captorhinidae: an adaptive radiation of Permian herbivores

View Options

View options

PDF

View PDF

Media

Tables

Media

Share Options

Share

Share the article link

Share on social media