The diversity of insect parasitoids (Hymenoptera) has long been thought to be anomalous because it doesn’t appear to increase rapidly with decreasing latitude. However, due to the presence of undiscovered cryptic species and the under-sampling of hyper-diverse tropical areas, such apparently anomalous gradients may, in fact, be artifacts of limited geographic and taxonomic sampling. We attempted to circumvent such taxonomic impediments by elucidating a diversity/latitude relationship for parasitoid wasps, using publicly available DNA sequences to quantify diversity (via a species proxy molecular operational taxonomic unit (the DNA Barcode Index Number) and phylogenetic diversity) across a latitudinal gradient of ∼5000 km. We compared these diversity values to the abiotic factors (temperature and precipitation) that may drive the diversity/latitude relationship. We found no significant relationship between either diversity measure with latitude or with the environmental variables. Although ours is the first work to enumerate different DNA-based measures of parasitoid diversity across this geographic scale in a standardized fashion using publicly available sequences, further standardized collections over long time periods and a rapid movement of sequences into the public arena are needed to facilitate the further testing of macroecological trends elucidated with public DNA sequence libraries.
Introduction
Latitudinal diversity gradients
For many taxa, there is a negative relationship between biodiversity and latitude (Willig 2001) caused by a combination of climate, energy, and area (Hillebrand 2004). In particular, the variance of local abiotic factors greatly influences the species richness in a specific region (Willig 2001, p. 707). For example, some highly diverse tropical localities are expected to be characterized by more favourable and stable environmental conditions with high solar insolation and warm temperature and low intra-annual variation in temperature and rainfall (Willig 2001; Archibald et al. 2010). Such stability and heat are important if kinetics, the effects of temperature on ecological and evolutionary rates, is the most important factor determining species diversity (Brown 2014). Although a general consensus on which hypotheses best explain such latitudinal diversity gradients has not been reached, plausible historical and ecological hypotheses for these phenomena include: that there is, on average, greater land surface area in the tropics than in higher latitude regions (Terborgh 1973); that tropical species have had time to accumulate in any one location for longer time periods compared with higher latitudes (Mittelbach et al. 2007); that the tropics receive more solar radiation (positively correlated with energy availability, productivity, and biomass (Pianka 1966; Robinson 1966)); that higher latitudes are characterized by harsh environmental conditions that are more metabolically costly for many organisms (Willig et al. 2003); that organisms able to withstand greater seasonal variation can possess larger distribution ranges, whereas tropical organisms with lower tolerance to seasonal variation are restricted to smaller ranges (Rapoport 1975); and finally, that tropical diversity is greater than temperate because higher ambient temperatures can increase speciation rates through shorter generation times, higher mutation rates, and accelerated selection pressure (Rohde 1992).
Anomalous latitudinal diversity trends in parasitoids
Willig et al. (2003) found that nearly 71% of 135 analyses that had tested latitudinal diversity gradients showed that diversity was higher in the tropics. A meta-analysis by Hillebrand (2004) surveyed more than 600 latitudinal diversity gradient studies and found a small number of exceptions (4.3%) to the general negative relationship. Some of the cases (sawflies and bryophytes) were exceptional as diversity increased with latitude (Kouki et al. 1994; Mateo et al. 2016). Some, such as the bumblebees, displayed mid-latitude peaks within both North America and Europe (Kerr et al. 2015). However, many of the exceptions noted were of parasitic insect taxa (Owen and Owen 1974; Willig et al. 2003). In one of the most famous examples, Janzen (1981) reported that the greatest diversity of Nearctic Ichneumonidae existed between 37.5°N and 42.4°N latitude and that diversity then declined towards the equator. Skillen et al. (2000) corroborated Janzen’s findings and suggested that the mid-latitude peak in diversity was wider than originally hypothesised. In the intervening years, multiple hypotheses have been proposed to explain this anomalous diversity pattern. Janzen and Pond (1975) proposed the resource fragmentation hypothesis, where because the abundance of any host species in the tropics is so low, the number of parasitoid species that could successfully locate and parasitize them would be lower. Rabinowitz and Price (1976) proposed the predation hypothesis, such that if there were higher predation pressures in the tropics, then we should expect that the immature/larval stages would be more vulnerable to predation, and therefore tropical parasitoid diversity would be lower than temperate areas with lower rates of predation. Gauld’s nasty-host hypothesis (Gauld et al. 1992) suggested that tropical herbivores/hosts sequester the noxious secondary metabolites available in tropical plants against parasitoids in higher quantities than in temperate herbivores/hosts. Thus, the parasitoid diversity will be lower in the tropics than in temperate areas because of the, on average, greater toxicity of the tropical herbivores’ tissue. Finally, the interphyletic competition hypothesis suggested that if tropical parasitoid wasps have to compete with other parasitic taxa expected to be more diverse in the tropics (such as the parasitoid Tachinidae (Diptera) and parasitic nematodes and fungi), then parasitoid wasp diversity would be lower in the tropics due to this competition for host species (Eggleton and Gaston 1990).
Doubts about anomalous diversity patterns
Since Janzen’s (1981) work, ichneumonid wasps have been presented as an exception to the general pattern of diversity increasing towards mid-latitudes (Gaston and Williams 1996; Pimentel and Pimentel 2007; Gaston and Blackburn 2008). However, some have questioned whether this apparent exception is a trend actually caused by limits in taxonomic and geographic sampling (Skillen et al. 2000; Willig et al. 2003; Jones et al. 2009; Baselga et al. 2010; Santos and Quicke 2011; Quicke 2012; Veijalainen et al. 2012). For example, data from comparatively well-studied northern geographic regions such as North America and Europe (Santos and Quicke 2011) and data gathered over longer time periods may conflate our understanding of species richness (Willig et al. 2003). Furthermore, as we have noted above, there is an extremely large proportion of undescribed species in the Parasitica with between 75% and 90% of Hymenopteran species remaining to be discovered (LaSalle and Gauld 1993; Godfray 1994). This taxonomic impediment is accentuated by the fact that investigating large-scale trends requires the compilation of often incongruous data, but doing so makes direct comparisons between studies challenging.
Using DNA barcodes to estimate phylogenetic diversity (PD)
As noted by Kress et al. (2015), it can be a challenge to use DNA barcodes (or any single marker) to capture evolutionary relationships among both divergent and closely related species. However, in a case where a phylogenetic reconstruction is based on short sequences (such as DNA barcodes), the strength of taxon relationships can be better estimated with high species density (i.e., the total diversity included) (Smith et al. 2009). Consequently, there are a growing number of examples where barcoding loci have been used to calculate PD. For example, the botanical community has made routine use of the DNA barcode loci for measures of PD (Hardy and Senterre 2007; Swenson et al. 2012), whereas the animal barcoding locus (COI) has been used in an increasing number of cases (Smith et al. 2005, 2009, 2014, 2017; Smith and Fisher 2009; Abrahamczyk et al. 2014). In some cases, a sufficient taxonomic and systematic framework existed to test the barcode measure PD values against a more in-depth phylogeny and when tested, the trends measured did not differ (Smith et al. 2014). In another case, Abrahamczyk et al. (2014) found that when they compared phylogenetic measures of diversity derived from a four-loci phylogeny versus a COI only (i.e., a DNA barcode) phylogeny the trends they produced were highly correlated and uncovered the same relationships between PD and latitude. Finally, others (Faith and Baker 2006) have noted that using PD from barcoding data allows the researcher to use the database without the sometimes contentious use of barcodes as species proxies or designations.
The DNA barcode region from COI is not without phylogenetic signal. For instance, Quicke et al. (2012) showed that phylogenetic analyses of the DNA barcode region recovered several morphologically recognized subfamilies of Ichneuomoidea (the superfamily containing most of our sequences) as monophyletic. This suggests that, in some cases, there is sufficient phylogenetic signal in COI to place sequences to subfamily and genus. Furthermore, we note that it should be recognised that taxonomically erected species hypotheses groups are, in themselves, hypotheses. Indeed, as hypotheses, species names and taxonomic groups will, and do, change. For example, we have known for years that the commonly used group of Hymenoptera “Symphyta” is actually paraphyletic (Song et al. 2016) and the recent systematic examination of the parasitoid wasp tribe, the Cryptini, revealed previously un-appreciated subfamilies hiding within that name (Santos 2017). Thus, testing one form of identification information against another is not a test of an unknown (the sequence data) against a statement of truth (the taxonomic hypothesis). We feel that by using barcode index numbers (BINs) and phylogenetic measures of diversity, our diversity measurements are more transparent to taxonomic uncertainty and robust to future re-testing (Mace et al. 2003; Smith et al. 2017). In the case of the Parasitica this is particularly important as these parasitoids are frequently exposed to taxonomic impediments (Lovejoy et al. 2010; Smith 2012). In some groups, such as the diverse subfamily Cryptinae, authors have described the “ubiquity of morphological homoplasy” (Santos 2017) that plagues and slows morphological determinations of species boundaries. Thus, analyses of diversity based on barcodes can be completed both before formal species identifications or descriptions are finished, and after. Indeed, in some cases where integrative taxonomic analyses that included DNA and morphological analyses were conducted coincidentally, it was found that barcodes alone would have recognized more than 97% of the species in the studies (Fernandez-Triana et al. 2011). Furthermore, because the data are public such analyses are directly available to interested taxonomists in the future (Stahlhut et al. 2013).
Objectives
Our objective was to test a contentious macroecological trend, anomalous patterns of latitudinal diversity, with publicly available data from a diverse taxonomic group, the Parasitica, or parasitoid wasps. It would be very interesting to compare and contrast our findings with these data once a more complete formal identification of all specimens has been completed—however, this is beyond the scope of this single research paper. Thus, our analysis should be considered as an exploratory first step into public data, rather than a fully integrative taxonomy (Agnarsson and Kuntner 2007). Our principal objective was to investigate what latitudinal diversity pattern(s) in the Parasitica was evident when diversity was enumerated using publicly available DNA from parasitoids derived from the Barcode of Life Data System (BOLD) across more than 50° of latitude (∼4.9°–58.7°N). We used two methods to calculate diversity: a specific type of molecular operational taxonomic unit (MOTU) (Blaxter et al. 2005) called BINs (Ratnasingham and Hebert 2013), and PD (Crozier et al. 2009) derived from DNA barcodes. From the total number of parasitoid sequences available, we selected a subset for which we were able to largely control for the type of collection and sequence quality. Using the barcode-data informed-phylogenetic hypotheses to estimate PD allows us to sidestep the species problem (Faith and Baker 2006). Furthermore, using the BINs as a species proxy allows us to enumerate “diversity” before formal species designations have been assigned. As latitude itself is not the cause of the gradient (Heard 1991), but rather a surrogate for gradients of temperature and precipitation, we used public data from the WorldClim data set (Hijmans et al. 2005) to compare our diversity measures with mean annual temperature and total annual precipitation. The total abiotic variables available from the WorldClim data set include a variety of measures of temperature and precipitation. If parasitoid diversity was positively correlated with precipitation or temperature, then we expected to observe a negative correlation with latitude. The departure from the trend of declining diversity with latitude suggests what Quicke (2012, p. 1) called the “massive under-description of tropical parasitoid faunas”. What we found did not support the existence of any latitudinal gradient in parasitoid diversity, which in turn may suggest that the rate of under-description (unappreciated or named diversity—cryptic or otherwise) is high across latitude. Indeed, our analysis of these publicly available DNA sequences supports and extends Quicke’s (2012, p. 1) collections-based conclusions that, “the collecting and processing of museum specimens, and selection of taxa for revision, is woefully inadequate to allow latitudinal patterns in biology to be analysed”. Our work, conducted on newly collected specimens, suggests that not only is the processing of museum samples as yet inadequate to analyze diversity patterns, the de novo collections in the field also require greater emphasis. Although one of our principal conclusions is that much work remains to be done, our work demonstrates the value in completing these analyses using publicly available DNA sequence libraries to test macroecological hypotheses a priori to the formal species descriptions and designations on the specimens from which those sequences were derived.
Materials and methods
Data collection and molecular analyses
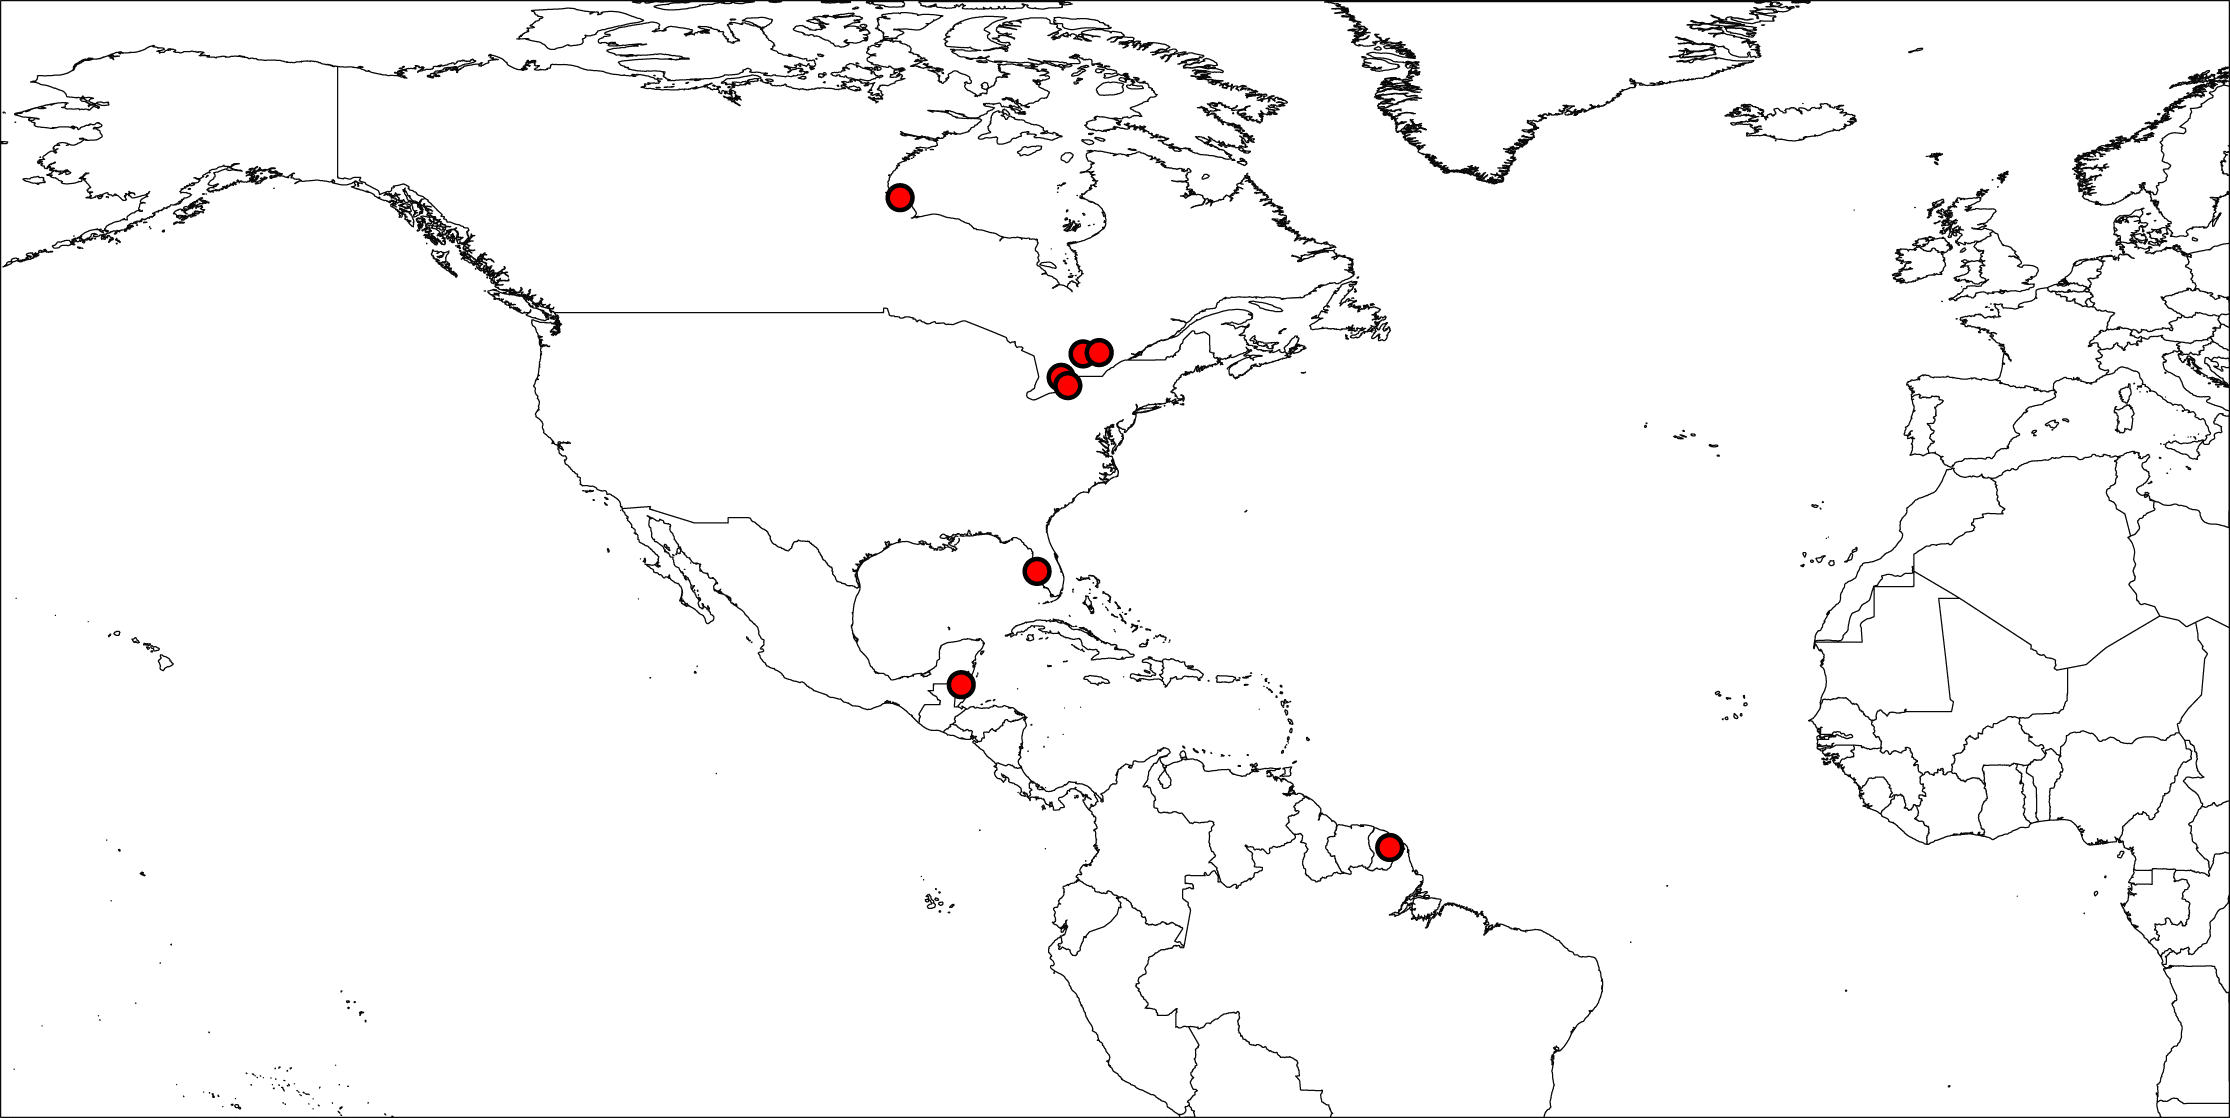
To test our predictions, we used a subset of publicly available DNA barcodes across a large latitudinal gradient. It is well known that different trapping methods recover different impressions of an ecological community (Noyes 1989b). Collections made in different locations, via different methods, may not be able to detect or differentiate site differences from trap differences (Veijalainen et al. 2012). We have tried to avoid this potential problem by restricting our analysis to principally those publicly available sequences collected with only a small number of collection methodologies (principally Malaise traps, Supplementary Material 1). Our control for vagaries in collection methods reduced the total data set of nearly 10 000 publicly available parasitoid DNA sequences to only those for which we knew something about their field collections and methods (i.e., those principally collected from field studies by one of us (MAS)) (Fig. 1). Within these locations, we restricted our specimen selection at all sampling localities, primarily to those collected using Malaise traps (Townes and Arbor 1962) although there were a small number collected using yellow pan traps and active searching (355/4785 or ∼7%, Supplementary Material 1).
Fig. 1.
Fig. 1. Collection localities for parasitoid specimens analysed in this study. The map was constructed using SimpleMappr (simplemappr.net).
As we were responsible for the collection of the publicly available sequences used here, we can briefly report some collection details. At each sampling location, various standard variables were recorded (time on site (arrival and departure), temperature (°C), weather conditions and a brief description of the area (dominant plant species, ground cover), geographic coordinates, and a high-resolution panoramic GigaPan photograph of each locality (Supplementary Material 2) to capture details of the local, small-scale botanical species richness and habitat complexity). Upon collection, all specimens were preserved in 95% ethanol for sorting and DNA extraction. Specimens for each locality were selected randomly from traps for barcoding as described in Stahlhut et al. (2013). DNA was extracted and sequences generated using standard methods detailed elsewhere (Smith et al. 2006, 2007, 2008). We limited our analysis here to higher quality, overlapping sequences and thus we only included those COI sequences at least 300 bp long that had <1% ambiguities. Irrespective of our role in establishing the initial collections, all specimens and sequence data were and are publicly available on BOLD (Supplementary Material 3). BOLD (Ratnasingham and Hebert 2007) assembles molecular, morphological, and distributional data and (for animals) predominantly uses COI as a standardized molecular marker. BOLD also implements a BIN system (Ratnasingham and Hebert 2013) to cluster barcode sequences with an algorithm that uses graph theoretic methods to create MOTUs or BINs (Ratnasingham and Hebert 2013). This was done without any prior taxonomic knowledge, and thus, in the absence of any other taxonomic hypothesis, we used these BINs as proxies for species.
Sample size for estimating diversity
Four thousand seven hundred and eighty-five (4785) Hymenopteran parasitoid specimens from the collection sites met our selection criteria (i.e., publicly available, high-quality sequences derived from principally Malaise trapped individuals; Supplementary Material 1). This 4.785K data set acted as our full data set referred to in the results and discussions. As the number of specimens varied among sites, we used several methods to control for differential sample size among these sites: first, testing the residuals of the relationship between PD or BIN diversity and sample size; and second, randomly selecting a subset of specimens from each site based on the site with lowest number of sequences (Supplementary Materials 1, 4). For simplicity, we restrict the Results and Discussion to principally the large data set; however, the results for these two sample size controls are presented in the Supplementary Materials 4, 9, 10.
Environmental data
We derived estimates of temperature and precipitation for each site based on the 1 km2 WorldClim V1 data set (Hijmans et al. 2005) that we extracted using DIVA-GIS V.7.5 (Hijmans et al. 2012). We present here the most general composite measures of each mean annual temperature and total annual precipitation; however, the response of our biodiversity measures to the full range of abiotic variables can be seen in Supplementary Materials 5 and 6.
Diversity analyses
Barcode sequences >300 bp in length were downloaded from BOLD and aligned using MUSCLE V.3.8.31 (Edgar 2004); the alignment was verified by eye. Sequences were used to estimate the diversity of parasitoids using both molecular operational taxonomic units (BINs) and phylogenetic-based measures of diversity (PD). Two of the most prevalent definitions for PD in the literature are (1) community PD (Crozier et al. 2009; Cadotte et al. 2010), the sum of all phylogenetic branches connecting species within a community; and (2) Faith’s PD (Faith 1994), the sum of all phylogenetic branches connecting species within a community plus the root from a larger regional phylogeny. We calculated PD using the picante package (Kembel et al. 2010) in R version 3.1 (R Core Team 2016). We calculated both values, but for simplicity present only Faith’s PD here (community PD values can be found in the Supplementary Material 10).
The best substitution model was selected in MEGA V.6 (Tamura et al. 2013) for the large data set using the Bayesian Information Criterion (BIC) where the model with the lowest BIC score was considered the best substitution pattern and then used to create a maximum likelihood (ML) tree (Felsenstein 1981).
To calculate Faith’s PD, the same parameters were used as detailed above; however, the ML tree was rooted with an outgroup containing two Diptera, Hemiptera, and Lepidoptera sequences from BOLD in MEGA (Supplementary Material 7) that we selected to emulate those used by Heraty et al. (2011).
Linear regressions of the two diversity estimates for all the samples from the eight collection sites (4875 specimens) were conducted against latitude, mean annual temperature, and total annual precipitation. To aid in visualising these relationships, we smoothed the points using the non-parametric LOESS method (Cleveland and Loader 1996). Three further comparisons where we attempted to control for the range of sample sizes across these eight sites (randomly sampled subset of 2240 specimens, with the residuals of each diversity estimate compared with sample size and community estimate of PD) are detailed in Supplementary Material 8.
Results
Prior to our analysis, all of the DNA sequences analysed here were already public and could be retrieved and examined in BOLD. However, we have compiled them here into a specific data set that interested readers may consult (DOI: https://doi.org/10.5883/DS-TIEPARIS) or access via GenBank (ncbi.nlm.nih.gov/genbank/); accession numbers can be found in Supplementary Materials 3, 4, and 7.
The substitution model with the lowest BIC score was the general time reversible (GTR) model (Nei and Kumar 2000) using a discrete gamma distribution (+G) with five rate categories, and assuming that a certain fraction of sites are evolutionarily invariable (+I), was used for ML tree calculations. Note that some Hymenopterans included in this analysis displayed a characteristic 6 bp deletion in the 155th and 156th amino acids of the barcoding region which is within the third internal loop (Smith et al. 2011, p. 3; Quicke et al. 2012; Hansson et al. 2015). These deletions were included in the ML tree creation.
Diversity measures
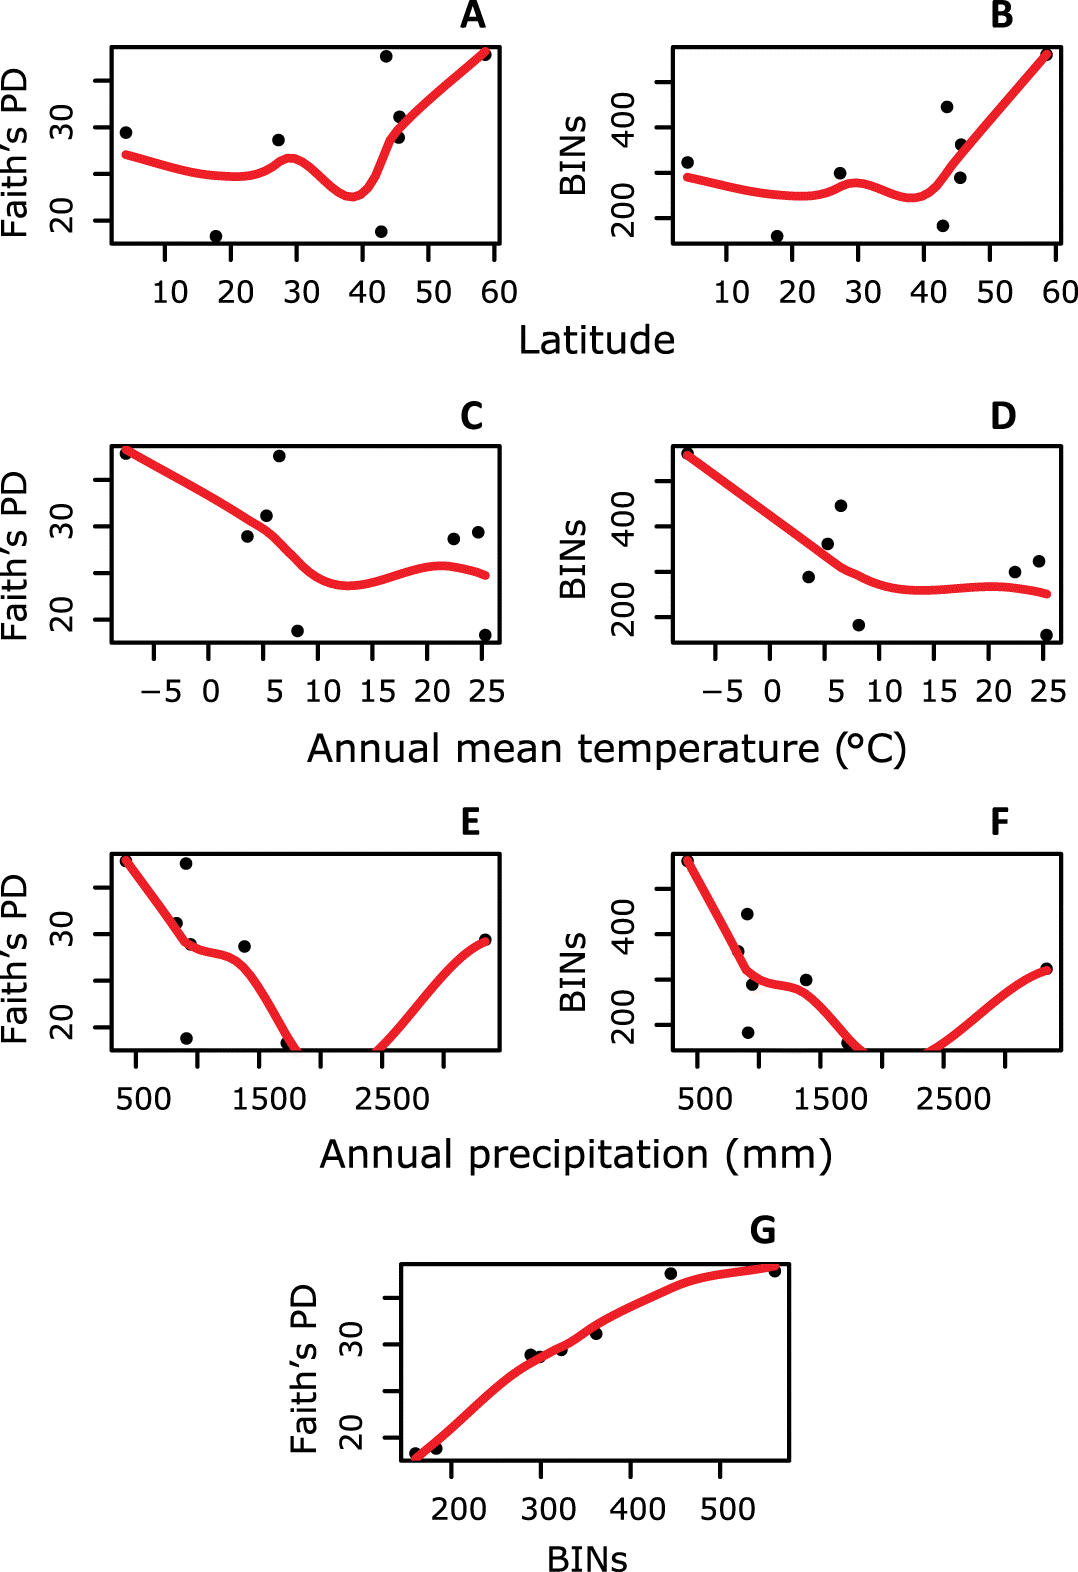
Both BIN and Faith’s PD diversity were significantly positively related (R2 = 0.733, F = 16.46, p = 0.007, Fig. 2, Supplementary Materials 8–10).
Fig. 2.
Fig. 2. Trends in parasitoid diversity measured with phylogenetic diversity (PD) and Barcode Index Numbers (BINs) derived from DNA barcodes compared with latitude, mean annual temperature, and total annual precipitation. Whether estimated by PD or BIN, we did not find significant changes in parasitoid diversity across latitude (A and B). Parasitoid diversity did not significantly change with mean annual temperature (C and D) or total annual precipitation (E and F). Parasitoid diversity measured using PD was significantly related to diversity measured using BINs (G).
Diversity vs. latitude
Faith’s PD and BIN diversity showed no significant relationship with latitude (R2 = 0.267, F = 2.19, p > 0.05; R2 = 0.0002, F = 0.0011, p > 0.05) (Figs. 2A, 2B).
Diversity vs. environmental variables
Both BIN and PD diversity declined with mean annual temperature (R2 = 0.335, F = 2.27, p > 0.05; R2 = 0.006, F = 1.05, p > 0.05) (Figs. 2C, 2D). However, when we controlled for the extremely large sample size at the most northerly sampled location (either by using the residuals of the relationship between sample size and diversity or by using a randomly selected subset of the data (Supplementary Materials 8–10)), there was no significant relationship between either diversity measure and mean annual temperature (R2 = −0.165, F = 0.01, p > 0.05; R2 = −0.053, F = 0.65, p > 0.05).
Diversity appeared to decline with total annual precipitation using the full data set (though the apparent decline was not significant) (R2 = −0.035, F = 0.76, p > 0.05; R2 = −0.146, F = 0.111, p > 0.05). Indeed, when we controlled for sample size, the relationship became slightly positive (Supplementary Materials 8–10).
Discussion
We calculated DNA-derived diversity from publicly available sequences as a means to avoid the taxonomic impediment present within the Parasitica, in an effort to examine macroecological patterns of latitude/diversity for parasitoid wasps (Willig 2001; Willig et al. 2003; Jones et al. 2009; Santos and Quicke 2011). We found that whether diversity was estimated using molecular operational taxonomic units (BINs) or phylogenetic estimates of diversity (PD), there was no significant peak in diversity across latitude. One potential explanation for this is that the rates of under-description outlined by Quicke (2012) are high not only in the tropics but also across latitude. If this were the case, we should expect that estimating latitudinal patterns of diversity within parasitoids would require a massive influx of new samples and sites. Adding new sites or localities that are immediately connected to standardized molecular diversity estimates (such as the School Malaise Trap Program described by Steinke et al. 2017) would likely provide a formidable addition to such a strategy.
Latitudinal trends in diversity for parasitoids have previously shown multiple patterns including declines in diversity with latitude (Hespenheide 1979; Noyes 1989a; Gaston and Gauld 1993; Gaston 2000), mid-latitude peaks (Owen and Owen 1974; Janzen and Pond 1975; Janzen 1981; Quicke and Kruft 1995; Skillen et al. 2000), and the absence of any cline (Veijalainen et al. 2012). Our estimates of these macroecological patterns used publicly available records to create DNA-based diversity estimates based upon specimens collected using standardized methods. To our knowledge, this is the first work to enumerate different DNA-based measures of parasitoid diversity across this geographic scale. Although our geographic sampling was broad (more than 50° latitude), our individually based DNA estimates may still have been affected by the small sample size. However, the effect of under-sampling could decrease as the size of DNA-based libraries associated with high-quality metadata increases. Thus, as libraries continue to grow, this type of investigation will be one that warrants replication. As pointed out by Stahlhut et al. (2013, p. 4), it is our hope that specimens from our study, “receive more attention from specialists in the future, and the availability of DNA barcodes will make it easier for taxonomists to delimit and perhaps even describe species in this collection via integrative methods”.
Biotic factors
BIN diversity was not correlated with any measured environmental variable. One potential explanation for this trend is that variables such as competition, predation, or resource availability may play a larger role in determining how many parasitoid species are able to persist in certain locations than the abiotic factors alone (Timms et al. 2016). Interestingly, the lack of a diversity cline across latitude was similar to the results of Veijalainen et al. (2012), who found that species diversity of Neotropical Orthocentrinae (177) was roughly similar to the known species found in Nearctic regions (151). As we do here, they speculated that increased sampling would yield a greater number of species in each region. Indeed, the problem of under-sampling is not uncommon to studies of terrestrial arthropod diversity or parasitoids in particular.
Abiotic factors
Due to their effects on insect physiology and productivity, temperature and precipitation are abiotic factors expected to limit diversity (Srivastava and Lawton 1998). For example, Shapiro and Pickering (2000) found that moisture availability (rainfall) was a key factor in understanding parasitoid activity. In particular, the activity and community structure of the Ichneumonidae were restricted by hot, dry conditions. Indeed, support for hymenopteran diversity gradients being driven by climatic seasonality, and in particular precipitation, is persistent in the literature (Abrahamczyk et al. 2010, 2011; Archibald et al. 2010). However, Brown (2014) emphasized that species diversity increased with temperature much more rapidly than with species abundance or net primary production, and that kinetics may be the most important factor in accounting for diversity gradients (Brown 2014). The role that time plays in entrenching (or reversing) such abiotic selective pressures is critical (and difficult to test) (i.e., moving from the ecological observation that activity is restricted by climatic seasonality to concluding evolutionary patterns across degrees of latitude requires that such seasonality is not recent).
Therefore, with the assumption that latitude is a surrogate for temperature and precipitation gradients, we predicted an inverse relationship between parasitoid diversity (BINs and PD) and latitude. As expected, estimates of PD increased linearly with BINs for all the sequences available from the sampling sites. However, neither diversity measure varied significantly across latitude mean annual temperature or total annual precipitation. We found neither the more commonly reported negative relationship nor any anomalous mid-latitude peak. For example, within the Ontario, Canada, sites we included in this analysis, there were large, evident changes in diversity not predicted by latitude or the co-varying abiotic factors (Fig. 2). We note that sampling intensity across latitude clearly remains an issue that might impede our understanding of macroecological patterns within the Parasitica. In fact, in the large data set, we found that diversity appeared to actually increase (albeit non-significantly) with latitude. This pattern was no longer apparent when we controlled for the sampling intensity by removing the expected relationship between diversity and sample size. A similar observation of an unexpectedly high diversity hotspot at high(er) latitudes was noted by Fernandez-Triana et al. (2016) when they reported that Ottawa (Ontario, Canada) was a hotspot of parasitoid diversity. They concluded that this “hotspot” was because of the sampling intensity related to both habitat heterogeneity and the “relatively comprehensive taxonomic studies” completed by the eminent parasitoid taxonomists living in Ottawa while working at the Canadian National Collection of Insects, Arachnids, and Nematodes (CNC) (Fernandez-Triana et al. 2016, p. 7).
Advantages for using public DNA records to assess diversity
The use of operational taxonomic units (BINs) has been shown to be a rapid and effective method for species identification for many hymenopteran communities (Smith et al. 2005, 2008, 2011; Quicke et al. 2012; Veijalainen et al. 2012; Stahlhut et al. 2013). Although BINs are not necessarily coincident with species boundaries, they display similar patterns in richness and turnover that can be helpful in short-term studies (Smith et al. 2005, 2017) and in examining diversity patterns for species within the taxonomic impediment (Smith et al. 2006, 2007, 2008). Thus, our estimates of diversity are likely more sensitive to the existence of morphologically cryptic species than others based on classically named diversity. However, like most other examinations of parasitoid diversity, our sampling is unlikely to be a complete representation of the total parasitoid diversity present at any one of the sites used here (Smith et al. 2008; Stahlhut et al. 2013).
Ultimately, due to the frequent occurrence of cryptic, and undescribed, species in the parasitic Hymenoptera, integrating studies and data sets that incorporate DNA barcode data to help delineate species allows us to make stronger tests for latitudinal diversity gradients. The increasing number of publicly available and georeferenced DNA barcode sequences available on BOLD (Ratnasingham and Hebert 2007) will only strengthen this tool. Gratton et al. (2017) recently tested the use of georeferenced GenBank vertebrate sequence data to construct robust phylogeographic hypotheses and concluded that one of the principal limitations of data on GenBank was the small proportion that was georeferenced (6.2% in their analysis). Another recent example of testing large macroecological patterns in genetic diversity across space was recently presented by Miraldo et al. (2016) who used a subset of georeferenced DNA sequence records from GenBank and BOLD to test latitudinal patterns of genetic diversity for amphibians and mammals. Although an interesting preliminary analysis, their study did not control for any sort of collection strategy or method. Such a control would not be easily possible in GenBank; however, the greater standards in metadata on BOLD do permit such specific specimen selection.
Conclusions
Although parasitoid insects were once considered a textbook example of anomalous diversity/latitudes gradients, it is increasingly accepted that more research is required to validate such a hypothesis (Willig 2001; Willig et al. 2003; Jones et al. 2009; Veijalainen et al. 2012). In particular, deviations from expected changes in diversity with latitude are required due to species under-representation across latitudes (Santos and Quicke 2011). Our work supports this conclusion and represents a useful scaffold for future research to investigate macroecological trends through the use of publicly available and georeferenced DNA sequences. The public availability of specimens and sequence records in BOLD permits the transparent comparison of our work and future examinations to include all details analysed here in subsequent work. Although including wide latitude and many specimens, our results do not identify any clear significant pattern of parasitoid diversity across latitude. Further tropical sampling is clearly needed. However, it should be noted that the accumulation of parasitoid diversity did not reach an asymptote in any of our latitudinal sites. Indeed, in considering this under-sampling, Rodriguez et al. (2013) noted that to describe and understand all parasitoid species in any environment would require a massive deployment of comprehensive trapping at least an order of magnitude greater than has been attempted to date. Clearly, our understanding of the relationship between parasitoid diversity and latitude will benefit from further and novel field collections using standardized methods designed for comparison between sites. Furthermore, the use of DNA-based diversity estimates will help to ameliorate the taxonomic impediment that extends from the tropics to the tundra.
Acknowledgements
We would like to thank the anonymous reviewers and the editor Peter Kevan whose comments improved earlier drafts of this product. We are grateful for the financial support of Discovery Grants from the Natural Sciences and Engineering Research Council of Canada (NSERC), the Leaders Opportunity Fund (LOF) from the Canada Foundation for Innovation (CFI), and an Early Researcher Award (ERA) from the Ontario Ministry of Research and Innovation (OMRI) to MAS. Laboratory analyses of the COI sequences generated between 2008 and 2011 were subsidized by the Government of Canada through Genome Canada and the Ontario Genomics Institute (2008-0GI-ICI-03). Churchill—We would like to thank LeeAnn Fishback and all the staff at the Churchill Northern Studies Centre (CNSC) for logistical support in Churchill. Fieldwork in Churchill was made possible by grants from the Northern Scientific Training Program (Canadian Polar Commission) and the Northern Research Fund from the CNSC to MAS and TE. Public Churchill specimens collected prior to 2012 dependent on support provided by NSERC’s International Polar Year. Algonquin/Ontario—Thanks to Ontario Parks, the Ontario Ministry of Natural Resources, and the Wildlife Research Station for permission to collect in Algonquin Park and logistical assistance. Thanks to the Shaw Woods Outdoor Education Centre, David and Ann Judd, Clark Smith, and Elaine Bazinet-Smith for permissions to collect on private lands in Ontario. Belize—Thanks to Brock Fenton and the staff of the Lamanai Field Research Center and the Belize Forest Department & Belize Department of Archaeology for assistance with permits and logistics in Belize. French Guiana—Thanks to the Nouragues Research Grant by the Centre national de la recherche scientifique (CNRS) for enabling collections and facilitating our stay in French Guiana. BioBus—The publicly available specimens and sequences used on BOLD were specimens collected by the BioBus program, and their collection was dependent on the support of Parks Canada (NAP-2008-1636) and the Florida Department of Environmental Protection Division of Recreation and Parks (permit numbers 03031010 and 04211110).
References
Abrahamczyk S, Steudel B, and Kessler M. 2010. Sampling Hymenoptera along a precipitation gradient in tropical forests: the effectiveness of different coloured pan traps. Entomologia Experimentalis et Applicata, 137: 262–268.
Abrahamczyk S, Gottleuber P, Matauschek C, and Kessler M. 2011. Diversity and community composition of euglossine bee assemblages (Hymenoptera: Apidae) in western Amazonia. Biodiversity and Conservation, 20: 2981–3001.
Abrahamczyk S, de Vos JM, Sedivy C, Gottleuber P, and Kessler M. 2014. A humped latitudinal phylogenetic diversity pattern of orchid bees (Hymenoptera: Apidae: Euglossini) in western Amazonia: assessing the influence of climate and geologic history. Ecography, 37: 500–508.
Baselga A, Lobo JM, Hortal J, Jiménez-Valverde A, and Gómez JF. 2010. Assessing alpha and beta taxonomy in eupelmid wasps: determinants of the probability of describing good species and synonyms. Journal of Zoological Systematics and Evolutionary Research, 48: 40–49.
Blaxter M, Mann J, Chapman T, Thomas F, Whitton C, Floyd R, et al. 2005. Defining operational taxonomic units using DNA barcode data. Philosophical Transactions of the Royal Society B: Biological Sciences, 360: 1935–1943.
Cleveland WS, and Loader CL. 1996. Smoothing by local regression: principles and methods. In Statistical theory and computational aspects of smoothing. Edited by W Haerdle and MG Schimek. Springer, New York, New York. pp. 10–49.
Faith DP. 1994. Biodiversity: measurement and estimation—phylogenetic pattern and the quantification of organismal biodiversity. Philosophical Transactions of the Royal Society B: Biological Sciences, 345: 45–58.
Faith DP, and Baker AM. 2006. Phylogenetic diversity (PD) and biodiversity conservation: some bioinformatics challenges. Evolutionary Bioinformatics Online, 2: 121–128 [online]: Available from nsights.sagepub.com/article.php?article_id=148.
Fernandez-Triana J, Smith MA, Boudreault C, Goulet H, Hebert PDN, Smith AC, et al. 2011. A poorly known high-latitude parasitoid wasp community: unexpected diversity and dramatic changes through time. PLoS ONE, 6: e23719.
Fernandez-Triana J, Boudreault C, Buffam J, and Maclean R. 2016. A biodiversity hotspot for Microgastrinae (Hymenoptera, Braconidae) in North America: annotated species checklist for Ottawa, Canada. ZooKeys, 633: 1–93.
Gaston KJ, and Gauld ID. 1993. How many species of pimplines (Hymenoptera: Ichneumonidae) are there in Costa Rica? Journal of Tropical Ecology, 9: 491–499.
Gaston KJ, and Williams PH. 1996. Spatial patterns in taxonomic diversity. In Biodiversity: a biology of numbers and difference. Edited by KJ Gaston. Blackwell Science, Oxford, UK. pp. 202–229.
Gratton P, Marta S, Bocksberger G, Winter M, Trucchi E, and Kühl H. 2017. A world of sequences: can we use georeferenced nucleotide databases for a robust automated phylogeography? Journal of Biogeography, 44: 475–486.
Hansson C, Smith MA, Janzen DH, and Hallwachs W. 2015. Integrative taxonomy of New World Euplectrus Westwood (Hymenoptera, Eulophidae), with focus on 55 new species from Area de Conservación Guanacaste, northwestern Costa Rica. ZooKeys, 485: 1–236.
Hardy OJ, and Senterre B. 2007. Characterizing the phylogenetic structure of communities by an additive partitioning of phylogenetic diversity. Journal of Ecology, 95: 493–506.
Hijmans RJ, Cameron SE, Parra JL, Jones PG, and Jarvis A. 2005. Very high resolution interpolated climate surfaces for global land areas. International Journal of Climatology, 25: 1965–1978.
Janzen DH, and Pond CM. 1975. A comparison, by sweep sampling, of the arthropod fauna of secondary vegetation in Michigan, England and Costa Rica. Ecological Entomology, 127: 33–50.
Jones OR, Purvis A, Baumgart E, and Quicke DLJ. 2009. Using taxonomic revision data to estimate the geographic and taxonomic distribution of undescribed species richness in the Braconidae (Hymenoptera: Ichneumonoidea). Insect Conservation and Diversity, 2: 204–212.
Kouki J, Niemelä P, and Viitasaari M. 1994. Reversed latitudinal gradient in species richness of sawflies (Hymenoptera, Symphyta). Annales Zoologici Fennici, 31: 83–88.
Kress WJ, García-Robledo C, Uriarte M, and Erickson DL. 2015. DNA barcodes for ecology, evolution, and conservation. Trends in Ecology & Evolution, 30: 25–35.
Lasalle J, and Gauld ID. 1993. Hymenoptera: their biodiversity, and their impact on the diversity of other organisms. In Hymenoptera and biodiversity. Edited by J LaSalle and ID Gauld. CAB International, Wallingford, UK. pp. 1–26.
Lovejoy T, Brouillet L, Doolittle W, Gonzalez A, Green D, Hall P, et al. 2010. Canadian taxonomy: exploring biodiversity, creating opportunity. Report of the the Expert Panel on Biodiversity Science. Council of Canadian Academies, Ottawa, Ontario.
Mateo RG, Broennimann O, Normand S, Petitpierre B, Araújo MB, Svenning J-C, et al. 2016. The mossy north: an inverse latitudinal diversity gradient in European bryophytes. Scientific Reports, 6: 25546.
Miraldo A, Li S, Borregaard MK, Flórez-Rodríguez A, Gopalakrishnan S, Rizvanovic M, et al. 2016. An Anthropocene map of genetic diversity. Science, 353: 1532–1535.
Mittelbach GG, Schemske DW, Cornell HV, Allen AP, Brown JM, Bush MB, et al. 2007. Evolution and the latitudinal diversity gradient: speciation, extinction and biogeography. Ecology Letters, 10: 315–331.
Noyes JS. 1989b. A study of five methods of sampling Hymenoptera (Insecta) in a tropical rainforest, with special reference to the Parasitica. Journal of Natural History, 23: 285–298.
Quicke DLJ. 2012. We know too little about parasitoid wasp distributions to draw any conclusions about latitudinal trends in species richness, body size and biology. PLoS ONE, 7: e32101.
Quicke DLJ, and Kruft RA. 1995. Species of Yelicones (Hymenoptera: Braconidae: Rogadinae) in North America with descriptions of two new species. Annals of the Entomological Society of America, 88: 129–138.
Quicke DLJ, Smith MA, Janzen DH, Hallwachs W, Fernandez-Triana J, Laurenne NM, et al. 2012. Utility of the DNA barcoding gene fragment for parasitic wasp phylogeny (Hymenoptera: Ichneumonoidea): data release and new measure of taxonomic congruence. Molecular Ecology Resources, 12: 676–685.
R Core Team. 2016. R: a language and environment for statistical computing. R Foundation for Statistical Computing, Vienna, Austria [online]: Available from R-project.org/.
Rabinowitz BJ, and Price PW. 1976. Anomalous diversity of tropical Icterinae parasitoids: a predation hypothesis. The American Naturalist, 110: 889–893.
Rodriguez JJ, Fernández-Triana JL, Smith MA, Janzen DH, Hallwachs W, Erwin TL, et al. 2013. Extrapolations from field studies and known faunas converge on dramatically increased estimates of global microgastrine parasitoid wasp species richness (Hymenoptera: Braconidae). Insect Conservation and Diversity, 6: 530–536.
Shapiro BA, and Pickering J. 2000. Rainfall and parasitic wasp (Hymenoptera: Ichneumonoidea) activity in successional forest stages at Barro Colorado Nature Monument, Panama, and La Selva Biological Station, Costa Rica. Agricultural and Forest Entomology, 2: 39–47.
Skillen EL, Pickering J, and Sharkey MJ. 2000. Species richness of the Campopleginae and Ichneumoninae (Hymenoptera: Ichneumonidae) along a latitudinal gradient in eastern North American old-growth forests. Environmental Entomology, 29: 460–466.
Smith MA. 2012. Species barcoding. In The encyclopedia of sustainability: vol. 6. Measurements, indicators, and research methods for sustainability. Edited by D Fogel, S Fredericks, L Harrington, and I Spellerberg. Berkshire Publishing, Great Barrington, Massachusetts. pp. 326–328.
Smith MA, Fisher BL, and Hebert PDN. 2005. DNA barcoding for effective biodiversity assessment of a hyperdiverse arthropod group: the ants of Madagascar. Philosophical Transactions of the Royal Society B: Biological Sciences, 360: 1825–1834.
Smith MA, Woodley NE, Janzen DH, Hallwachs W, and Hebert PDN. 2006. DNA barcodes reveal cryptic host-specificity within the presumed polyphagous members of a genus of parasitoid flies (Diptera: Tachinidae). Proceedings of the National Academy of Sciences of the United States of America, 103: 3657–3662.
Smith MA, Wood DM, Janzen DH, Hallwachs W, and Hebert PDN. 2007. DNA barcodes affirm that 16 species of apparently generalist tropical parasitoid flies (Diptera, Tachinidae) are not all generalists. Proceedings of the National Academy of Sciences of the United States of America, 104: 4967–4972.
Smith MA, Rodriguez JJ, Whitfield JB, Deans AR, Janzen DH, Hallwachs W, et al. 2008. Extreme diversity of tropical parasitoid wasps exposed by iterative integration of natural history, DNA barcoding, morphology, and collections. Proceedings of the National Academy of Sciences of the United States of America, 105: 12359–12364.
Smith MA, Fernandez-Triana J, Roughley R, and Hebert PDN. 2009. DNA barcode accumulation curves for understudied taxa and areas. Molecular Ecology Resources, 9: 208–216.
Smith MA, Eveleigh ES, McCann KS, Merilo MT, McCarthy PC, and Van Rooyen KI. 2011. Barcoding a quantified food web: crypsis, concepts, ecology and hypotheses. PLoS ONE, 6: e14424.
Smith MA, Hallwachs W, and Janzen DH. 2014. Diversity and phylogenetic community structure of ants along a Costa Rican elevational gradient. Ecography, 37: 720–731.
Smith MA, Boyd A, Chan A, Clout S, des Brisay P, Dolson S, et al. 2017. Investigating the effect of forestry on leaf-litter arthropods (Algonquin Park, Ontario, Canada). PLoS ONE, 12(6): e0178568.
Song S-N, Tang P, Wei S-J, and Chen X-X. 2016. Comparative and phylogenetic analysis of the mitochondrial genomes in basal hymenopterans. Scientific Reports, 6: 20972.
Srivastava DS, and Lawton JH. 1998. Why more productive sites have more species: an experimental test of theory using tree-hole communities. The American Naturalist, 154: 510–529.
Stahlhut JK, Fernandez-Triana J, Adamowicz SJ, Buck M, Goulet H, Hebert PDN, et al. 2013. DNA barcoding reveals diversity of Hymenoptera and the dominance of parasitoids in a sub-arctic environment. BMC Ecology, 13: 2.
Steinke D, Breton V, Berzitis E, and Hebert PDN. 2017. The School Malaise Trap Program: coupling educational outreach with scientific discovery. PLoS Biology, 15: e2001829.
Swenson NG, Erickson DL, Mi X, Bourg NA, Forero-Montaña J, Ge X, et al. 2012. Phylogenetic and functional alpha and beta diversity in temperate and tropical tree communities. Ecology, 93: S112–S125.
Tamura K, Stecher G, Peterson D, Filipski A, and Kumar S. 2013. MEGA6: Molecular Evolutionary Genetics Analysis version 6.0. Molecular Biology and Evolution, 30: 2725–2729.
Timms LL, Schwarzfeld M, and Sääksjärvi IE. 2016. Extending understanding of latitudinal patterns in parasitoid wasp diversity. Insect Conservation and Diversity, 9: 74–86.
Veijalainen A, Wahlberg N, Broad GR, Erwin TL, Longino JT, and Sääksjärvi IE. 2012. Unprecedented ichneumonid parasitoid wasp diversity in tropical forests. Proceedings of the Royal Society B: Biological Sciences, 279: 4694–4698.
The authors have declared that no competing interests exist.
Metrics & Citations
Metrics
Other Metrics
Citations
Cite As
Thanushi Eagalle and M. Alex Smith. 2017. Diversity of parasitoid and parasitic wasps across a latitudinal gradient: Using public DNA records to work within a taxonomic impediment. FACETS.
2: 937-954.
https://doi.org/10.1139/facets-2016-0061
Export Citations
If you have the appropriate software installed, you can download article citation data to the citation manager of your choice. Simply select your manager software from the list below and click Download.
Cited by
1. Variation in a Darwin Wasp (Hymenoptera: Ichneumonidae) Community along an Elevation Gradient in a Tropical Biodiversity Hotspot: Implications for Ecology and Conservation
2. The relationship between host plant traits and biodiversity across three sympatric seed‐feeding tri‐trophic systems in a tropical region of Brazil
3. Afrotropical Ceraphronoidea (Insecta: Hymenoptera) put back on the map with the description of 88 new species
4. Global biogeography of ant social parasites: Exploring patterns and mechanisms of an inverse latitudinal diversity gradient
5. Phylogenetic signal of sub‐arctic beetle communities
6. Latitudinal patterns in tachinid parasitoid diversity (Diptera: Tachinidae): a review of the evidence
7. Quantifying the unquantifiable: why Hymenoptera, not Coleoptera, is the most speciose animal order
8. Agroecological Pest Management in the City: Experiences from California and Chiapas
9. Variation in the diversity and richness of parasitoid wasps based on sampling effort