DIY meteorology: Use of citizen science to monitor snow dynamics in a data-sparse city

Publication: FACETS
26 September 2017

Abstract

Cities are under pressure to operate their services effectively and project costs of operations across various timeframes. In high-latitude and high-altitude urban centers, snow management is one of the larger unknowns and has both operational and budgetary limitations. Snowfall and snow depth observations within urban environments are important to plan snow clearing and prepare for the effects of spring runoff on cities’ drainage systems. In-house research functions are expensive, but one way to overcome that expense and still produce effective data is through citizen science. In this paper, we examine the potential to use citizen science for snowfall data collection in urban environments. A group of volunteers measured daily snowfall and snow depth at an urban site in Saskatoon (Canada) during two winters. Reliability was assessed with a statistical consistency analysis and a comparison with other data sets collected around Saskatoon. We found that citizen-science-derived data were more reliable and relevant for many urban management stakeholders. Feedback from the participants demonstrated reflexivity about social learning and a renewed sense of community built around generating reliable and useful data. We conclude that citizen science holds great potential to improve data provision for effective and sustainable city planning and greater social learning benefits overall.

Introduction

Social learning in sustainability science

Adaptation planning for cities is urgent given anthropogenically induced climate change realities such as flooding, droughts, and changing winter storms and spring thaw (Hunt and Watkiss 2011). The current paradigm in sustainability science attempts to understand the dynamic interactions between physical and social knowledge systems. The core of this paradigm is to pay equal attention to the influence that society has on the environment and the influence that the environment has on society (Clark and Dickson 2003). In few other contexts do these interactions play out more frequently and strongly than in cities where high population densities meet resource stress and high demands for service on a day-to-day basis.
In the current state, cities depend on formal scientific inputs, the experiences of their staff and council members, and the city’s history to make decisions on their “urban metabolism” or the planning and management of operations (Kennedy et al. 2011; Kalmykova et al. 2015). Much of the focus has been on making evidence-based decisions to support the transformation to sustainable cities (Kitchin 2014); however, difficulties in providing the necessary evidence have been noted (Corfee-Morlot et al. 2011). Chief among these hurdles is the need to identify local urban vulnerabilities and institute proactive monitoring programs that provide timely and effective responses (Hallegatte and Corfee-Morlot 2011). From an urban management point of view, there is an urgent need to extend the policy focus beyond experts when it comes to contributing to the urban sustainability agenda (Franklin et al. 2011). Residents—experts and laypersons alike—can develop skills and knowledge to contribute directly to this agenda, particularly when they are committed to a group endeavor (Wenger 1998).
Understanding research skill development and knowledge generation as products of social learning (Bandura 1977; Crain 2016) is, therefore, an important aspect of creating sustainable communities (Franklin et al. 2011). Social learning through citizen science occurs at various scales and contributes, at the individual scale, to data collection, analysis, and skill development; and, at the wider scale, to broader climate change adaptation planning (Yuen et al. 2013), enhanced engagement of citizens (Jordan et al. 2012), and leveraging of underused knowledge sources including local and traditional knowledge (Bonney et al. 2014).
Different types of citizen science have been defined theoretically and empirically (e.g., Irwin 1995; Wiggins and Crowston 2011). Citizen science studies are broadly grouped into three main types that are related to (1) data generation, (2) public engagement, and (3) knowledge generation. Citizens are typically engaged to perform data collecting and processing activities (Silvertown 2009) and sometimes to provide research tools for scientific enquiry (Devictor et al. 2010; Dickinson et al. 2010). Ideally, the citizen is not merely an agent but also a peer that provides new perspectives and feedback on physical science research (Irwin 2001). Citizen science can be used to reach out to the general public and gain their buy-in (Gura 2013). Citizen science can also be used for gaining the legitimacy of some local government actions or international mandates, e.g., studies from West Africa and the Caribbean that showed how Indigenous knowledge could be incorporated in a specific type of forest management (Leach and Fairhead 2002). Furthermore, citizen science can liberalize traditional knowledge generation processes (Buytaert et al. 2014). The change from seeing citizen scientists as learners to considering them as engaged scientists and collaborators for decision-making is difficult for urban managers and scientists alike (Cooper et al. 2007; Paulos et al. 2008). Although it has been recognized that it could be difficult for studies based on citizen science data to get through peer review, the situation appears to be improving (Gura 2013).
Citizen science efforts require organization and coordination at a variety of scales and across a variety of landscapes, ranging from local and nested neighborhoods within cities to continental scales (Cooper et al. 2007). The management of conflicting perspectives of citizen scientists and collaborators requires mutual respect and reflection (Bouillon and Gomez 2001). The success of such projects is, therefore, best evaluated not only against standards of credibility (i.e., the soundness of the data) but also against measures of legitimacy and salience (Cash et al. 2002) including the fairness and inclusiveness of the procedures with which the data were generated and the relevance of the information to decision makers or the public. To enhance legitimacy, citizen science projects in the context of sustainability should consider the different motives for participation. Collective, norm-motivated, reputational, and intrinsic motives have been reported, with collective and reputational motives positively affecting the quality of citizen science contributions (Nov et al. 2014). Finally, because citizen science projects produce data sets but do not identify mechanisms for explaining data patterns, they are still viewed as complementary to more localized hypothesis-driven research (Dickinson et al. 2010).
Volunteer observations have a long-standing history in meteorology. More recently, meteorological institutions have started to incorporate these data to improve their forecasts and operational management through cooperation with, or foundation of, volunteer networks, e.g., the Community Collaborative Rain, Hail & Snow (CoCoRaHS) network throughout North America (cocorahs.org, since 1997), the Vereniging voor Weerkunde en Klimatologie (VWK) in the Netherlands (vwkweb.nl, since 1974), or the Weather Observation Website (WOW) in the UK (wow.metoffice.gov.uk, since 2011).

Cities and snowfall

In the near future, over 60% of the global population will live in cities; organic conglomerates of people, infrastructures, and processes that are innovative, surprising, and vulnerable to catastrophe (Worldwatch Institute 2007; Batty 2012). There is increased pressure to plan and manage cities in a sustainable way (Cook and Lara 2012). One example of this in a northern context is snow management in the urban environment.
In regions that receive a large part of their annual precipitation in the form of snow, accurate measurements of snowfall and snow accumulation guide city planning and management activities such as snow clearing and flood forecasting during the spring melt. As snow deposition is highly susceptible to wind-affected redistribution and ablation (Pomeroy and Gray 1995), carefully designed observation networks are important for sustainable water management and water security. Synoptic weather stations such as those operated by Environment and Climate Change Canada (ECCC) are typically located outside of the zone of influence of urban centers, to avoid snowfall modifications resulting from the winter urban heat island effect (Perryman and Dixon 2013). Snowfall and accumulation observations in cities will, therefore, often vary from those reported in the publicly accessible database of ECCC. To date, the magnitude and importance of those differences have been poorly quantified (Mölders and Olson 2004).
Understanding the sustainability of the relationship between people and snow in the urban landscape requires the consideration of social, environmental, and economic factors (Andersson 2006). In the social sphere, snow is often disdained in cities for its negative effects on transportation and maintenance (Hansson and Norberg 2009). The collective interest in better managing snow services in the city is of note because of community buy-in; for example, in many northern and high-altitude cities around the world, snow removal is one of the most important issues to citizens (Kishi et al. 2002; Hesse 2014; Hong et al. 2015). Effective snow removal enhances a city’s ability to continue to provide emergency services and facilitate urban transportation and other amenities. Snow is not only an important source of water supply to the urban landscape but also a continuous source of uncertainty in city budgets and adaptation planning. The costs of snow and ice management alone for the City of Saskatoon reached over $13 million CAD in 2014, but due to unpredictable weather patterns, additional contingency planning was needed as the budgeted finances soon were spent. Amid changing snowfall regimes, there is, thus, a need for better monitoring and provision of scientific support to urban managers for snow services (Brown and Mote 2009; Rees et al. 2014).
This study

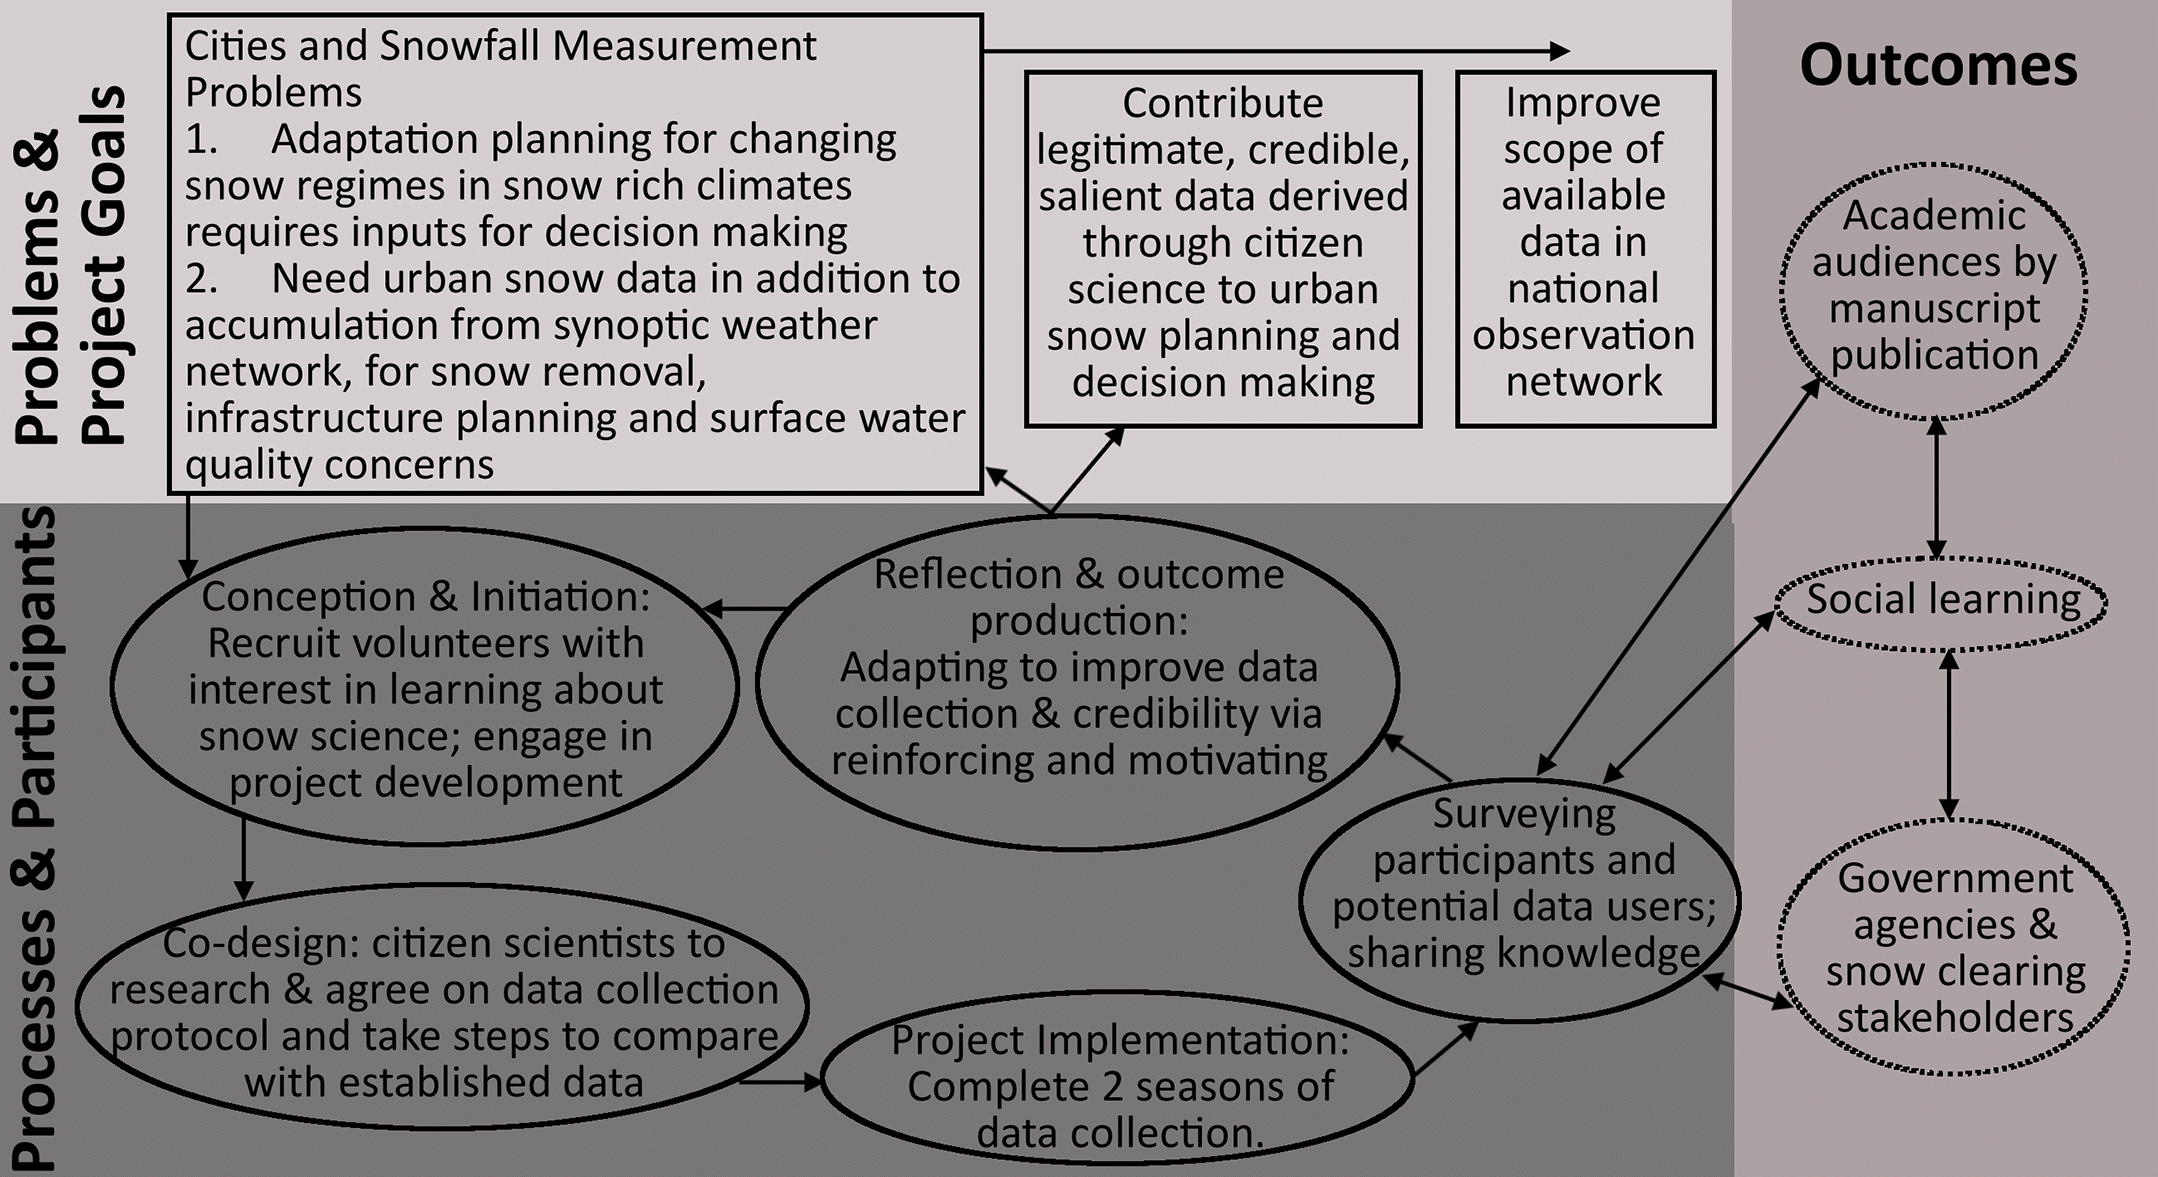
Here, we present the results of a citizen science project in which snowfall and snow accumulation were monitored in an urban setting in Saskatoon, Saskatchewan, Canada. The objective of the study was to examine the benefits of a citizen science snow data project. We aimed to collect reliable snowfall and snow accumulation data that are useful in urban water management practice (e.g., snow ploughing and spring snowmelt loading estimation for drainage systems) and, over the long term, are useful for urban adaptation planning. We compared our data with other observations in and around the city to assess its quality. In addition, by addressing the credibility, legitimacy, and salience of the project, we sought to investigate if the sustainable planning and management of urban environments could be enhanced through citizen science endeavors and the potential benefits to both urban operations management stakeholders and citizens. Figure 1 is a model diagram of the problems we addressed, the process by which they were examined, and the outcomes of the study.
Fig. 1.
Fig. 1. Process of citizen science data generation and social learning for snow measurement.

Methods

Initiation: recruiting the citizen scientists

The volunteer groups consisted of 25 (14 male, 11 female) and 25 (12 male, 13 female) participants during two subsequent winters, with 21 (2013–2014) and 19 (2014–2015) of them operating on a fixed schedule and the rest acting as substitute data collectors when required. All participants had a graduate degree in a discipline of environmental science or were in the process of obtaining one. Four participants in the first winter had non-research occupations and the others (and all participants in the second winter) were employed in a variety of administrative, laboratory, or environmental project roles. The initiative was led by four of the volunteers who built the measurement setup and coordinated the group schedule and the analysis of the data collection. The measurement of the first snowfall was performed with the entire volunteer group (75% attendance) to make sure everyone followed the same protocol. Those not present at the first snowfall measurement received instruction from their measurement partners. After this first session, two volunteers undertook the snow survey each day between 0830 and 1000. This fixed schedule prevented us from generating real-time, sub-daily data but allowed a better embedding of the activities into the schedules of our volunteers.

Co-design: on-site data collection

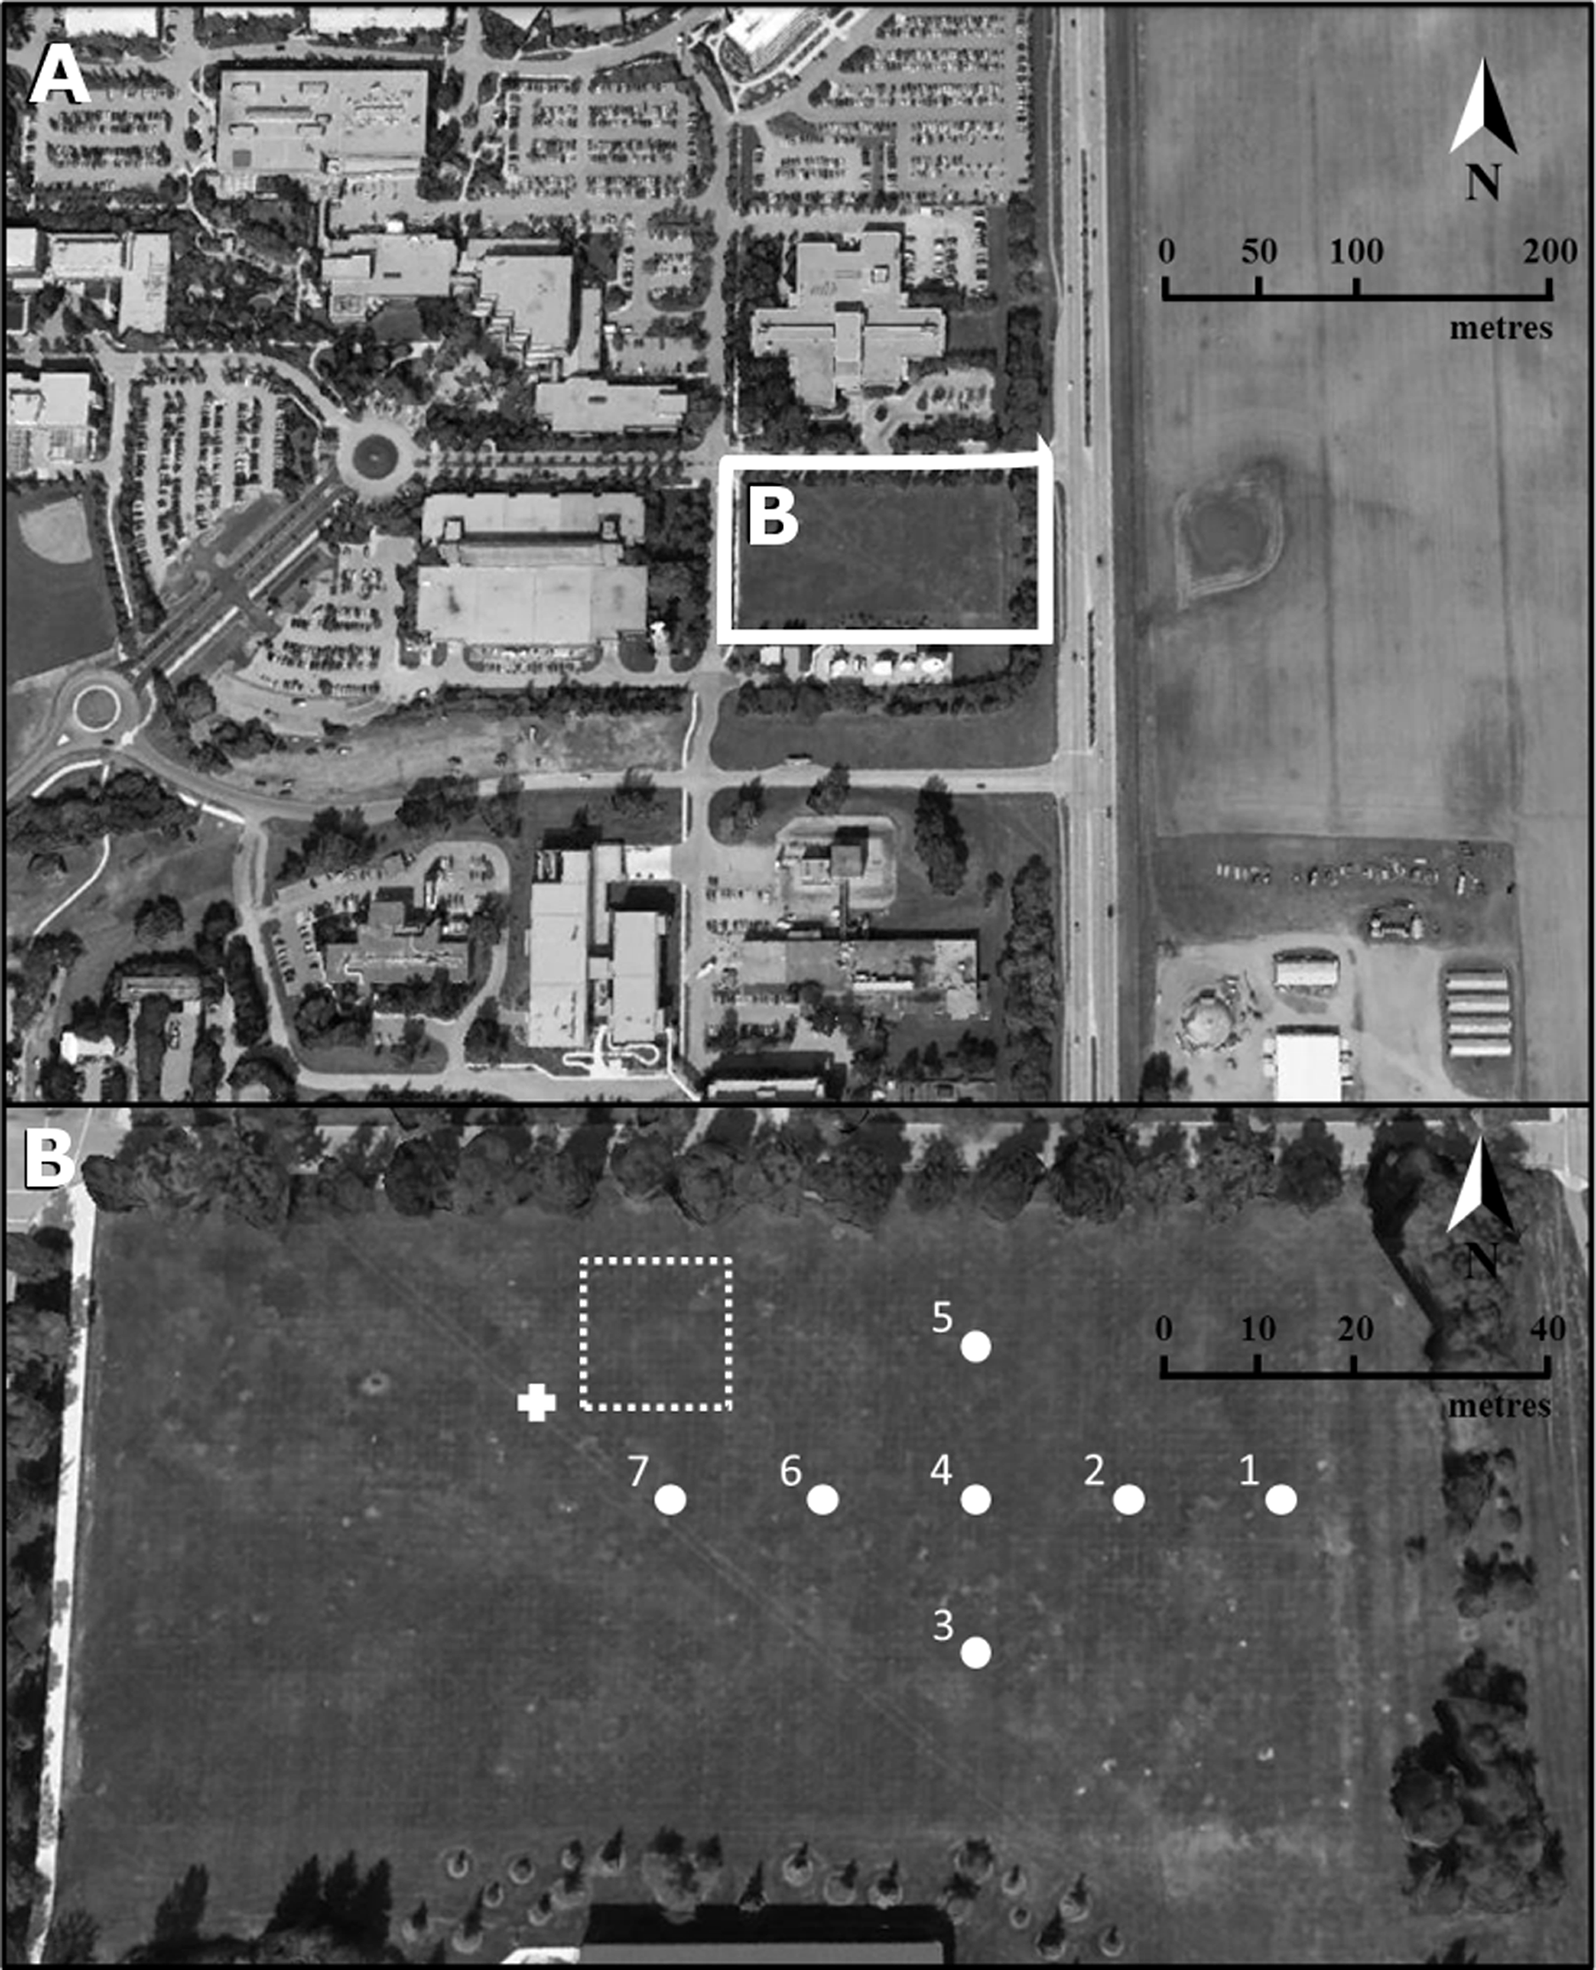
The volunteers established a study site near their place of employment, opposite to the National Hydrology Research Centre (NHRC). The study site was a 1.1 ha grass field (Fig. 2), bounded by trees and buildings on three sides and a large open field to the east beyond a row of trees and a four-lane road. The field (henceforth referred to as the “campus” site) is representative of parks and open green spaces in the city of Saskatoon. The prevailing wind is from the west.
Fig. 2.
Fig. 2. (a) Location of the field site at Innovation Place, close to the campus of the University of Saskatchewan in Saskatoon. (b) Close-up of the field site showing the positions of the snow stakes (numbered circles), snow board (plus sign), and snow core extraction site (dashed box).
Source: “Saskatoon”. 52°08′25.80″N and 106°37′25.30″W. Google Earth, 23 August 2015.
After reviewing snow measurement literature and best practices, the following design was chosen by the volunteers. Seven wooden snow stakes were installed at the site prior to the first winter’s snowfall. The stakes were arranged 15 m apart in a cross shape, designed to capture low and high spots in the field (maximum elevation difference 0.3 m). The snow depth at each snow stake was measured by determining the height of the snow surface against a fixed ruler on the stakes. We opted for fixed stakes over a portable measurement stick to prevent measurement inconsistencies among the participants. In addition, the snow depth, snow density, and the amount of water contained in the snowpack (snow water equivalent, SWE) were measured daily at one point in the field with a snow tube. The tube, a plain round aluminum pipe with centimeter markings carved on the outside, was placed in an undisturbed part of the snowpack. After measuring depth of the snowpack, the snow in the tube was packed into a Ziploc bag and its weight determined on a balance in the NHRC. We moved sequentially along a predetermined course to ensure sampling occurred in an undisturbed part of the snowpack.
Daily snowfall was measured on a wooden snowboard in the 2013–2014 winter (Gray and Male 1981) and in a Nipher-shielded (NS) gauge in the 2014–2015 winter (Gray and Male 1981). With the snowboard, we were able to measure the depth, density, and SWE of fresh snowfall. With the NS gauge, only SWE could be measured. During the 2014–2015 winter, we placed an anemometer in the field to calculate the catch efficiency of the NS gauge according to Goodison et al. (1998), as follows:
CENS=97.293.18Ws+0.5Tmax0.67Tmin/100if2<T<2
(1a)
CENS=(1000.44Ws21.98Ws)/100ifT<2
(1b)
in which CENS is the catch efficiency between the NS gauge and the double fenced international reference gauge (DFIR; Goodison et al. 1998), W s is the average wind speed during the snowfall event (m·s −1), and T max, T min, and T are, respectively, the maximum, minimum, and average temperature (°C) during the snowfall event. An event was defined as an occurrence of uninterrupted snowfall. Event duration was rounded to the nearest hour. During the day, we recorded this on our own datasheets. For night events, we relied on observations from John G. Diefenbaker airport obtained by ECCC. As temperature was not measured on campus, T max, T min, and T were also obtained from the airport. As eq. (1) determines the catch efficiency of the NS gauge with respect to a DFIR (which was not actually present on any of the sites in this study), a second correction needs to be added to calculate the catch efficiency of the DFIR with respect to the actual snowfall (Goodison et al. 1998), as follows:
CEDFIR=e(4.54+0.032Ws)/100if2<T<2
(2a)
CEDFIR=(100+1.89Ws+0.000654Ws3+0.0000654Ws5)/100ifT<2
(2b)
The actual snowfall (P act) was then determined from the measured snowfall in the gauge (P gau) as
Pact=Pgau/CENS×CEDFIR
(3)

Other data sources

We compared the volunteer data with the publicly available daily observations of precipitation and snow on the ground measured by ECCC at John G. Diefenbaker International Airport (ECCC 2015). The airport is located approximately 10 km northwest of the campus site. Precipitation at the airport is measured with an Alter-shielded (AS) Geonor weighing gauge in an open field. The catch efficiency of the AS gauge compared with a DFIR was calculated according to Smith (2007), as follows:
CEAS=e0.20Ws
(4)
Similar to the correction procedure for the NS gauge, the catch efficiency of DFIR with respect to the actual snow on the ground needs to be determined (eq. (2)) and the actual snow precipitation values (P act) are calculated from the snow precipitation in the gauge (P gau) by
Pact=Pgau/CEAS×CEDFIR
(5)
The Saskatchewan Research Council (SRC) operates a meteorological station approximately 3 km north of the campus site. Snowfall is measured with an AS Geonor weighing gauge, and snow precipitation values were corrected with the same procedure as those reported by ECCC.
Between 2013 and 2015, five to seven Saskatoon weather stations were registered with CoCoRaHS (CoCoRaHS.org). During the 2013–2014 winter, one of those stations reported snowfall and snow depth to the database (henceforth referred to as “CoCoRaHS 1”; city site located 3.5 km east of the campus site; daily observations). During the 2014–2015 winter, two stations reported observations. The second station (“CoCoRaHS 2”) was located outside of the city, 15 km southwest of the campus site (weekly observations). No details were available on how these data were obtained and a correction procedure was therefore not applied. In all data sets, trace observations were included as 0.1 mm SWE events, as per Mekis and Vincent (2011).
Finally, independent measurements of snow depth and cumulative snowfall were taken at a well-sheltered tennis court (henceforth referred to as the “control” site) at the University of Saskatchewan within 1 km distance of the campus site. On each day of sampling, three measurements were taken with a ruler and snow tube (method described in previous section). These measurements were used as a benchmark to assess the effect of snow redistribution by wind in the field. The reliability and coherence of the snow depth measurements were explored with a correlation analysis that is presented in the Supplementary Material.

Surveying participants and potential data users

After the first season of snow surveying was complete, we circulated a qualitative survey to participants. The survey asked people to discuss: (1) what they learned from participating in the snow survey, (2) their views on the data collected, (3) the training on the sampling protocol and improvements that could be made to the protocol, (4) whether they would continue sampling in the following winter, and (5) any other comments they wanted to add. In addition, phone interviews were conducted with stakeholders, including operational managers in the City of Saskatoon and the contractor who is responsible for snow removal on the University of Saskatchewan campus, to investigate their data needs. We used a general inductive approach (Thomas 2006) to examine these sets of qualitative data, and sought to characterize the skills gained, personal values reinforced, and meaning of the experience to participants (Haywood 2016).

Results

Snow dynamics—credibility

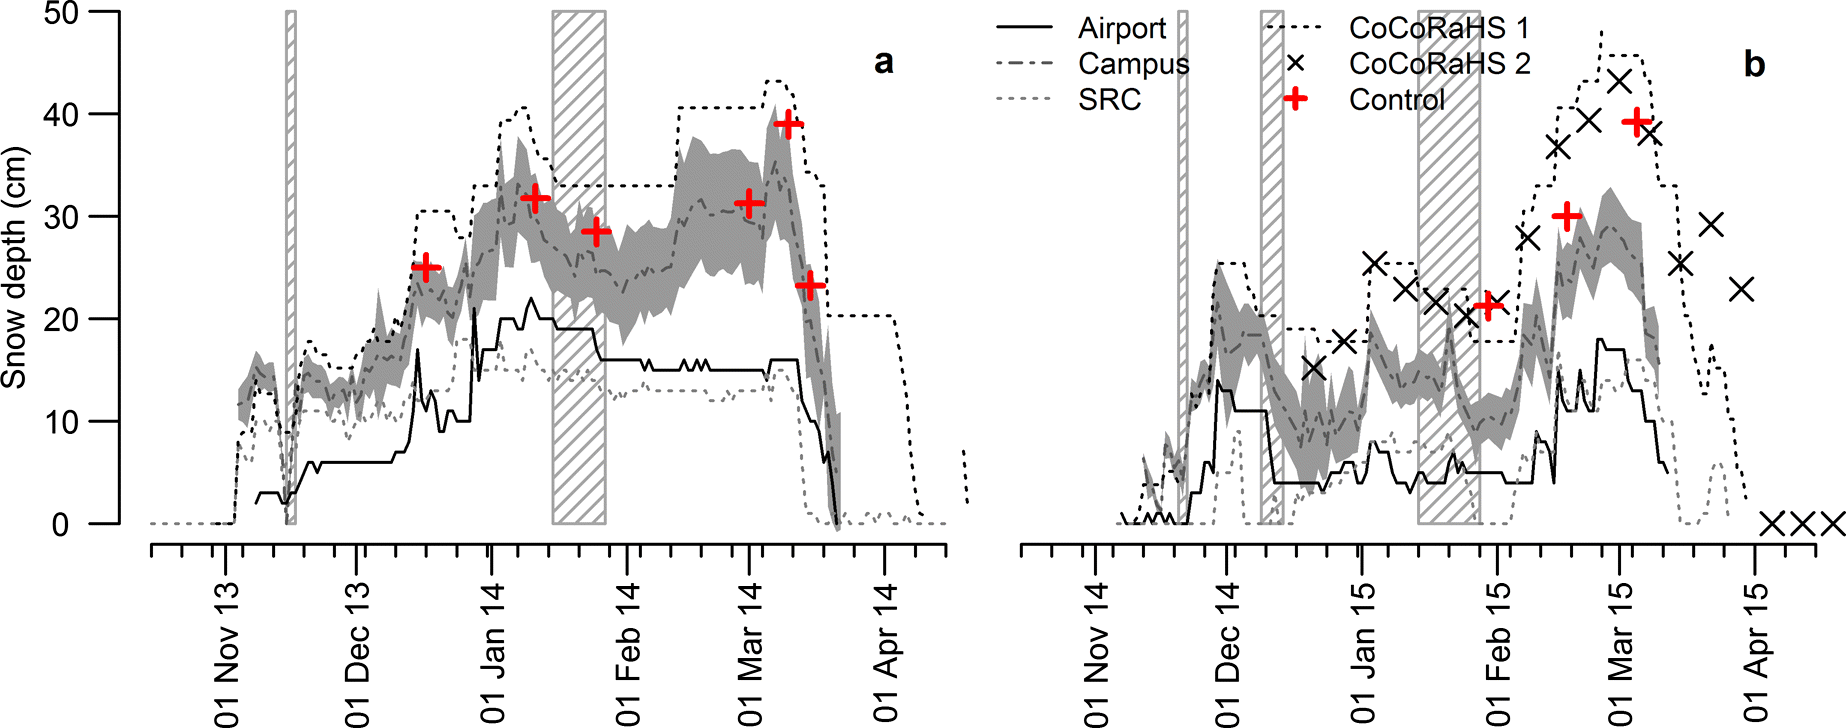
During both winters, snowfall began in mid-October with snow from the first events melting within 1–2 d. Snow started to accumulate from 4 November 2013 and 16 November 2014. The 2013–2014 winter had two melt periods (a consecutive number of days during which daytime air temperatures rose above 0 °C and melt was observed in the snow pack on the field) that affected the depth of the snow cover at all stations (Fig. 3). The 2014–2015 winter featured three melt periods during which the snow cover disappeared in parts of the field. At the control site, the melted snow was mostly retained in the snow pack as an icy layer that was observed at the bottom of the snow sample in the tube. Spring melt started on 15 March 2014 and 6 March 2015. After these dates, the snowpack in the field ablated entirely within 7 d. In 2014, snowfall events in April did not sustain a snow cover. In 2015, snowfall events in late March generated a new snow cover that lasted 3–4 d.
Fig. 3.
Fig. 3. Snow depth (accumulation during winter) measured at the airport, the seven stakes in the field (the line indicates the average value, whereas the polygon indicates ±1 standard deviation) on campus, the Saskatchewan Research Council (SRC) station, and the two Community Collaborative Rain, Hail & Snow (CoCoRaHS) stations during the 2013–2014 (a) and 2014–2015 (b) winters. Note that station CoCoRaHS 2 was only active during the 2014–2015 winter, and snow depth was only reported once a week at this site. The control points are snow depth measurements from a sheltered location on the University of Saskatchewan campus. The striped polygons indicate melt periods.
As expected, the snow depth measured at the stakes showed considerable variance, which increased with time (Fig. 3). The maximum average snowpack depth was 35 ± 4 cm measured on 7 March 2014 and 29 ± 2 cm measured on 27 February 2015. In both winters, the highest snow depths occurred in the bottom of a small undulation in the field (catch area). Low snow depths always occurred at the highest point of the field (fetch area). However, each winter featured at least one other point where little snow accumulated that could not be mapped to a clear topographical feature. Overall, the covariance of snow depth measured at the stakes was high (see Supplementary Material), suggesting that the homogeneity was high. Stronger snow depth variability may be expected in other cityscapes, e.g., alleyways, surroundings of larger buildings, or roads, due to combined effects of wind- and human-driven redistribution (Matheussen and Thorolfsson 2001). The snow depth measured at the control site fell within the range of the snow depths measured on campus in 2013–2014. In 2014–2015, the three control points were equal to or greater than the deepest snow depth measured on campus. Both CoCoRaHS stations reported deeper snow packs than measured on campus, whereas the snow depths observed at the airport and SRC station were consistently lower than at the other locations. Differences among the airport, SRC, and campus sites could be explained by the differences in how sheltered each of the sites are. The airport and SRC stations were more exposed and subject to wind redistribution during the winter. Although the campus site was also subject to wind redistribution resulting in snow depth variability, in general the wind speeds were 50% lower than those measured at the other sites (see data in the Supplementary Material). The number of days without data was higher in the volunteer campaign than in the other data sets (15 non-collection days in 2013–2014, 23 non-collection days in 2014–2015 during a 140 d period), with the exception of CoCoRaHS 2 that only had one observation per week. However, none of these days had snowfall during the preceding 24 h. Snow depth values (Fig. 3) on days without data were assumed to be the average of the preceding and subsequent days.
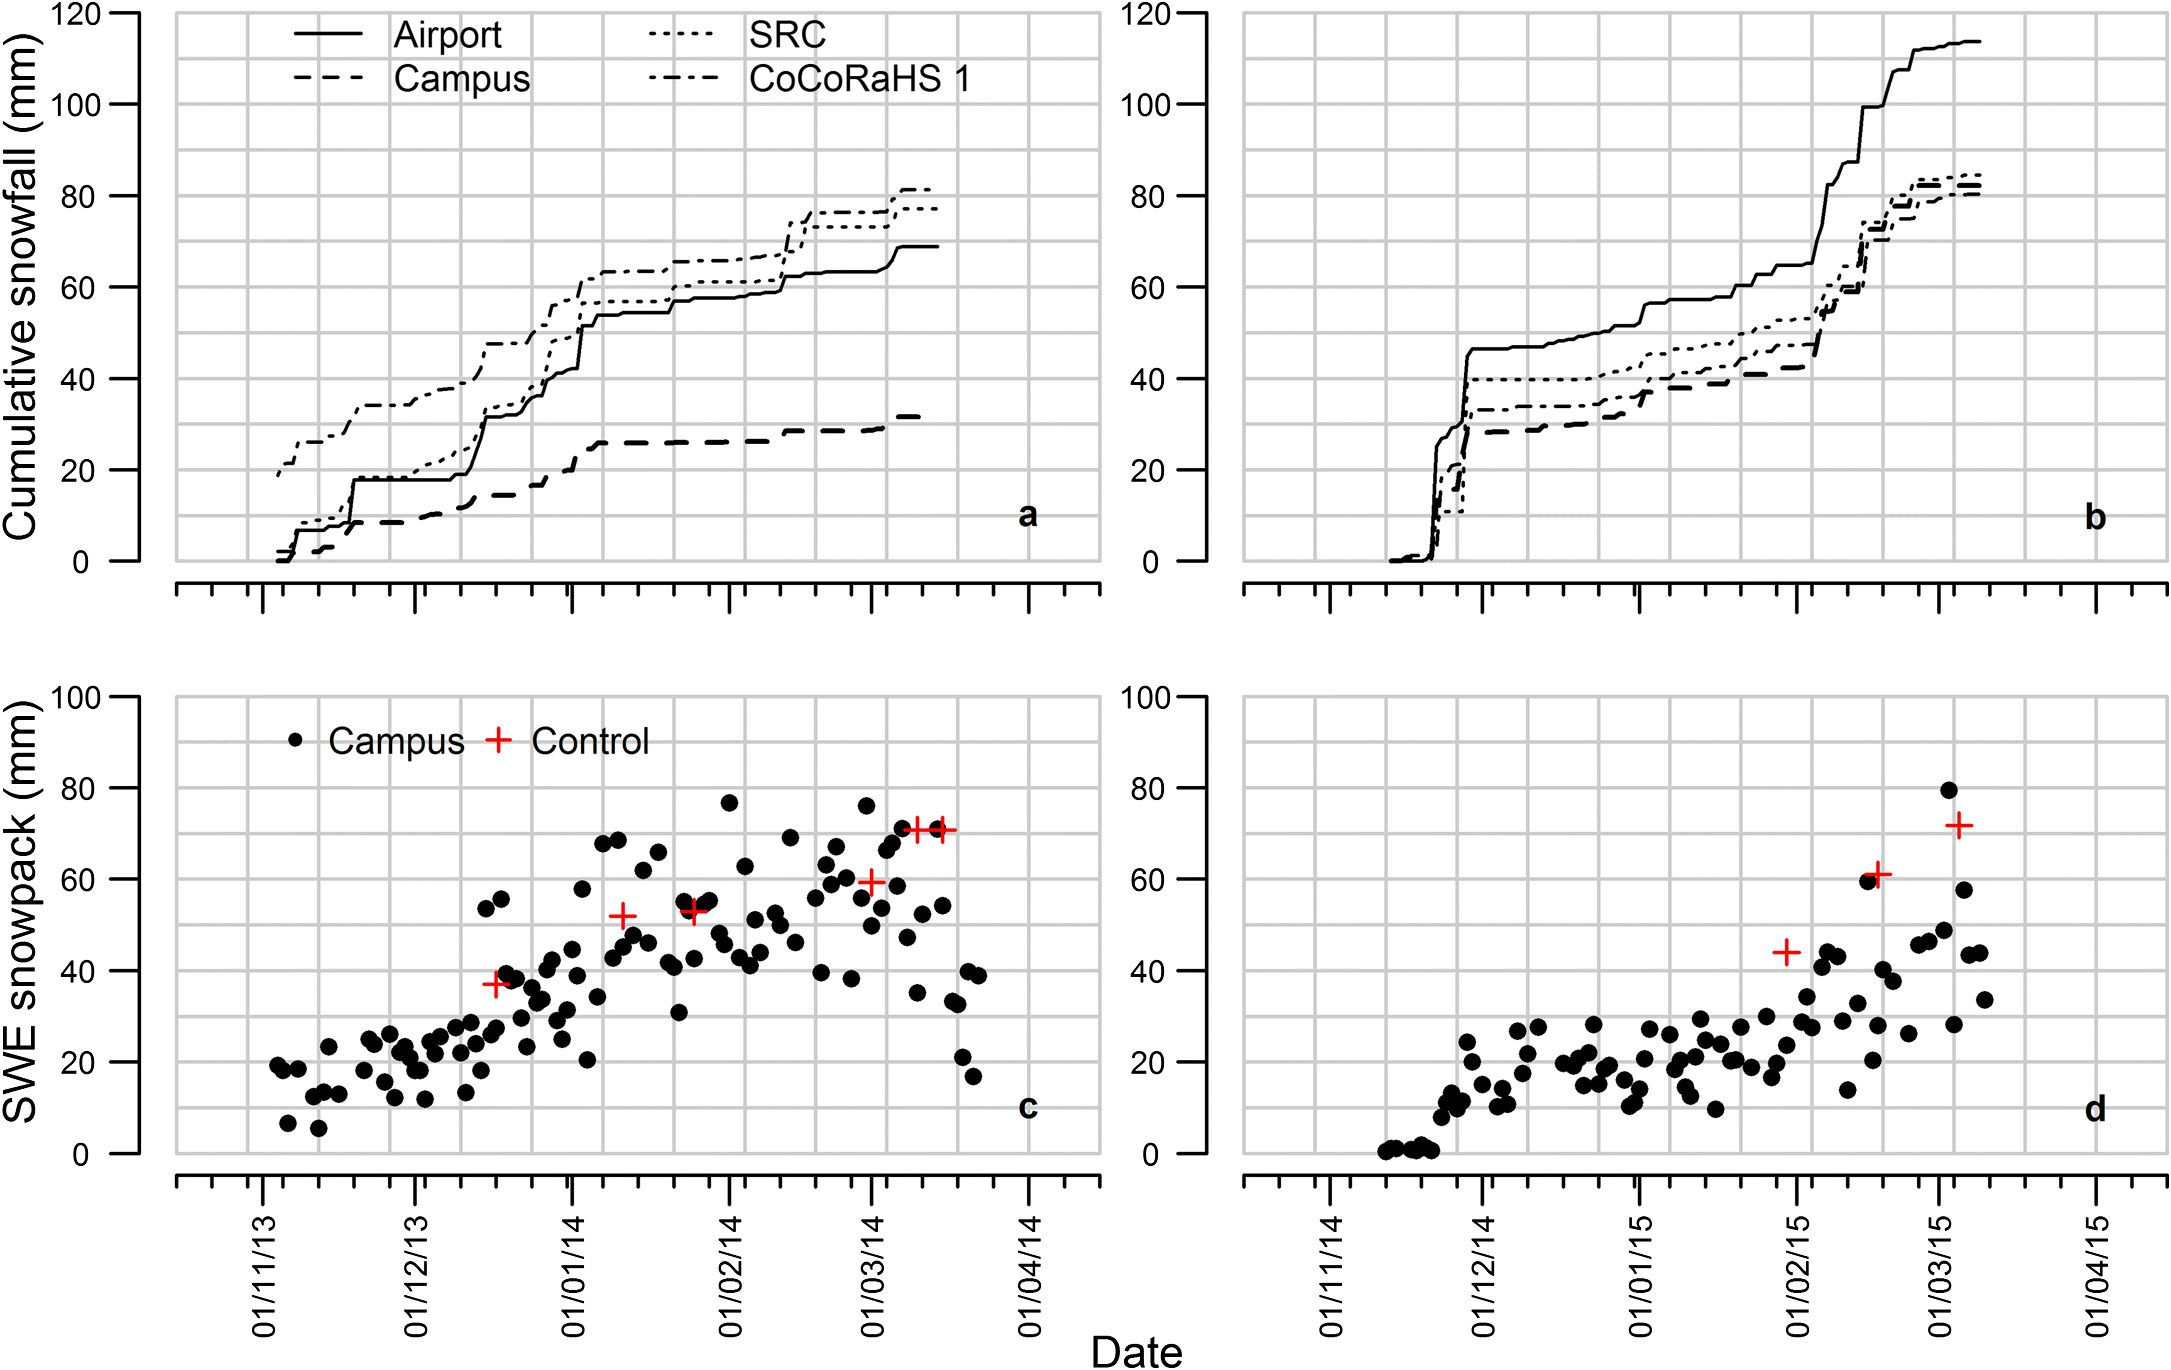
Cumulative winter snowfall, derived from the corrected daily amounts of snow and expressed in mm SWE, is presented in Figs. 4a and 4b. The snowboard measurements (campus site 2013–2014) could not be adjusted for wind-induced undercatch and reported too little snow. Snowboards need to be monitored in proximity to snow fall events. In our fixed-time measurement schedule, errors were created due to late observations. The other stations (Airport, SRC, CoCoRaHS 1) reported similar snowfall, with end-of-season cumulatives in a 10 mm range (Fig. 4a). During the 2014–2015 winter, the cumulative snowfall differences were even smaller, with the exception of the airport station which, after catch efficiency correction, overestimated cumulative seasonal snowfall by 37%. This was mainly caused by a faulty correction on three windy snowfall days. From the comparison of cumulative snowfall at the various stations, we conclude that they are generally subject to the same weather systems and that urban heat island effects are small. The location and type of gauge at the ECCC and SRC sites, however, required a more severe correction for catch efficiency than those on campus and at CoCoRaHS 1 (Table 1).
Fig. 4.
Fig. 4. Time series of cumulative snowfall in Saskatoon measured at the airport, the campus site, the Saskatchewan Research Council (SRC) station, and one Community Collaborative Rain, Hail & Snow (CoCoRaHS) station during the winters of 2013–2014 (a) and 2014–2015 (b). The second CoCoRaHS station only reported snowfall observations from 1 January 2015 and was therefore excluded from this figure. All data were corrected for catch efficiency, calculated using eqs. (1)(5), with the exception of the snowboard data (campus site, 2013–2014) for which no correction procedure exists. Panels (c) and (d) show snow water equivalent (SWE) in the snowpack on campus and at the control site.
Table 1.
Table 1. Uncorrected and corrected cumulative winter snowfall at the three stations where wind undercatch corrections had to be applied.
 AirportCampusSRC
2013–20142014–20152013–20142014–20152013–20142014–2015
Uncorrected total SWE (mm)283932774950
Corrected total SWE (mm)69114NA827784

Note: SRC, Saskatchewan Research Council; SWE, snow water equivalent.

The SWE of the snowpack in the field mirrored the steadily increasing cumulative snowfall and snow depths in 2013–2014 (Fig. 4c). By contrast, a stagnant period could be observed during the 2014–2015 winter from mid-November through January (Fig. 4d), resulting from low snowfall and melt periods. Average end-of-season SWE in the field was different in 2013–2014 and 2014–2015 (65 vs. 50 mm, respectively), whereas at the control site it was similar (71 vs. 72 mm). As mentioned previously, an icy layer was observed at the bottom of the snowpack at the control site. The control site (a concrete tennis court) had a negligible infiltration capacity. No icy layer was observed in the field, suggesting that the melt water may have infiltrated.
Variation in the timing of the observations of the various data sources poses a limitation to the extent of comparison that can be performed with the data. The snow depth data at SRC were taken at 0900 and the snow depth data on campus between 0830 and 1000, whereas observations at CoCoRaHS 1 and 2 were taken at 0700 and 0900, respectively. It is not appropriate to compare sub-daily dynamics with this range of observation timing. However, with all observations being done in the early morning, we think the dynamics at the various stations can be compared on a daily time step.

Citizen science—legitimacy

The post-season survey of the participants showed that their primary concern was to collect trustworthy data. As one participant stated,
“People have different ways of collecting the data when reading the measurement off the stakes”.
Another participant suggested that “We could do more to enhance the quality of observations” and that “We should create a protocol for measurement that enhances the consistency among the group of participants”. This also played out in the discussions on measurement techniques between the participants and employees that did not participate in the study. The choice for a NS gauge for the 2014–2015 measurement campaign was a direct result of these discussions. The confidence of the participants in the data collection subsequently grew during the study period:
“Generally, I’d be concerned about subjectivity, but it was reassuring to see reasonably consistent numbers”.
Volunteer projects like this one are typically connected in a positive feedback loop where the credibility of the results and the degree of participant engagement reinforce each other (Buytaert et al. 2014). The participant surveys echoed that
“I think it is a great exercise in showing how much information a community is capable of collecting when we all work together and give up 5 minutes of our time every couple of weeks (which I know can be hard to do)”.
And
“I was happy to see a large group of people who were willing to get behind a collaborative project, and take time out of their days, regardless of whether or not (mostly not) it was relevant to their area of study/interest”.
The project created a sense of comradery among the participants. Participants reflected on the project in terms that resonated with aspects of communities of practice, that is, activity groups in which “participants share understandings concerning what they are doing and what that means in their lives and for their communities” (Lave and Wenger 1991, p. 98). In addition, they reflected on the project as generating new perspectives on aspects of their living environment, as illustrated by this quote from a participant:
“I learned about the variation of snow depth and consistency across space and time. Sometimes I would be completely shocked at how the snow had built up overnight, or confused at how the depth could be so different across the field which I always thought was pretty flat. Some days the snow was very hard to break through, and other days, like powder. These were things that I just hadn’t thought about, despite living all my life in a place that gets a lot of snow!”
During the 2013–2014 winter, eight scheduled volunteers (out of 21) dropped out; three went on to other jobs, whereas five people simply lost interest. Their shifts were redistributed among the remaining volunteers. Of the remaining 13 volunteers, 11 continued in the 2014–2015 winter. In the second winter, fewer people dropped out; five of the 19 people on the schedule (two went on to other jobs and three lost interest). However, we struggled with keeping participant commitment during the 2014–2015 winter at the same level as the previous winter. This could in part be related to the fact that the 2014–2015 winter saw less snowfall events and a period of melt during the first months, making the measurements less motivating. It can be argued that the volunteers in this study are not representative citizens, because they are all administrative staff, students, or researchers in a research center. However, only a handful of people had actual experience with snow measurements. Most participants worked on other topics such as hydrological modeling and surface water quality issues. Although they may have had a general professional interest in data collection, the data did not benefit their projects, and no one was encouraged by their superiors to volunteer time towards this project. In addition, due to the transient nature of the workplace, there was a continuous need to recruit new volunteers. We, therefore, think that the volunteer group was not fundamentally different from other groups of people with an interest in their living environment.

Stakeholders—salience

In the unstructured telephone interviews, we found that rather than relying on forecasts, snow crews either use observations from stations outside of the city or used ad hoc approaches to estimate the impact of snowfall events:
“After we check the forecasts, we would check the forecasts in other nearby towns and then call people we know to find out what they were getting in terms of snow. It ain’t perfect, but better than the info the forecasters give. Of course we look at the weather forecasts from the Weather Network and Environment Canada (sic), but when they get it wrong we lose money, too many people at-the-ready without a major storm is problematic. We actually started measuring the snow ourselves and then comparing to how much effort we put out in storms in terms of man-hours. If we could refine this approach with better information, it would make a big difference to our bottom line. Sometimes the type of snow can have a big impact, you know the heavy stuff versus the light stuff”. (Snow Clearing Company—Director)
The City of Saskatoon relies on the airport data reported by ECCC for snow removal planning (City of Saskatoon, personal communication, 2014). From the data comparison presented in this paper, it is clear that considering only that data source may lead to an incorrectestimate. Indeed, the city has been the subject of considerable criticism over its clearing program and, due to citizen pressure, was forced to double its snow clearing budget in 2013. Accurate and timely snow forecasts would be most desirable from an optimizing perspective as these would allow for a better planning of manpower and equipment. However, the improvement of large-scale weather models is not within the scope of local government and businesses. Spatial information on snow accumulation is within scope and helpful in optimizing the short-term planning of resources. Indeed, contractors take snow depth measurements in their own home and office environments to help this process (Snow Clearing Company, personal communication, 2014). The data collected on campus were shared with the local snow removal crew in both winters. A network of measurement stakes throughout the city combined with a web or smartphone app would allow citizens to contribute to a more systematic database accessible for the city, public, and contractors.
Another context in which an accurate spatial picture of snow depth measurement is important is spring melt and its effects on infrastructure (in particular storm water systems) and surface water quality (Kuemmel 1994). Snowmelt is a main driver for increased levels of polycyclic aromatic hydrocarbons, salinity, and metals (e.g., cadmium, copper, lead, mercury, and zinc) in river and lake water in the spring compared with the rest of the year (Pham et al. 1993; Westerlund and Viklander 2006; Muthanna et al. 2007; Novotny et al. 2008). By proper handling and management of snow, snowmelt runoff pathways can be controlled and pollution of surface water bodies prevented (Reinosdotter and Viklander 2005). Current toxicology assessments of snowmelt runoff in Saskatoon and other prairie cities would benefit from accurate urban snow accumulation data such as that collected in this study (M. Hecker, personal communication, 2015). With new data examining the dynamics of snow accumulation in urban areas, improvements in the design and maintenance of infrastructure and in preventive snow removal could emerge.
Last, the numbers that we collected in the field were requested throughout both winters by ECCC meteorologists for comparison with their own observations and reporting to the public.

Discussion

Throughout the study, participants’ motivations developed from an initial sense of curiosity (and likely, peer pressure) to a collective sense of ownership. The perception of the data as reliable positively reinforced enthusiasm for participation in the activities, in turn fueling an increased concern for data quality. Participants reported increased comradery, as well as new perspectives on their daily surroundings. This echoes what has been found in other citizen science studies in urban contexts; i.e., citizens were committed to the collective interests of the project, engaged and not overstretched in their training and data analysis efforts, and committed to improving their city’s situation (Anumba et al. 2007; Davies et al. 2012).
Stakeholders involved in city planning and snow removal stated that their current snow forecast and observational data needs were not being met through conventional providers such as the Weather Network and ECCC. Being exposed and open to high wind speeds, the snow accumulation measured at John G. Diefenbaker International Airport was a great underestimation with respect to the amounts of snow that accumulated in the city. Although these stations were not designed to be representative for urban conditions, their non-accounting for accumulation in less exposed areas decreased the relevance of their generated output for large-scale hydrometeorological applications (cf. Brown and Brasnett 2011) as well as for local use. Snow depth observations from synoptic stations are used to create large-scale snow product (e.g., global daily snow depth analysis by the Canadian Meteorological Centre (Brasnett 1999)), assimilate remote sensing data such as the advanced very high resolution radiometer snow cover data set by the Canada Centre for Remote Sensing (Fernandes et al. 2014), and to validate databases for large-scale land models (e.g., the Canadian Land Surface Scheme (Verseghy et al. 2017)). These products require inclusion of snow accumulation at open and sheltered locations to have value for melt and runoff predictions. Underestimation of snow accumulation is a known problem in prairie and northern regions when only synoptic weather station data are included (Brown and Brasnett 2011). Requests for data sharing with ECCC that occurred in this project demonstrated an interest in overcoming the past perception of citizen science data and enhancing mutual respect (Bouillon and Gomez 2001; Cooper et al. 2007; Paulos et al. 2008) and indicated a niche for and relevance of the data collected by the citizen scientists beyond the local scope.
The incentive to improve data collection at federal weather stations may not lie in local needs such as snow removal and spring melt water quality. Instead, evidence-based decision-making in cities could be supported by a suite of localized monitoring sites run by volunteers supported by local government. This serves three purposes. First, it engages urban dwellers in the city’s services and helps to foster empathy among citizens and city workers. This would go a long way towards aligning the values of the city’s managers with its citizenry. Second, through their involvement, citizens can gain knowledge about factors that influence snow accumulation, and better plan for their own individual daily tasks while understanding urban vulnerabilities. Third, the knowledge gained by citizens involved in these projects could be shared more widely, increasing the social learning beyond those individuals typically employed in city management tasks.
With suitable resource allocation and a training protocol (e.g., Kitching et al. 2005; Starr et al. 2014), citizen involvement and environmental engagement can be fostered for short- and long-term projects (cf. Weaver 2013). As it happens, the most robust snow measurement instruments are easy to operate for non-experts but require time investment for operation. By organizing observation campaigns with groups of volunteers (e.g., at local offices, schools, or community clubs) continuous reliable data series can be obtained. Not only is individual time investment minimized with respect to stations operated by a single person (i.e., most CoCoRaHS stations), but a sense of community is created in the groups through a joint development of knowledge, skills, and contribution to a sustainable living environment.
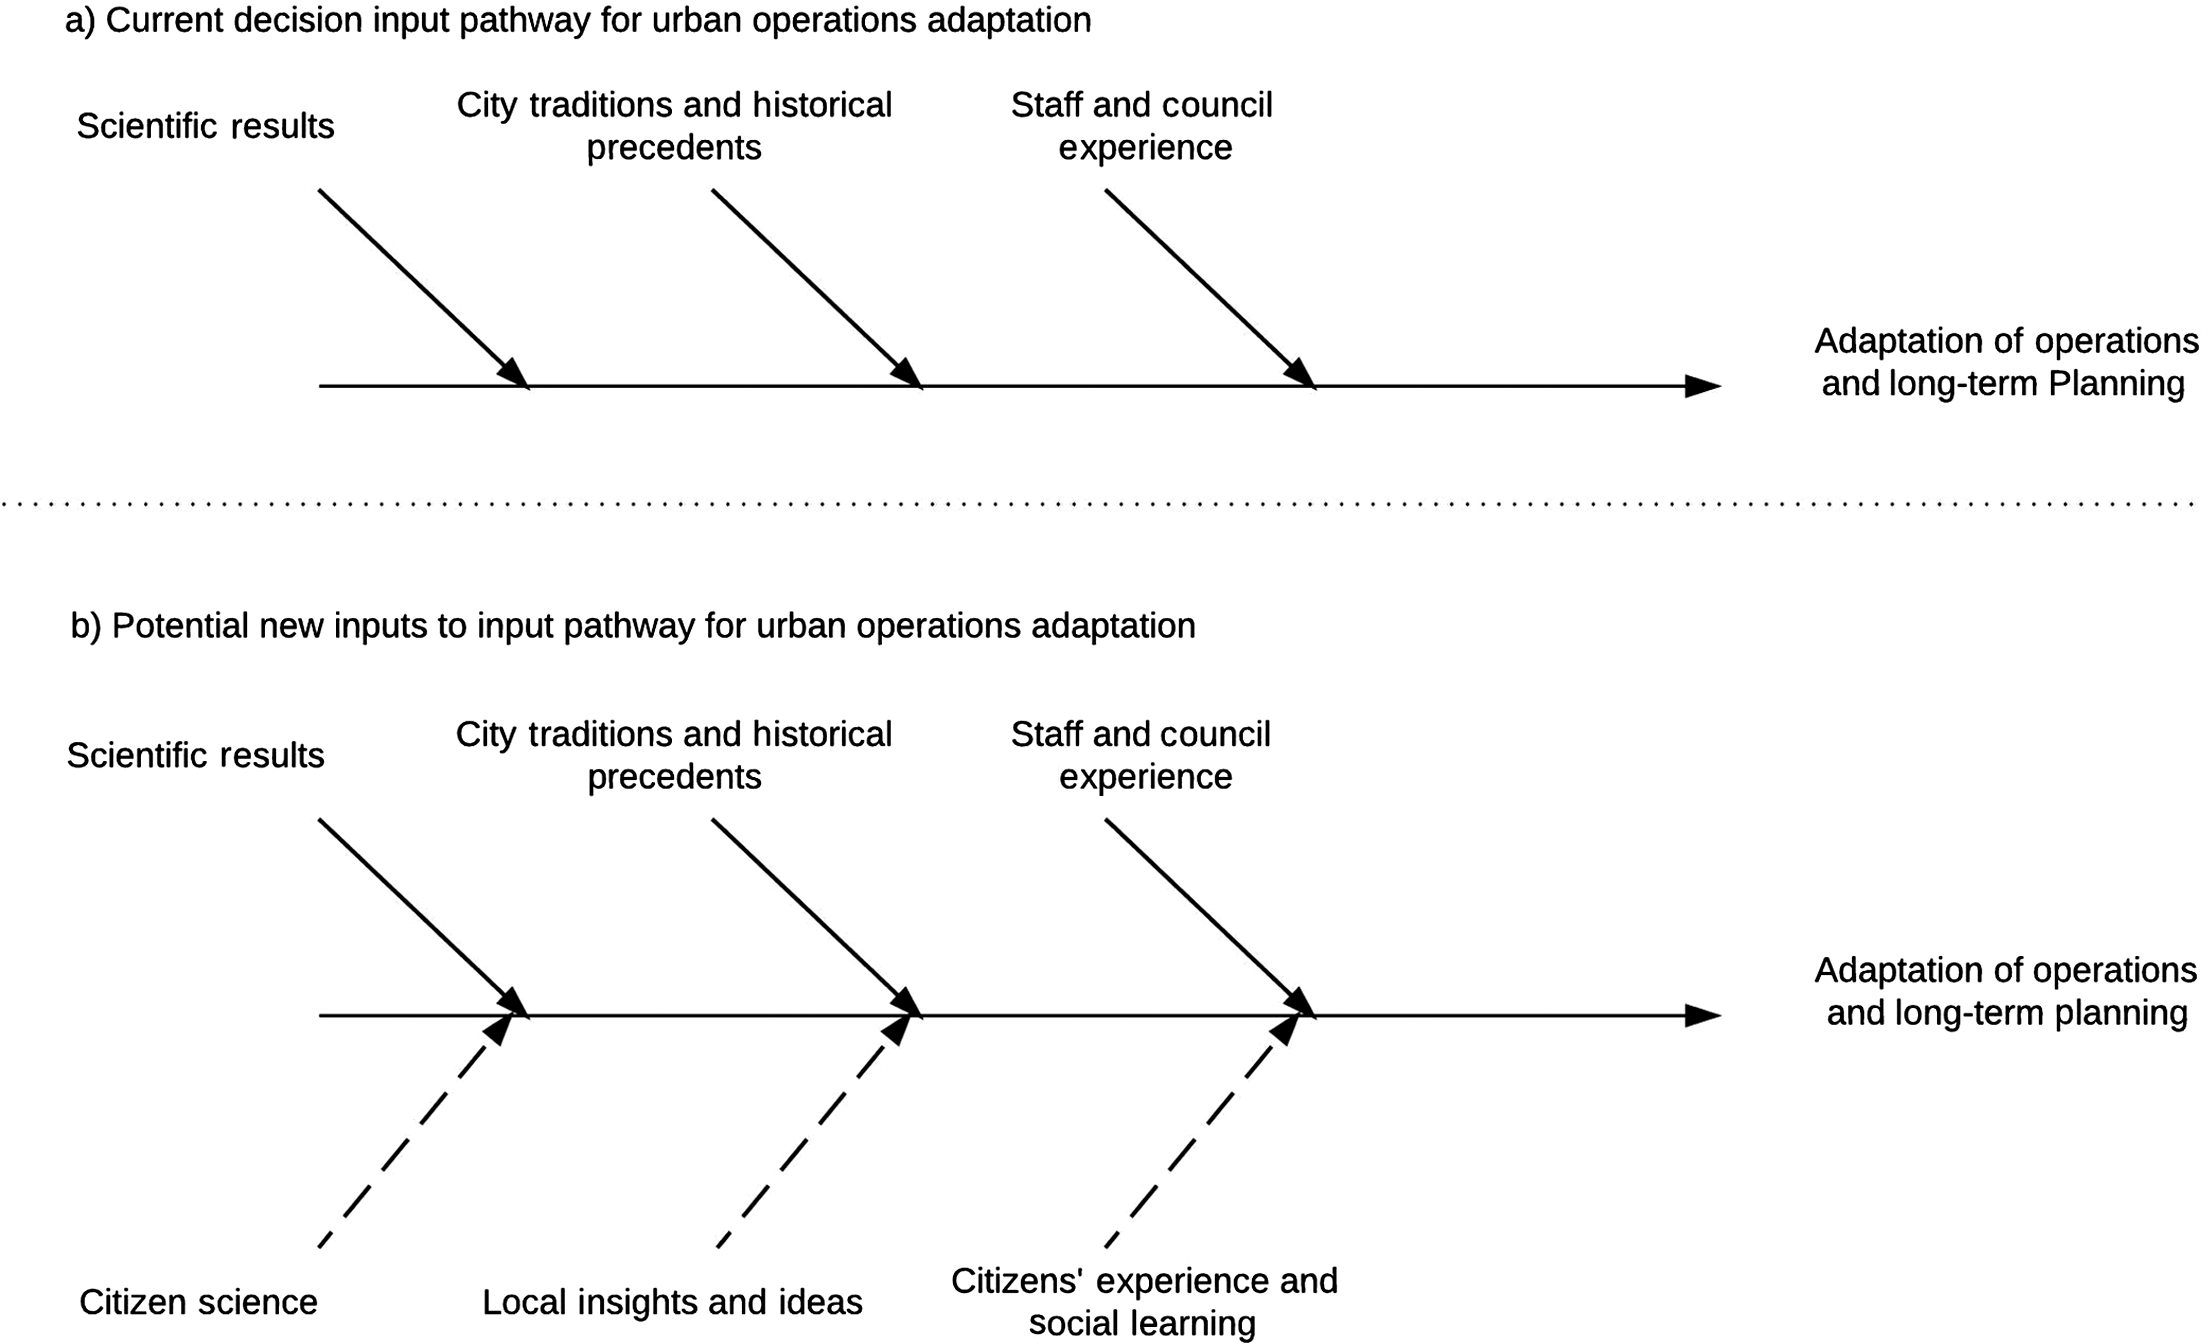
The wealth of locally relevant, credible, and salient data, as well as the experience and insights that can be generated in citizen science projects increases the resilience of the urban environment to climate change while simultaneously contributing ideas for adaptation planning in cities. Conceptually, these inputs contribute to various stages of the decision-making pathway for urban planning and operations, and ultimately to urban adaptation to climate change (Fig. 5). It is for this reason that supporting citizen science as a means for increasing data provision to support operational decision-making by city managers is a worthy venture. Policy writers can help close the science-policy gap by recommending that urban managers seek out opportunities for citizen engagement and social learning through citizen science projects. In the case of snow, witnessing the variability of snow coverage over a small, local measurement site enhanced the understanding of citizens to city manager problems. Knowing that it is difficult to measure where and when the snow will fall and accumulate leads to greater understanding of why urban snow removal, and later flood prediction tasks related to snow melt, are complex. Managers, in their turn, learned that citizen-derived data and processes are, at minimum, as credible as those derived from more formal scientific data providers.
Fig. 5.
Fig. 5. Decision-making pathway for urban planning and operations without (a) and with (b) citizen science input.

Conclusions

The objective of this study was to examine whether a city location for a snow observation station that is run by volunteers could improve data collection for city snow and water management. The daily snowfall values were similar between the city and the airport, but those obtained at the airport and SRC site needed non-trivial corrections. The differences between reported (uncorrected) data and actual (corrected) snowfall values were so high that the airport and SRC data were not useful for day-to-day urban management. Due to different levels of shelter and average wind speeds, snow depth data measured at the airport were not relevant for the city environment. The airport station was not designed and is not maintained with urban snow and water management in mind, yet due to the managers’ reliance on the data from this station, city services and operations could be significantly hindered by the resulting ineffectual data availability. Our study setup and the CoCoRaHS stations around the city provided numbers that were more locally relevant and could, therefore, provide valuable complementary information to improve decision-making for city service management. The volunteers created a reliable data set as shown by the consistency analysis of the snow cover data in the field and comparisons with other data sets of snowfall and accumulation in and around the city.
The study proved to be a successful example of small-scale community building. The participating citizens described learning from the endeavor, and feeling like they made a difference to the management of the city and its services, as well as learning more about their local environment. Social learning was described by the citizen scientists through the revisions to protocol that emerged as they increased their general snow hydrology interests and communicated with interested agencies and service providers. In the long term, the data produced by citizen scientist teams can contribute to overall planning and better measurement of the city’s sustainability given a network of monitoring locations. In the case of snow, multiple data sets will also help to improve the quantification of variability of accumulation in the urban environment.
City managers around the globe can benefit from the insights emerging in this study. Local people can generate locally relevant, credible, and legitimate data that can help urban managers to make decisions and adapt to changing climates. The additional benefits of having an engaged, trained, and active citizenry are self-evident. For sustainability science, the benefits helped to bridge physical and social knowledge systems. Indeed, when citizens learned more about their climate, they became increasingly engaged in better understanding it. The empathy built through the project interactions among citizens and urban managers creates a positive space in which both can prepare for the non-stationarity observed in today’s climate.

Acknowledgements

This study would not have been possible without the time and enthusiasm of our colleagues at the Global Institute for Water Security (GIWS), University of Saskatchewan, who were the citizen scientists in this study. Colleagues at ECCC are acknowledged for their thoughts on measurement techniques and interpretation of the results. We thank Virginia Wittrock (SRC) for providing detailed data from the SRC station. Equipment support was provided by Cuyler Onclin (ECCC), Dell Bayne, and Bruce Johnson (GIWS). Garth van der Kamp (ECCC/GIWS) and three anonymous reviewers provided us with valuable feedback on an earlier version of this manuscript.

References

Andersson E. 2006. Urban landscapes and sustainable cities. Ecology and Society, 11(1): 34.
Anumba CJ, Ugwu OO, and Ren Z. 2007. Agents and multi-agents in construction. Taylor & Francis, New York, New York.
Bandura A. 1977. Social learning theory. Prentice-Hall, Englewood Cliffs, New Jersey.
Batty M. 2012. Building a science of cities. Cities, 29: S9–S16.
Bonney R, Shirk JL, Phillips TB, Wiggins A, Ballard HL, Miller-Rushing AJ, et al. 2014. Next steps for citizen science. Science, 343(6178): 1436–1437.
Bouillon LM, and Gomez LM. 2001. Connecting school and community with science learning: real world problems and school–community partnerships as contextual scaffolds. Journal of Research in Science Teaching, 38(8): 878–898.
Brasnett B. 1999. A global analysis of snow depth for numerical weather prediction. Journal of Applied Meteorology, 38: 726–740.
Brown RD, and Brasnett B. 2011. The Canadian Meteorological Centre global daily snow depth analysis, 1998–2011: overview, experience and applications. In Proceedings of the 68th Eastern Snow Conference. Edited by Langlois A. McGill University, Montreal, Quebec. pp. 197–200.
Brown RD, and Mote PW. 2009. The response of Northern Hemisphere snow cover to a changing climate. Journal of Climate, 22(8): 2124–2145.
Buytaert W, Zulkafli Z, Grainger S, Acosta L, Alemie TC, Bastiaensen J, et al. 2014. Citizen science in hydrology and water resources: opportunities for knowledge generation, ecosystem service management, and sustainable development. Frontiers in Earth Science, 2: 26.
Cash DW, Clark WC, Alcock F, Dickson NM, Eckley N, and Jäger J. 2002. Salience, credibility, legitimacy and boundaries: linking research, assessment and decision making. Faculty Research Working Papers Series RWP02-046. Harvard University, Cambridge, Massachusetts.
Clark WC, and Dickson NM. 2003. Sustainability science: the emerging research program. Proceedings of the National Academy of Sciences of the USA, 100(14): 8059–8061.
Cook T, and Lara J. 2012. Remaking metropolis: global challenges of the urban landscape. Routledge Press, London, UK and New York, New York.
Cooper CB, Dickinson J, Phillips T, and Bonney R. 2007. Citizen science as a tool for conservation in residential ecosystems. Ecology and Society, 12(2): 11.
Corfee-Morlot J, Cochran I, Hallegatte S, and Teasdale PJ. 2011. Multilevel risk governance and urban adaptation policy. Climatic Change, 104(1): 169–197.
Crain W. 2016. Theories of development: concepts and applications. 6th edition. Routledge, New York, New York.
Davies SR, Selin C, Gano G, and Pereira AG. 2012. Citizen engagement and urban change: three case studies of material deliberation. Cities, 29(6): 351–357.
Devictor V, Whittaker RJ, and Beltrame C. 2010. Beyond scarcity: citizen science programmes as useful tools for conservation biogeography. Diversity and Distributions, 16(3): 354–362.
Dickinson JL, Zuckerberg B, and Bonter DN. 2010. Citizen science as an ecological research tool: challenges and benefits. Annual Review of Ecology, Evolution, and Systematics, 41: 149–172.
Environment and Climate Change Canada (ECCC). 2015. Historical climate data [online]: Available from climate.weather.gc.ca.
Fernandes R, Zhou F, and Song H. 2014. Evaluation of multiple datasets for snow cover indicators for Canada. In Proceedings of the IEEE International Geoscience and Remote Sensing Symposium, Quebec City, Québec, pp. 239–242.
Franklin A, Newton J, Middleton J, and Marsden T. 2011. Reconnecting skills for sustainable communities with everyday life. Environment and Planning A, 43(2): 347–362.
Goodison BE, Louie PYT, and Yang D. 1998. WMO solid precipitation measurement intercomparison. Instruments and Observing Methods Report No. 67, WMO/TD—No. 872, World Meteorological Organization, Geneva, Switzerland.
Gray DM, and Male DH. 1981. Handbook of snow, principles, processes, management and use. Pergamon Press, Toronto, Ontario.
Gura T. 2013. Citizen science: amateur experts. Nature, 496: 259–261.
Hallegatte S, and Corfee-Morlot J. 2011. Understanding climate change impacts, vulnerability and adaptation at city scale: an introduction. Climatic Change, 104(1): 1–12.
Hansson H, and Norberg C. 2009. Cold matters: cultural perceptions of snow, ice and cold. Umeå University and the Royal Skyttean Society, Umeå, Sweden.
Haywood BK. 2016. Beyond data points and research contributions: the personal meaning and value associated with public participation in scientific research. International Journal of Science Education, Part B, 6(3): 239–262.
Hesse P. 2014. Common interest development in Canada: private communities and the future of Canadian cities. Student Paper Series. University of Winnipeg, Winnipeg, Manitoba.
Hong S, Hagiwara T, Takeuchi S, and Lu B. 2015. Effects of weather conditions and snow removal operations on travel speed in an urban area. Transportation Research Record: Journal of the Transportation Research Board, 2482: 90–101.
Hunt A, and Watkiss P. 2011. Climate change impacts and adaptation in cities: a review of the literature. Climatic Change, 104(1): 13–49.
Irwin A. 1995. Citizen science: a study of people, expertise and sustainable development. Routledge, New York, New York.
Irwin A. 2001. Constructing the scientific citizen: science and democracy in the biosciences. Public Understanding of Science, 10(1): 1–18.
Jordan RC, Ballard HL, and Phillips TB. 2012. Key issues and new approaches for evaluating citizen-science learning outcomes. Frontiers in Ecology and the Environment, 10(6): 307–309.
Kalmykova Y, Rosado L, and Patrício J. 2015. Urban economies resource productivity and decoupling: metabolism trends of 1996–2011 in Sweden, Stockholm, and Gothenburg. Environmental Science & Technology, 49(14): 8815–8823.
Kennedy C, Pincetl S, and Bunje P. 2011. The study of urban metabolism and its applications to urban planning and design. Environmental Pollution, 159(8–9): 1965–1973.
Kishi K, Takahashi Y, Hara F, and Satoh K. 2002. Level of snow removal service and residents’ willingness to pay: evaluation for four Japanese cities. Transportation Research Record: Journal of the Transportation Research Board, 1794: 72–76.
Kitchin R. 2014. The real-time city? Big data and smart urbanism. GeoJournal, 79(1): 1–14.
Kitching RL, Boulter S, Vickeman G, Laidlaw M, Hurley KL, and Grimbacher PS. 2005. The comparative assessment of arthropod and tree biodiversity in old-world rainforests: the Rainforest CRC/Earthwatch protocol manual. 2nd edition. Rainforest CRC, Cairns, Queensland, Australia.
Kuemmel DE. 1994. Managing roadway snow and ice control operations. National Cooperative Highway Research Program Synthesis 207. National Academy of Sciences, Washington, DC.
Lave J, and Wenger E. 1991. Situated learning: experience as the source of learning and development. Cambridge University Press, Cambridge, UK.
Leach M, and Fairhead J. 2002. Manners of contestation: “citizen science” and “indigenous knowledge” in West Africa and the Caribbean. International Social Science Journal, 54(3): 299–311.
Matheussen BV, and Thorolfsson ST. 2001. Urban snow surveys in Risvollan—Norway. In Urban drainage modeling. Edited by Brashear RW and Maksimovic C. American Society of Civil Engineers, Reston, Virginia. pp. 89–99.
Mekis E, and Vincent LA. 2011. An overview of the second generation adjusted daily precipitation dataset for trend analysis in Canada. Atmosphere-Ocean, 49(2): 163–177.
Mölders N, and Olson MA. 2004. Impact of urban effects on precipitation in high latitudes. Journal of Hydrometeorology, 5: 409–429.
Muthanna TN, Viklander M, Blecken G, and Thorolfsson ST. 2007. Snowmelt pollutant removal in bioretention areas. Water Research, 41(18): 4061–4072.
Nov O, Arazy O, and Anderson D. 2014. Scientists@home: what drives the quantity and quality of online citizen science participation? PLoS ONE, 9(4): e90375.
Novotny EV, Murphy D, and Stefan HG. 2008. Increase of urban lake salinity by road deicing salt. Science of the Total Environment, 406(1–2): 131–144.
Paulos E, Honicky R, and Hooker B. 2008. Citizen science: enabling participatory urbanism. In Handbook of research on urban informatics: the practice and promise of the real-time city. Edited by Foth M. IGI Global, Hershey, Pennsylvania. pp. 414–436.
Perryman N, and Dixon PG. 2013. A radar analysis of urban snowfall modification in Minneapolis–St. Paul. Journal of Applied Meteorology and Climatology, 52(7): 1632–1644.
Pham T, Lum K, and Lemieux C. 1993. Sources of PAHs in the St. Lawrence River (Canada) and their relative importance. Chemosphere, 27(7): 1137–1149.
Pomeroy JW, and Gray DM. 1995. Snowcover accumulation, relocation, and management. NHRI Science Report No. 7. National Hydrology Research Institute, Environment Canada, Saskatoon, Saskatchewan.
Rees A, English M, Derksen C, Toose P, and Silis A. 2014. Observations of late winter Canadian tundra snow cover properties. Hydrological Processes, 28(12): 3962–3977.
Reinosdotter K, and Viklander M. 2005. A comparison of snow quality in two Swedish municipalities—Luleå and Sundsvall. Water, Air, and Soil Pollution, 167(1–4): 3–16.
Silvertown J. 2009. A new dawn for citizen science. Trends in Ecology & Evolution, 24(9): 467–471.
Smith C. 2007. Correcting the wind bias in snowfall measurements made with a Geonor T-200b precipitation gauge and Alter wind shield. In Proceedings of the 14th Symposium on Meteorological Observation and Instrumentation. American Meteorological Society, Boston, Massachusetts. 6 p.
Starr J, Schweik CM, Bush N, Fletcher L, Finn J, Fish J, et al. 2014. Lights, camera…citizen science: assessing the effectiveness of smartphone-based video training in invasive plant identification. PLoS ONE, 9(11): e111433.
Thomas DR. 2006. A general inductive approach for analyzing qualitative evaluation data. American Journal of Evaluation, 27(2): 237–246.
Verseghy D, Brown R, and Wang L. 2017. Evaluation of CLASS snow simulation over eastern Canada. Journal of Hydrometeorology, 18: 1205–1225.
Weaver DB. 2013. Protected area visitor willingness to participate in site enhancement activities. Journal of Travel Research, 52(3): 377–391.
Wenger E. 1998. Communities of practice: learning, meaning and identity. Cambridge University Press, Cambridge, UK.
Westerlund C, and Viklander M. 2006. Particles and associated metals in road runoff during snowmelt and rainfall. Science of the Total Environment, 362(1–3): 143–156.
Wiggins A, and Crowston K. 2011. From conservation to crowdsourcing: a typology of citizen science. In 2011 44th Hawaii International Conference on System Sciences (HICSS), Kauai, Hawaii, pp. 1–10.
Worldwatch Institute. 2007. State of the world 2007: our urban future [online]: Available from worldwatch.org/node/4752.
Yuen E, Jovicich SS, and Preston BL. 2013. Climate change vulnerability assessments as catalysts for social learning: four case studies in south-eastern Australia. Mitigation and Adaptation Strategies for Global Change, 18(5): 567–590.

Information & Authors

Information

Published In

cover image FACETS
FACETS
Volume 2Number 2January 2017
Pages: 734 - 753
Editor: Neil C. Swart

History

Received: 26 March 2017
Accepted: 21 July 2017
Version of record online: 26 September 2017

Data Availability Statement

All relevant data are within the paper and in the Dryad data repository (doi:https://doi.org/10.5061/dryad.33n5g).

Key Words

  1. urban snow measurements
  2. citizen science
  3. social learning
  4. sustainable community

Sections

Subjects

Plain Language Summary

Your local snow conditions brought to you by citizen scientists

Authors

Affiliations

Willemijn M. Appels [email protected]
Centre for Technology, Environment, and Design, Lethbridge College, 3000 College Drive South, Lethbridge, AB T1K 1L6, Canada
Lori Bradford
School of Public Health, University of Saskatchewan, 104 Clinic Place, Saskatoon, SK S7N 2Z4, Canada
Kwok P. Chun
Department of Geography, Hong Kong Baptist University, Office: AAB 1235, 12/F, Academic and Administration Building, 15 Baptist University Road, Kowloon Tong, Hong Kong
Anna E. Coles
Global Institute for Water Security, University of Saskatchewan, 11 Innovation Boulevard, Saskatoon, SK S7N 3H5, Canada
Graham Strickert
School of Environment and Sustainability, University of Saskatchewan, Room 323, Kirk Hall, 117 Science Place, Saskatoon, SK S7N 5C8, Canada

Author Contributions

WMA, KPC, AEC, and GS conceived and designed the study.
WMA, KPC, AEC, and GS performed the experiments/collected the data.
WMA, KPC, and AEC analyzed and interpreted the data.
All drafted or revised the manuscript.

Competing Interests

The authors have declared that no competing interests exist.

Metrics & Citations

Metrics

Other Metrics

Citations

Cite As

Export Citations

If you have the appropriate software installed, you can download article citation data to the citation manager of your choice. Simply select your manager software from the list below and click Download.

Cited by

1. Smart sustainable cities evaluation and sense of community

View Options

View options

PDF

View PDF

Get Access

Media

Media

Other

Tables

Share Options

Share

Share the article link

Share on social media