Chemical shift tensors as probes of chalcogen bonds: solid-state NMR study of telluradiazole-XCN− (X = O, S, Se) salt cocrystals
This article has been corrected.
VIEW CORRECTIONAbstract
We report experimental 125Te magic-angle spinning solid-state nuclear magnetic resonance (MAS NMR) measurements of the tellurium chemical shift (CS) tensors in three [K(18-crown-6)]+ 3,4-dicyano-1,2,5-telluradiazole-XCN− (X = O, S, Se) salt cocrystals featuring chalcogen bonds. These data are compared to those for pure 3,4-dicyano-1,2,5-telluradiazole (1). A reduction in the span of the 125Te CS tensor is consistently noted in the salt cocrystals compared to pure 1. Isotopically 15N-labelled [K(18-crown-6)]+[1-OC15N]−, which features a chalcogen bond between Te and the cyanate nitrogen atom, is synthesized using KOC15N, and the nitrogen CS tensors are measured for both samples via 15N slow MAS NMR spectroscopy. Possible dynamic disorder of the cyanate ions in KOCN is ruled out. Two crystallographically distinct nitrogen sites are resolved for the salt cocrystal. Upon formation of [K(18-crown-6)]+[1-OC15N]−, the 15N isotropic CS and CS tensor span both decrease relative to the values for pure KOC15N, and the axial symmetry of this tensor is lost. These findings are supplemented with a series of density functional theory calculations of magnetic shielding tensors using cluster models or periodic boundary conditions. Inclusion of spin–orbit relativistic effects in the calculation of tellurium shielding tensors is particularly important in achieving agreement with experiment.
Graphical Abstract

Introduction
Non-covalent bonds play important and unique roles in determining molecular structure, dynamics, and function. Such bonds may include hydrogen bonds, halogen bonds (Desiraju et al. 2013), chalcogen bonds (Aakeroy et al. 2019), tetrel bonds (Bauzá et al. 2019), pnictogen bonds (Resnati et al. 2023), and other more recently explored element-based electrostatic bonds such as regium bonds (Frontera and Bauzá 2018) or coinage metal bonds (Legon and Walker 2018), triel bonds (Grabowski 2020), spodium bonds (Bauzá et al. 2020), and matere bonds (Daolio et al. 2021), for example. In this terminology, the bond donor is named after the element participating in the bond and which accepts electrons (Cavallo et al. 2014). The bond acceptor donates electrons. The prevailing paradigm for understanding these types of non-covalent bonds often invokes the concept of a σ-hole which forms on a donor atom opposite a covalently bonded electron-withdrawing substituent (Politzer et al. 2017). The σ-hole is an area of elevated electrostatic potential, typically coinciding with decreased electron density. Because of the way in which the σ-hole is created, the resulting non-covalent bonds tend to be highly predictable, directional, and tunable. Evidence for π character in halogen bonds has also been presented (Kellett et al. 2020). σ-hole interactions are now well established as important tools in catalysis, supramolecular chemistry, materials chemistry, and in biological systems. In the solid state, σ-hole interactions also offer a wide range of unique opportunities in crystal engineering.
Chalcogen bonds and related chalcogen–chalcogen interactions are of particular interest from a fundamental perspective and in a range of applications (Werz et al. 2002; Gleiter et al. 2003; Gleiter et al. 2018; Aakeroy et al. 2019; Scilabra et al. 2019; Haberhauer and Gleiter 2020). Selenium and tellurium are the most common chalcogen bond donor elements, and many examples of chalcogen-bonded systems featuring these elements have been discussed, including their applications in catalysis, materials chemistry, and synthesis (Mahmudov et al. 2017; Vogel et al. 2018; Yan et al. 2021). To understand the structural, electronic, and crystallographic properties of chalcogen bonds, as well as the role they may play in crystal engineering applications, it is important to develop novel analytical methods for their analysis. In addition to single-crystal X-ray diffraction, a wealth of information is available from 77Se and 125Te solid-state nuclear magnetic resonance (NMR) studies of chalcogen-bonded solids and cocrystals (Collins et al. 1988; Stanford et al. 2014; Sanz Camacho et al. 2015; Sanz Camacho et al. 2016; Sanz Camacho et al. 2018; Kumar et al. 2018; Xu et al. 2020; Kumar et al. 2020a; 2020b; 2022; Nag et al. 2022).
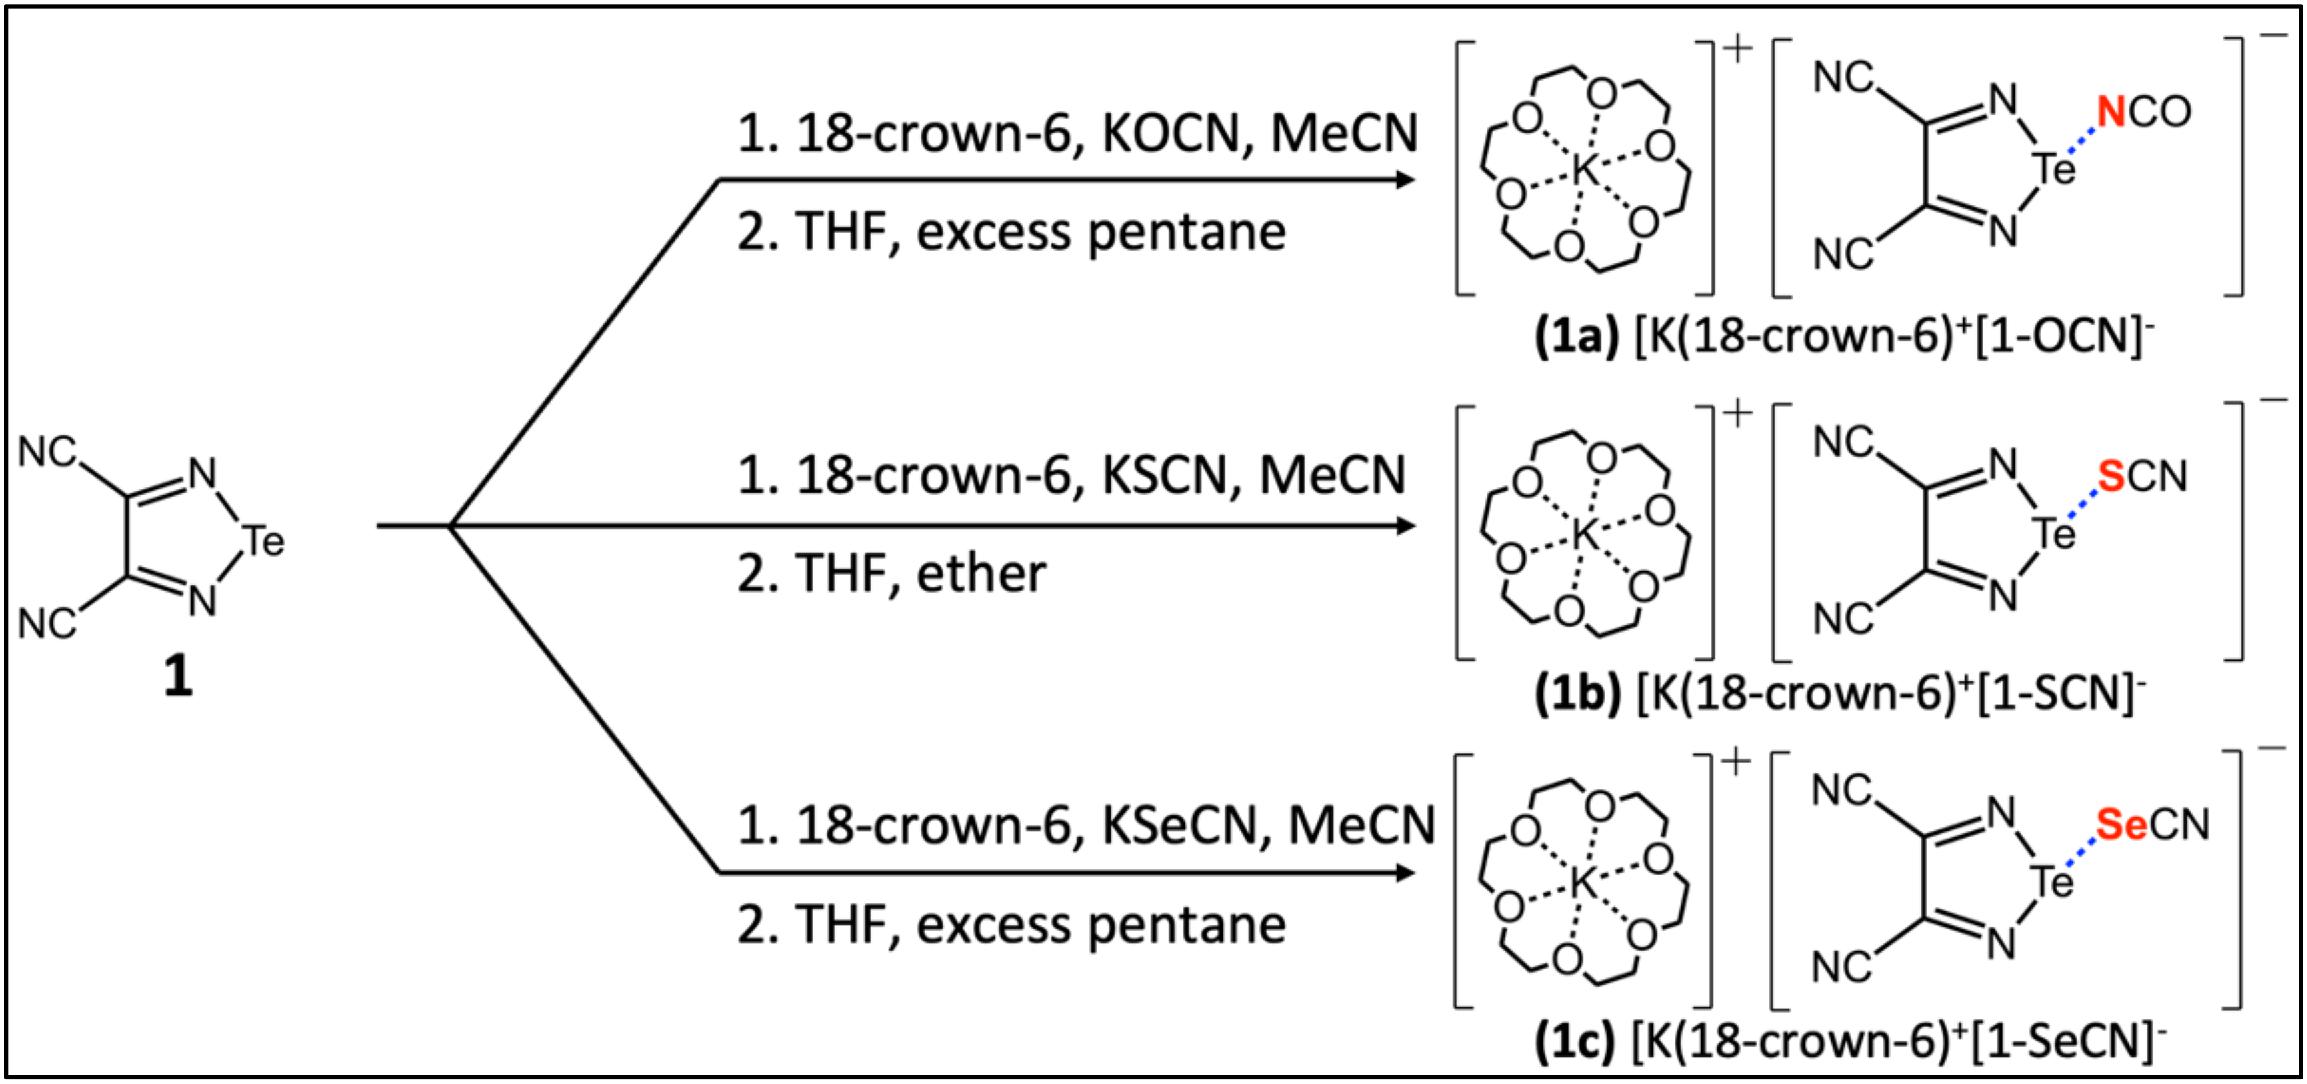
In this work, we turn our attention to a series of three [K(18-crown-6)]+ 3,4-dicyano-1,2,5-telluradiazole-XCN− (X = O, S, Se) salt cocrystals described by Semenov et al. (2018) and which feature chalcogen bonds between tellurium and nitrogen, sulfur, and selenium, respectively (Fig. 1). These systems are of particular interest because of the simplicity of the linear chalcogen bond acceptor anions and the sequestration of the potassium counterion by 18-crown-6. We hypothesized that this series of salt cocrystals could provide for a relatively direct comparison of NMR spectroscopic parameters with local chalcogen bond geometries, with a minimum of differential crystal packing effects to confound the analysis. We report here the measurement of 125Te chemical shift (CS) tensors using magic-angle spinning solid-state NMR (MAS NMR) spectroscopy for the series of salt cocrystals, and discuss these data in the context of the single-crystal X-ray diffraction structures. The data are further compared to those for the pure chalcogen bond donor, 3,4-dicyano-1,2,5-telluradiazole. We additionally describe the preparation of isotopically 15N enriched [K(18-crown-6)]+ 3,4-dicyano-1,2,5-telluradiazole-OC15N− from KOC15N and report the 15N CS tensors for both compounds. In this manner, insight into the chalcogen bond is obtained via NMR interrogation of both the donor (Te) and acceptor (N) elements in the same compound. All experimental data are further interpreted in the context of extensive density functional theory (DFT) calculations of the tellurium and nitrogen nuclear magnetic shielding tensors.
Fig. 1.
Experimental
Synthesis and sample preparation
The synthesis of 3,4-dicyano-1,2,5-telluradiazole was performed using a procedure reported by Semenov et al. (2012) with some modifications (see Supplementary Material). The preparation of the telluradiazole-XCN− (X = O, S, Se) salt cocrystals similarly followed procedures adapted from the literature (Fig. 1; see Supplementary Material) (Semenov et al. 2018). TeCl4, cyclic polyether 18-crown-6, KSCN, and KSeCN were obtained from Sigma–Aldrich. Diaminomaleonitrile and KOCN were obtained from Acros Organics. Isotopically enriched KOC15N (95%) was obtained from CortecNet. Solvents were dried with molecular sieves. Synthesis was performed using common Schlenk and vacuum-line techniques under argon. For work up, a rotary evaporator was employed to distill reaction solvents under reduced pressure. Further synthetic details are provided in the Supplementary Material.
X-ray diffraction
To ensure that the compounds were successfully prepared as described above, and that their morphologies matched those reported previously in the literature, single-crystal structures were determined by using a Bruker AXS Kappa Apex diffractometer equipped with MoKα (λ = 0.7103 Å) radiation with an APEX II CCD detector (University of Ottawa, Canada). Crystals were mounted onto a glass fibre and cooled to 200 K (±2 K) before data collection using a liquid nitrogen cryogen system. Raw data collection and processing were performed with the Bruker APEX III software package. Crystal structures were solved using WinGX and Olex2 software packages. Packing diagrams were generated using Mercury 4.1.0 and POV-Ray, and the former was used to measure bond angles and bond distances.
Powder X-ray diffractograms were acquired using a Rigaku Ultima IV powder diffractometer (University of Ottawa, Canada) with a copper source and one diffracted beam monochromator. Relevant parameters include a 2θ scan angle of 5 to 50°, a scanning speed of 1°/min, a division slit of 1/3°, a scattering slit of 1/3°, a division height of 10 mm, and a rectangular slit of 0.6 mm. Experimental diffractograms were compared to simulated patterns generated from single-crystal structure crystallographic information files (CIFs) using Mercury software (CCDC 2021).
Solid-state nuclear magnetic resonance spectroscopy
125Te and 15N SSNMR spectra were acquired using a 400 MHz Bruker Avance III NMR spectrometer operating at 9.4 T with a 4 mm Bruker HXY probe (University of Ottawa, Canada). Samples were finely ground using a mortar and pestle, and packed into 4 mm o.d. zirconia rotors. Spectra were acquired using high-power decoupling (62.5 kHz) with magic angle spinning or cross-polarization MAS. 125Te CSs were measured with respect to solid telluric acid, Te(OH)6 (δiso = 685.5 and 692.2 ppm relative to Me2Te at 0 ppm) (Collins et al. 1987). 15N CSs were referenced to isotopically enriched 15NH4Cl (δiso = 39.3 ppm relative to NH3(l) at 0 ppm) (Bertani et al. 2014). Data for each sample were collected at different MAS rates ranging from 1.500 to 11.000 kHz to determine the isotropic peak(s) and to measure CS anisotropy via a Herzfeld–Berger analysis (Herzfeld and Berger 1980) using the HBA software package (Eichele 1995). Typical recycle delays for the 125Te direct-observe experiments were 60 s. Further experimental details are provided in the Supplementary Material.
Density functional theory calculations
DFT calculations of magnetic shielding tensors were carried out using two methods: a cluster-model approach within the Amsterdam Density Functional (ADF) software and an approach using periodic boundary conditions as implemented in the CASTEP software package. Both sets of calculations used the published single-crystal structures of compounds 1, 1a, 1b, and 1c (Semenov et al. 2018) as described below.
Cluster models of compounds 1, 1a, 1b, and 1c were built for DFT calculations carried out using ADF software, part of the Amsterdam Modeling Suite (2019.305) (te Velde et al. 2001; Baerends et al. 2019). In each case, a model was generated to ensure the coordination environment of the tellurium atom of interest was properly described (e.g., including close contacts) (see Supplementary Material). No geometry optimization was subsequently performed. The zeroth-order regular approximation (ZORA) method was used to include (i) scalar relativistic terms and, in a second set of calculations and (ii) scalar and spin–orbit (so) relativistic terms in the magnetic shielding tensor calculations (Schreckenbach and Ziegler 1995, 1996, 1997; Wolff and Ziegler 1998; Wolff et al. 1999; Autschbach and Zurek 2003; Autschbach 2013). The PBE0 functional (Adamo and Barone 1999) was used with the TZ2P basis set.
Experimentally established CIFs were used as input for CASTEP (version 20.11; Clark et al. 2005) calculations of nuclear magnetic shielding tensors using the gauge-including projector-augmented wave (GIPAW) DFT method (Pickard and Mauri 2001; Profeta et al. 2003; Yates et al. 2007). CCDC codes are as follows (Semenov 2018): BIHQOB (1a; ccdc 1837178), BIHQUH (1b; ccdc 1837179), BIHRAO (1c; ccdc 1837180). Calculations on KOCN were performed using a CIF based on the published single-crystal X-ray structure (Hendricks and Pauling 1925); however, this structure features a 50:50 (presumed) static disorder of the oxygen and nitrogen atoms. To model this disorder, the structure was manually modified in Materials Studio 5.0 to generate a supercell structure with P1 symmetry (lattice parameters a = b = 6.070 Å, c = 7.030 Å) wherein half of the disordered sites were randomly assigned as oxygen atoms and half as nitrogen atoms while ensuring each of the resultant ions were cyanates. Materials Studio 5.0 was used to create CASTEP .param and .cell files for all structures. The PBE (Perdew et al. 1996) and RPBE (Hammer et al. 1999) functionals were employed in separate sets of calculations using on-the-fly pseudopotentials. Cut-off energies were typically incremented to several hundred eV to ensure convergence of the computed magnetic shielding tensors (vide infra). Both the default Koelling–Harmon (Koelling and Harmon 1977) and ZORA-scalar relativistic treatments were used, in separate sets of calculations. The k-points used to sample the Brillouin zone were determined using the “fine” automated setting of Materials Studio. Convergence behaviour with respect to k-point setting is shown in the Supplementary Material.
Finally, two additional series of calculations were performed on small model systems using Gaussian 09 software (B3LYP/DGDZVP) and ADF software (ZORA-so, SAOP/QZ4P). The models were constructed from the available CIFs and specific distances and angles were varied to assess the 125Te and 15N magnetic shielding tensor response.
EFGShield version 4.7 (Adiga et al. 2007) and MagresView version 1.6.2 (Sturniolo et al. 2016) were used to parse and visualize tensor output from the various sets of DFT calculations.
Magnetic shielding tensors were converted to CS tensors according to δ = (σref-σ)/(1-σref). The experimental absolute 125Te shielding scale was used where σref(Me2Te) = 4333 ppm (Jameson and Jameson 1987). The experimental absolute 15N shielding scale was used where σref(NH3(l)) = 244.6 ppm (Jameson et al. 1981).
Results and discussion
NMR spectroscopy
Compound 1, as well as cocrystals 1a, 1b, and 1c, were prepared according to adapted literature procedures. Single crystals of 1a, 1b, and 1c were grown and their crystal structures verified by single-crystal X-ray diffraction. In all three cases, the same structures were obtained as those reported in the literature. The morphology and phase purity of powders of these cocrystals were similarly assessed via powder X-ray diffraction (Fig. 2 and Supplementary Material). These findings allow for a confident interpretation of solid-state NMR data in the context of the diffraction-based structures (vide infra).
Fig. 2.
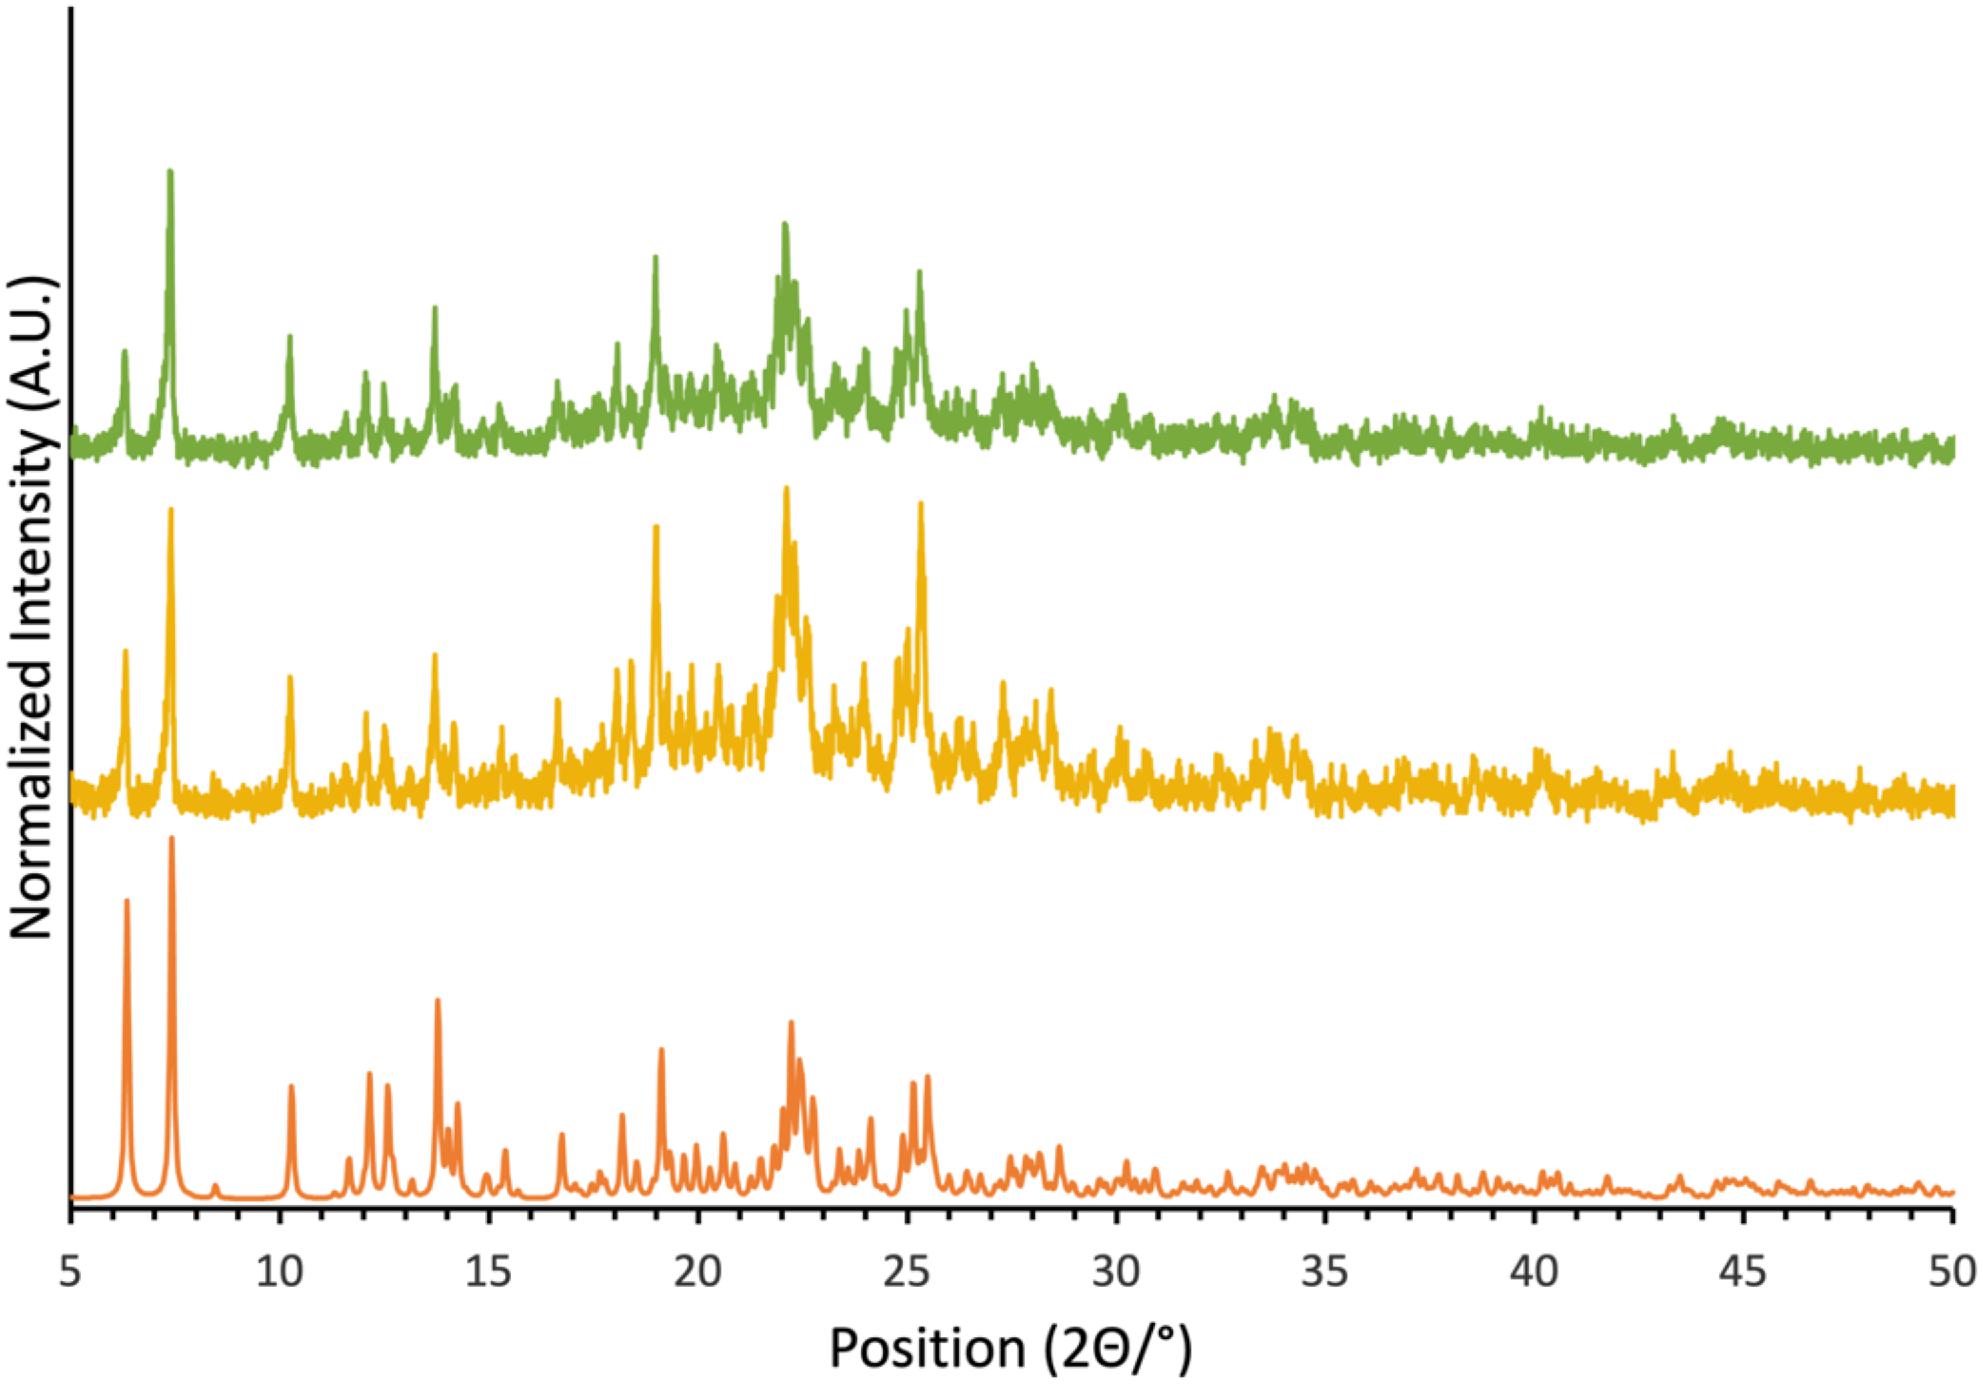
With the goal of investigating the impact on the cyanate nitrogen CS tensor of chalcogen bond formation to tellurium in cocrystal 1a, a second sample was prepared using isotopically 15N-enriched KOCN (95%). This isotopically enriched sample presented a powder X-ray diffractogram identical to that for the natural abundance sample and identical to that simulated based on the single crystal X-ray structure (Fig. 2). These data show that the crystal structure of both the natural abundance sample and the isotopically enriched sample prepared herein are consistent with that reported via single-crystal X-ray diffraction.
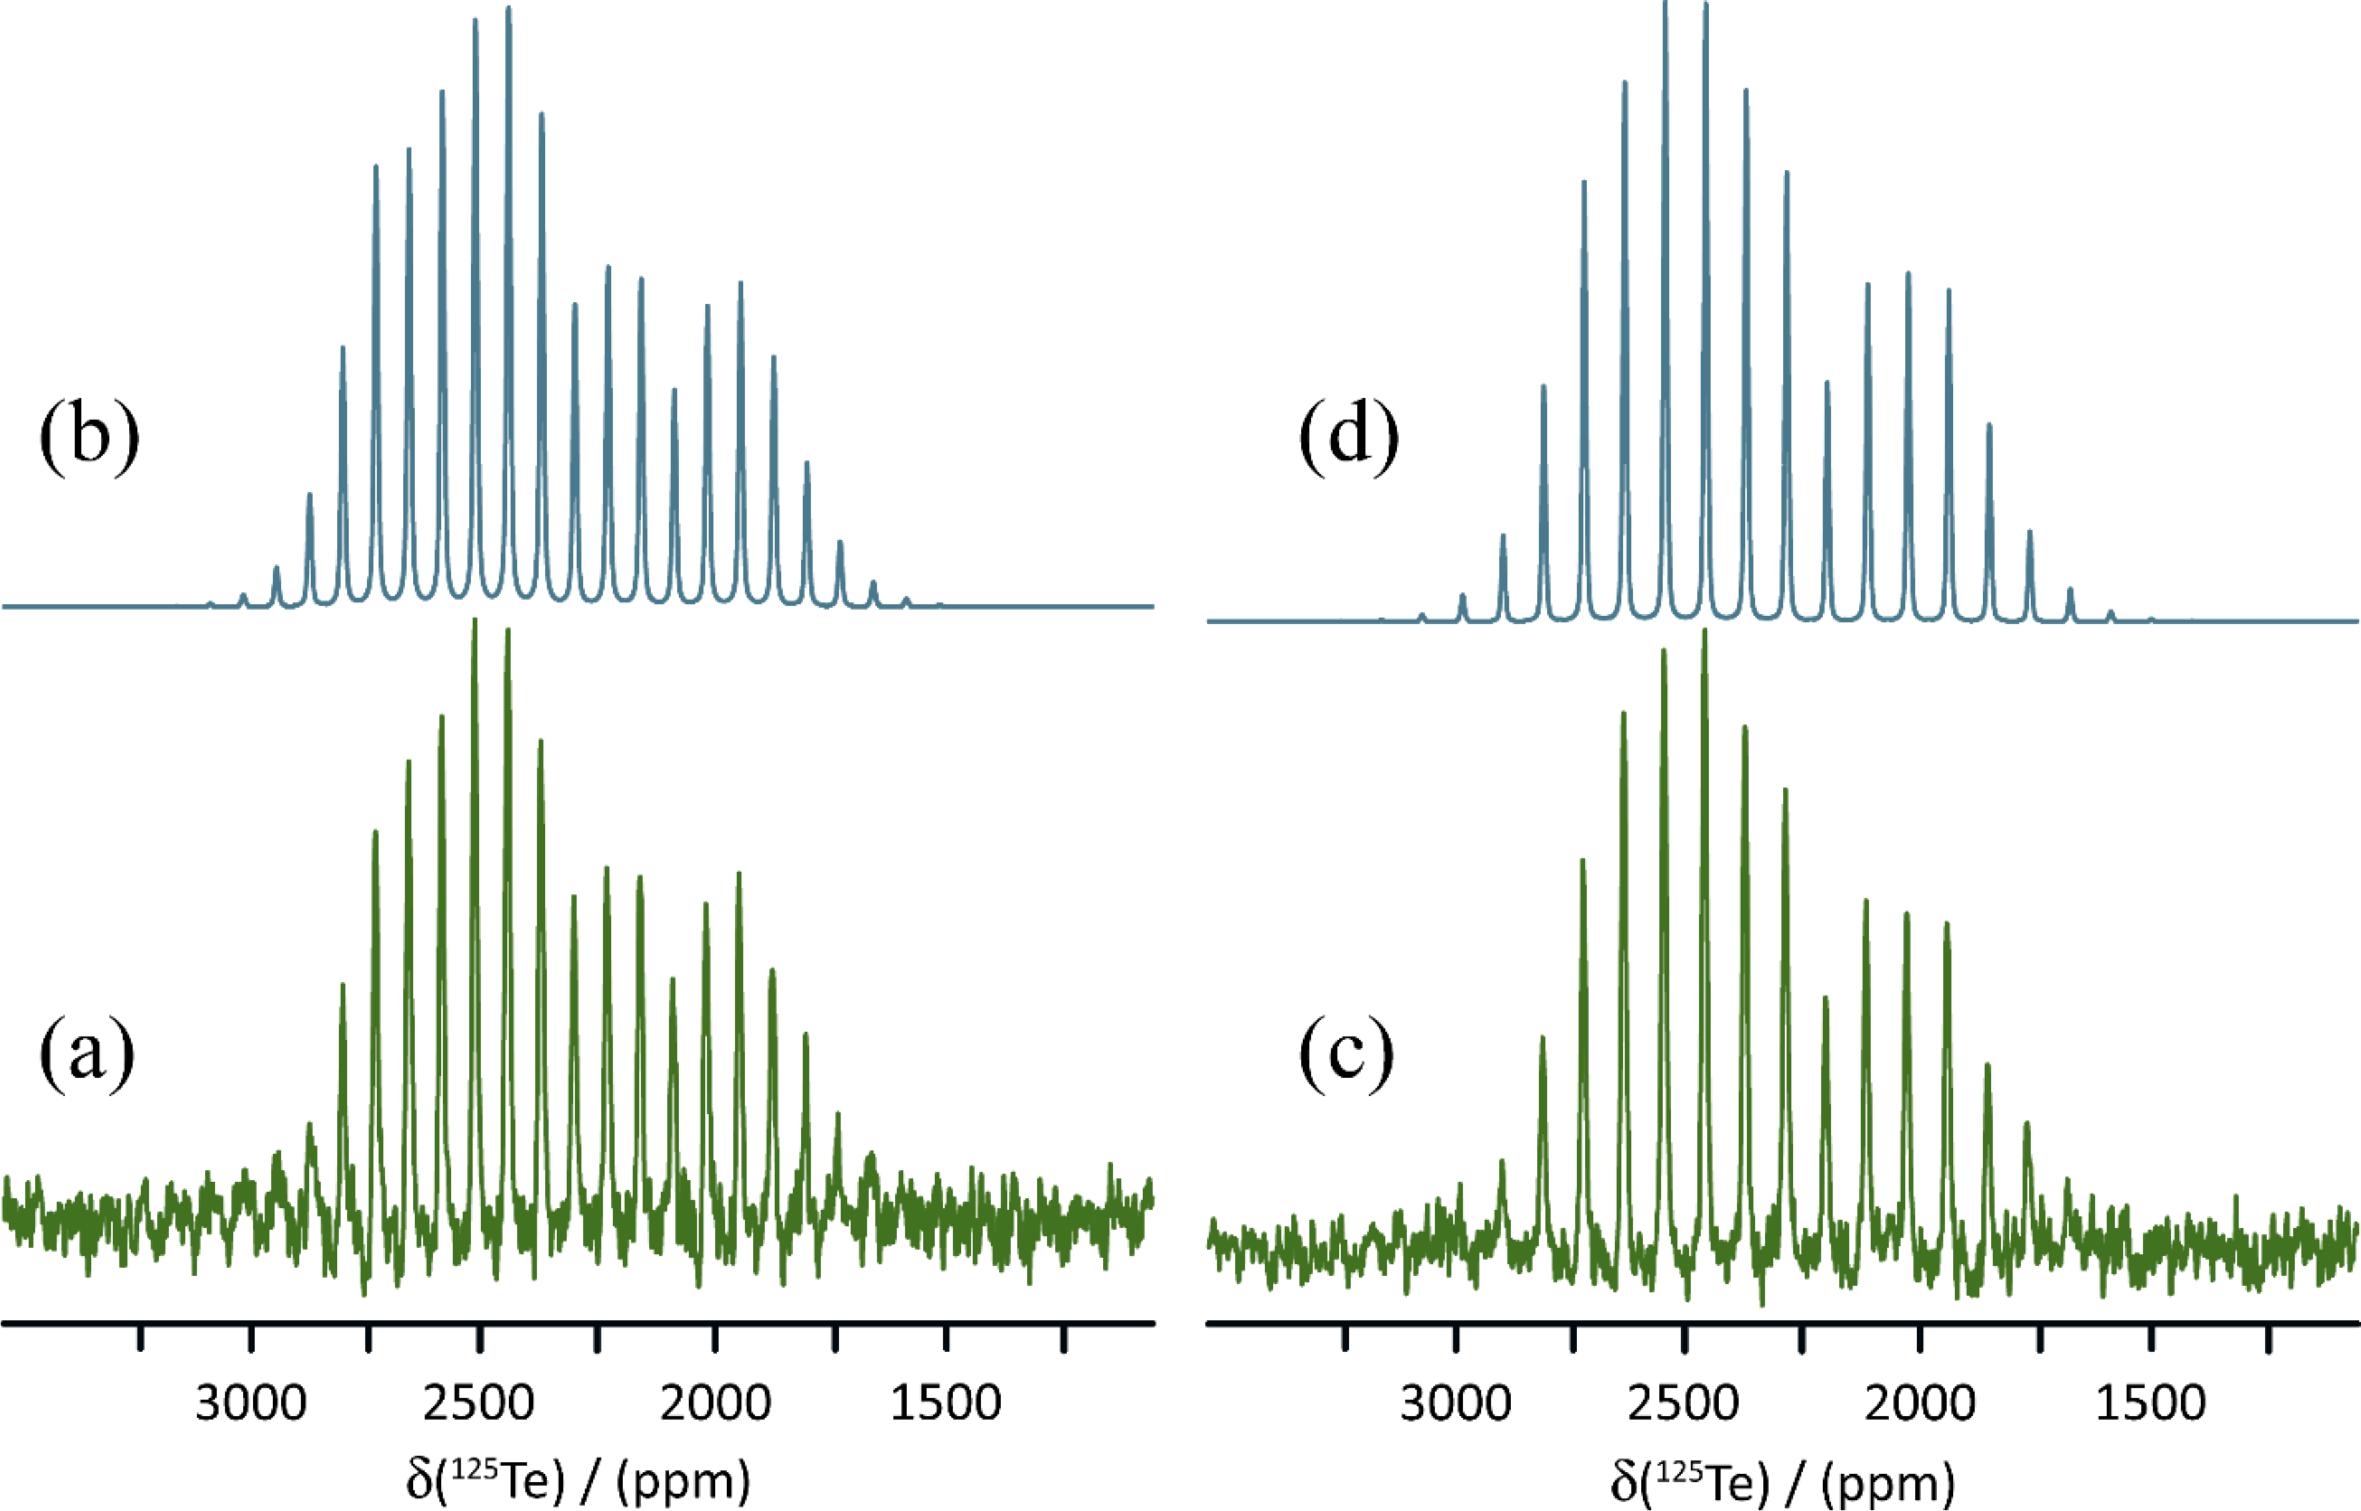
The 125Te magic-angle spinning NMR spectra of solid powdered 1a, 1b, and 1c are presented in Figs. 3, 4, and 5. Spectra were acquired with high-power proton decoupling. Cross-polarization from protons did not yield good-quality NMR spectra, likely owing to the fact that the tellurium atoms in each sample are relatively distant from the only hydrogens in the system. Furthermore, these hydrogens are found on the 18-crown-6 rings, which are known to be mobile (Buchanan et al. 1987; Ratcliffe et al. 1992), thereby further weakening dipolar interactions between 1H and 125Te necessary for cross-polarization. The 125Te MAS NMR spectra were acquired in a moderate magnetic field of 9.4 T, which was found to offer a good balance between sensitivity and spectral broadening due to CS anisotropy. Spectra were generally acquired with at least two different MAS rates (9.000 and 11.000 kHz) to distinguish the isotropic peaks from the spinning sidebands. These sideband manifolds were fit using the Herzfeld–Berger method (Herzfeld and Berger 1980) to determine the three principal components of the CS tensors (δ11 ≥ δ22 ≥ δ33) as well as the span (Ω = δ11-δ33) and skew (κ = 3(δ22-δiso)/Ω) of these tensors. The data are presented in Table 2, along with previously reported data for pure ChB donor 1.
Fig. 3.
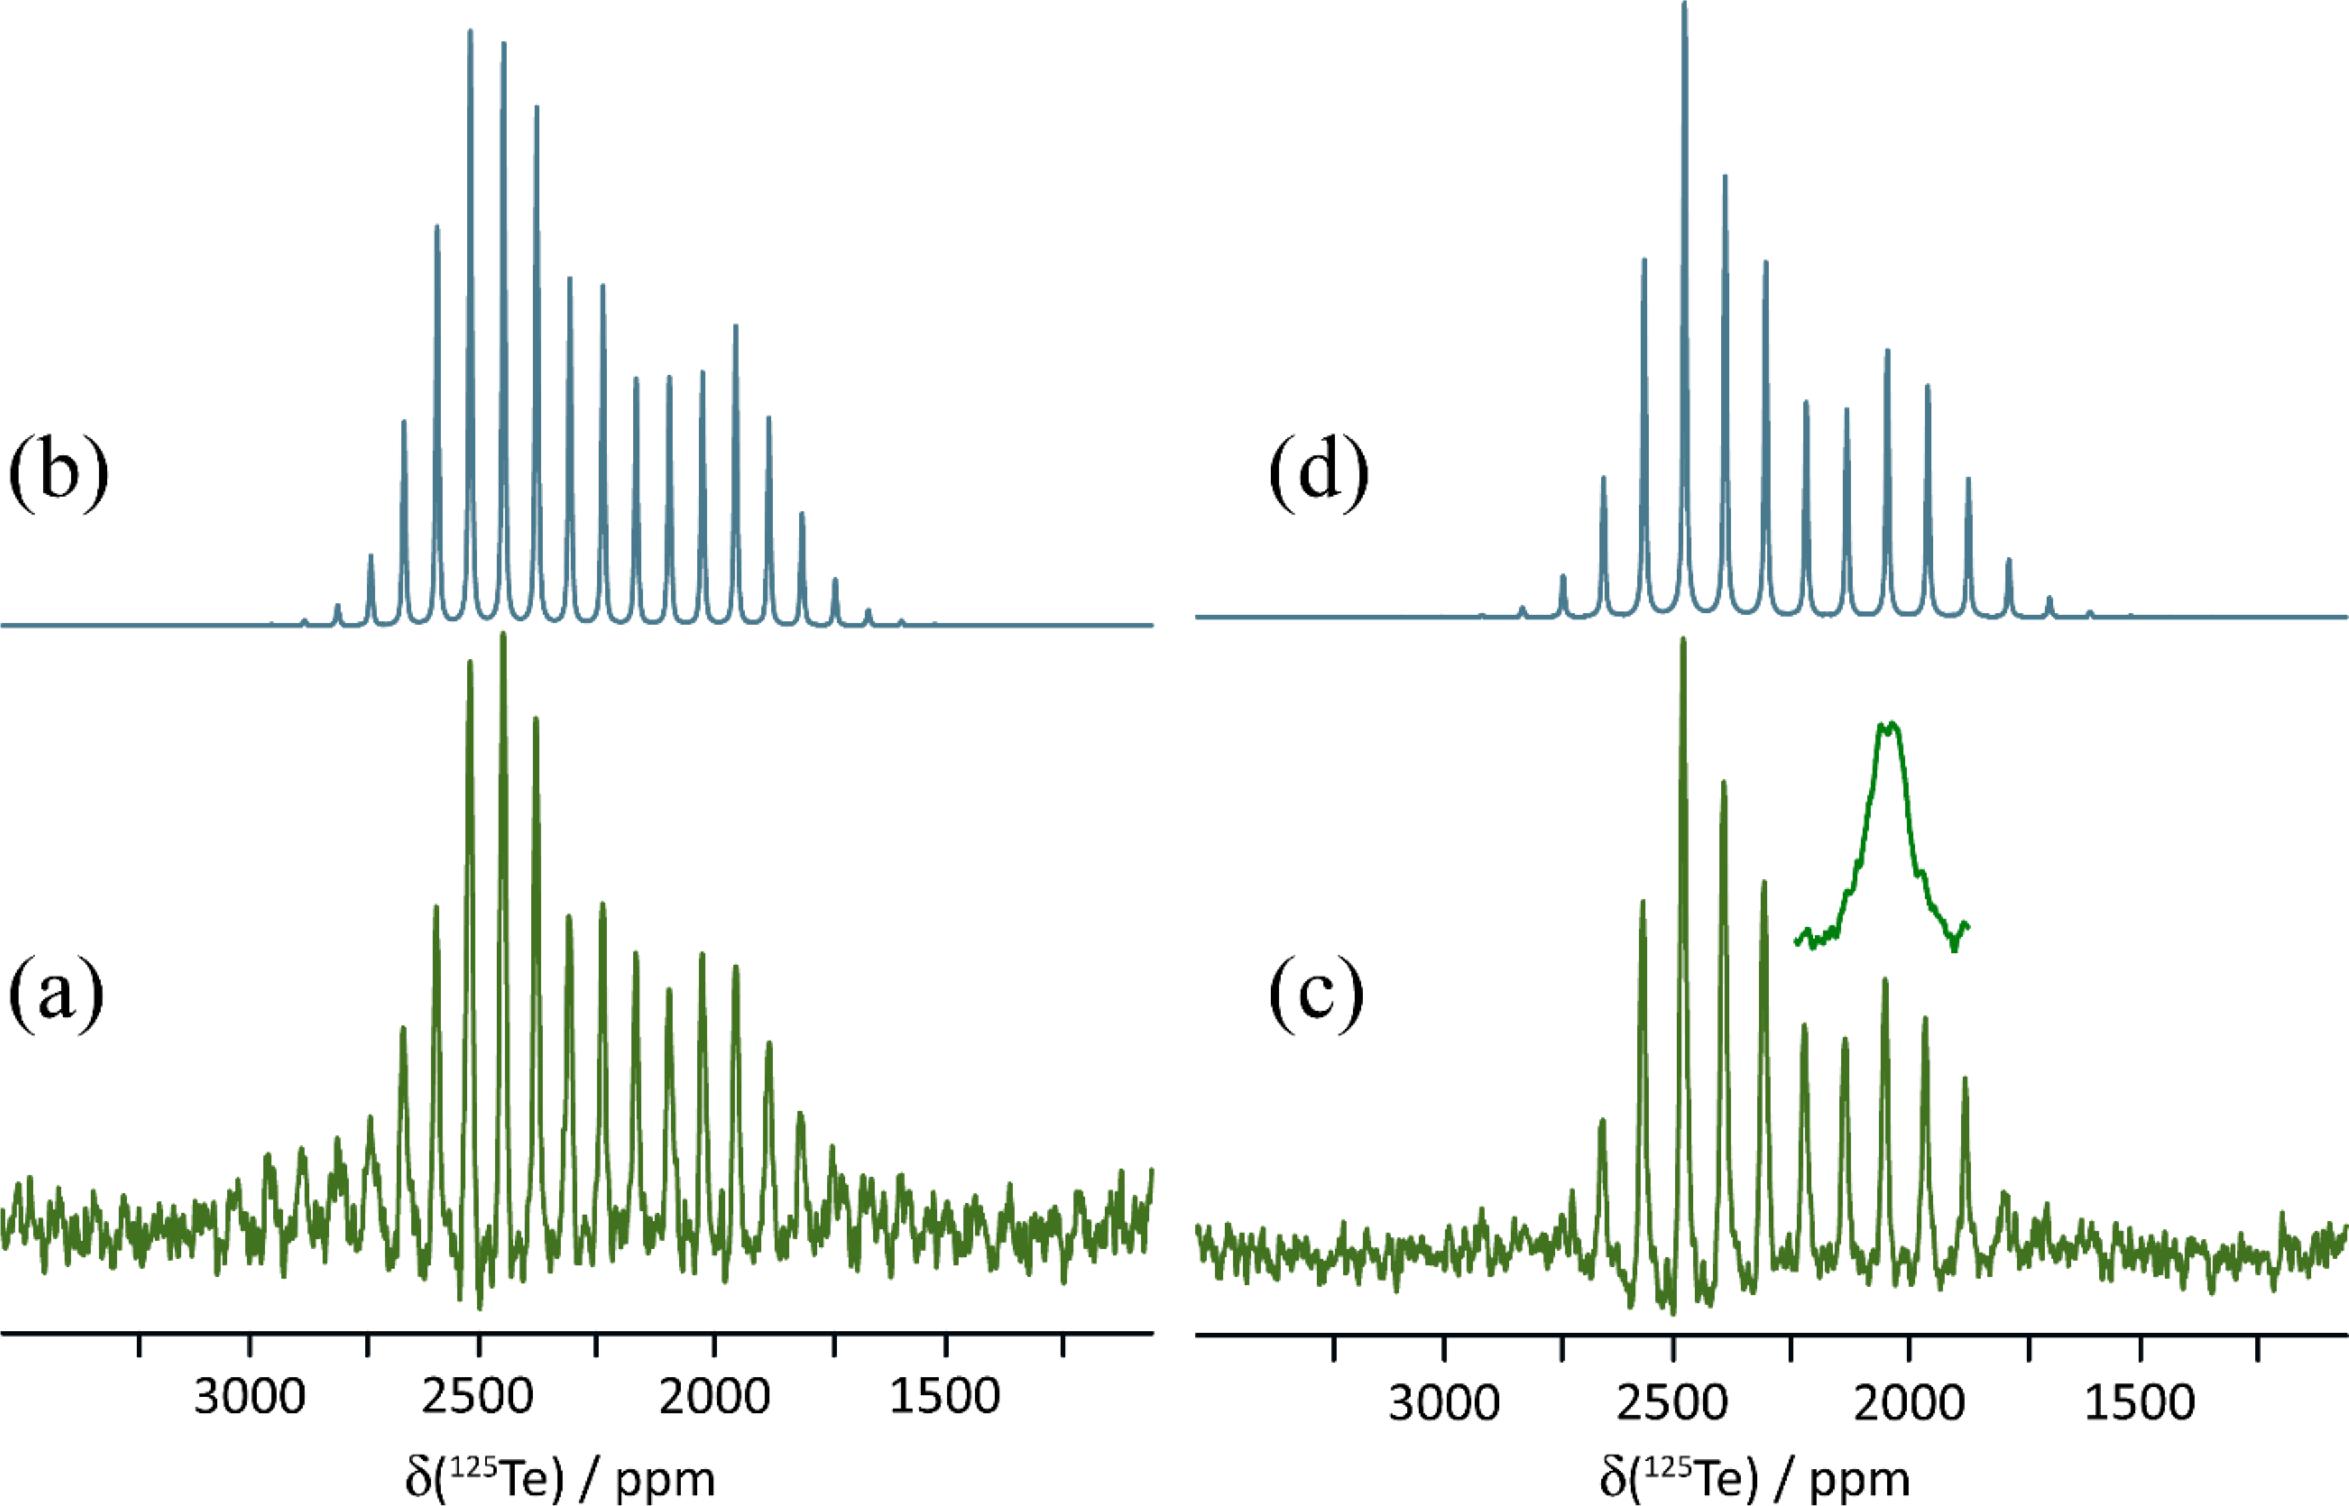
Fig. 4.

Fig. 5.
Pure 1 crystallizes in the P212121 space group and features a single crystallographically distinct tellurium atom. Each tellurium atom has two σ-holes available for chalcogen bonding with two additional molecules of 3,4-dicyano-1,2,5-telluradiazole, with electron donation coming from the ring nitrogens. The two resulting Te…N chalcogen bonds have distances of 2.659 and 2.767 Å, and N-Te…N angles of 152.1° and 149.1°, respectively. These interactions result in planar sheets of molecules within the crystal. The strength of these chalcogen bonds may be gauged via the reduced distance parameter (Table 1), RChB = dChB/ΣvdW (where dChB is the distance between Te and N, and ΣvdW is the sum of the van der Waals radii of Te and N). The RChB values for 1 are 0.74 and 0.77. The 125Te CS tensor data for 1 (Table 2) have been reported previously; briefly, the isotropic CS is 2332.8 ppm and the span is 1268 ppm (Kumar et al. 2020b). The observation of one CS is consistent with the presence of a single crystallographically distinct tellurium atom in the unit cell of 1.
Table 1.
| rTe…X/Å | RChBa | θTe…XC/° | CCDC ref. | |
|---|---|---|---|---|
| 1 | 2.659 (X = N) | 0.74 | 152.1 | AREGEK |
| 2.767 (X = N) | 0.77 | 149.4 | ||
| 1a-mol1b | 2.546 (X = N) | 0.71 | 166.2 | BIHQOB |
| 1a-mol2b | 2.533 (X = N) | 0.70 | 163.8 | BIHQOB |
| 1b | 3.038 (X = S) | 0.79 | 166.8 | BIHQUH |
| 1c | 3.126 (X = Se) | 0.79 | 167.2 | BIHRAO |
a
Van der Waals radii used: 2.06 Å for Te; 1.55 Å for N; 1.80 Å for S; 1.90 Å for Se (Bondi 1964).
b
“mol1” and “mol2” refer to the two crystallographically distinct molecules in the unit cell.
Table 2.
| Sample | Nucleus | δiso (ppm) | Ω | κ | δ11 (ppm) | δ22 (ppm) | δ33 (ppm) |
|---|---|---|---|---|---|---|---|
| 1a | 125Te | 2332.8(0.1) | 1268 (3) | 0.49 | 2863(5) | 2540 (3) | 1595 (4) |
| KOCN | 15N | 90.7 (0.2) | 231(1) | 1.00 | 168 (1) | 168 (1) | −64 (1) |
| 1a | 15N (site 1) | 79.5 (0.2) | 222 (5) | 0.63 | 167 (5) | 126 (3) | −55 (4) |
| 1a | 15N (site 2) | 77.8 (0.2) | 191 (7) | 0.63 | 153 (6) | 118 (3) | −38 (5) |
| 1a | 125Te | 2313.1 (1)b | 740 (6) | 0.49 | 2623 (10) | 2434 (6) | 1883 (7) |
| 1b | 125Te | 2389.2 (1) | 1168 (5) | 0.48 | 2880 (2) | 2576 (1) | 1712 (3) |
| 1c | 125Te | 2376.3 (0.7) | 1136 (14) | 0.34 | 2880 (2) | 2504 (9) | 1744 (13) |
a
From Kumar et al. 2020b.
b
There is an unresolved splitting due to two crystallographically distinct sites with peak maxima of approximately 2315.7 and 2311.1 ppm.
Salt cocrystal 1a crystallizes in the P21/c space group and features two crystallographically distinct tellurium atoms, each of which are engaged in chalcogen bonding via a single σ-hole to the nitrogen atom of the cyanate ion. These nitrogen atoms are also each in proximity to a potassium cation, each of which are complexed by an 18-crown-6 molecule. The two tellurium sites, and the geometries of the two Te…N chalcogen bonds, are very similar. For example, the two Te…N distances are 2.546 and 2.533 Å and the two N-Te…N angles are 166.2 and 163.8°. The 125Te MAS NMR experiments show inconclusive evidence for these two similar sites, with a possibly unresolved doublet with peak maxima at approximately 2315.7 and 2311.1 ppm (Fig. 3). The spinning sideband pattern was analyzed to obtain CS tensor parameters using one isotropic CS at 2313.1 ppm (Fig. 3). The resulting span of the tensor is 740 ppm, a decrease of 528 ppm relative to pure 1.
Salt cocrystal 1b crystallizes in the P1 space group and has one crystallographically distinct tellurium atom which engages in chalcogen bonding with the sulfur atom of the thiocyanate anion at a distance of 3.038 Å. The N-Te…S chalcogen bond angle is 166.8°. 125Te MAS NMR shows a characteristic spinning sideband manifold about the single isotropic CS, consistent with the X-ray crystal structure (Fig. 4). The isotropic CS is 2389.2 ppm and the span of the tensor is 1168 ppm, much larger than that for 1a, but still smaller than for the pure chalcogen bond donor 1.
Finally, salt cocrystal 1c crystallizes in the P1 space group and has one crystallographically distinct tellurium atom which engages in chalcogen bonding with the selenium atom of the selenocyanate anion at a distance of 3.126 Å. The N-Te…Se chalcogen bond angle is 167.2°. Again, the 125Te MAS NMR spectrum is consistent with the X-ray diffraction structure, showing one isotropic CS at 2376.3 ppm (Fig. 5). The span of the CS tensor, 1136 ppm, is again smaller than that seen for the pure donor 1.
The principal components of the 125Te CS tensors measured presently, as well as the isotropic CSs and CS tensor spans, are consistent with data acquired for other similar tellurium-based systems featuring chalcogen bonds (Kumar et al. 2020b; Nag et al. 2022). When forming cocrystals of 3,4-dicyano-1,2,5-telluradiazole, it is a general conclusion that the isotropic 125Te CS can either increase or decrease modestly, and that the span of the tellurium CS tensor almost always decreases, often by hundreds of ppm.
The 15N MAS NMR spectra of isotopically 15N-enriched KOC15N and 15N-1a are shown in Fig. 6. The X-ray diffraction structure of KOCN includes oxygen and nitrogen occupying the same sites with a 50:50 occupancy, thus suggesting the possibility of static or dynamic disorder in the structure. This compound packs in the I4/mcm space group and the nitrogen/oxygen sites have local C2v symmetry. This symmetry means that the 15N CS tensor may have up to three unique principal components. Fitting of the 15N MAS NMR spinning sideband manifold results in a CS tensor with axial symmetry (δiso = 90.7 ppm and Ω = 231 ppm). Although the fitting process can be subject to errors (Hodgkinson and Emsley 1997), a perfectly axially symmetric tensor would be consistent with the two components which lie perpendicular to the cyanate axis having very similar magnitudes. DFT calculations of the nitrogen shielding tensor (vide infra) confirm that there is no dynamic disorder of the cyanate ions at room temperature, as the magnitude of Ω(15N) is not averaged compared to the values obtained by DFT at 0 K.
Fig. 6.
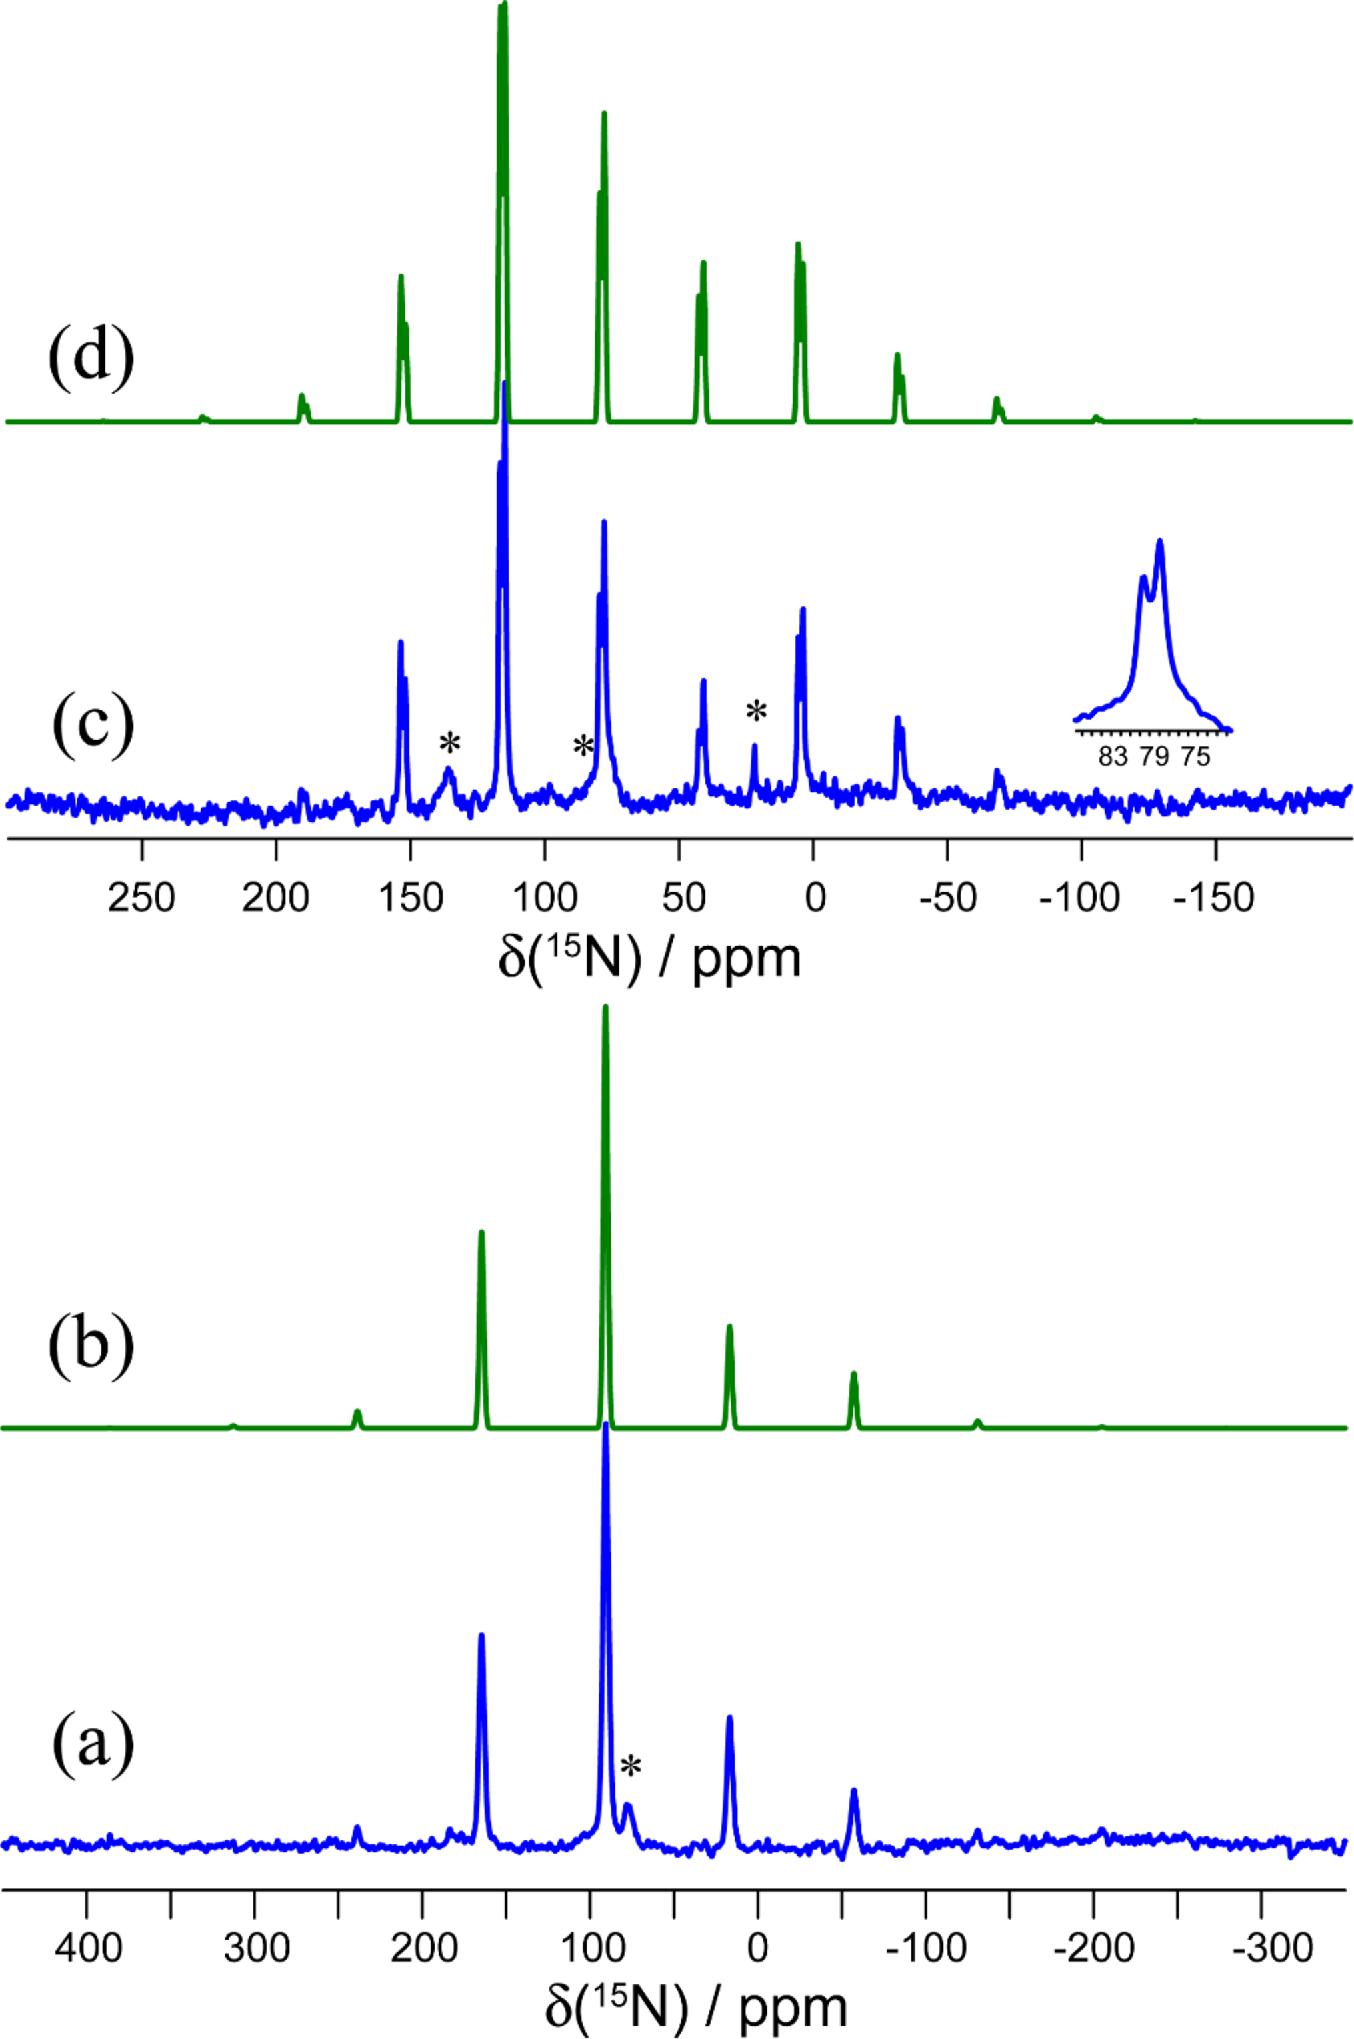
The 15N MAS NMR spectrum of 15N-1a presents two distinct CSs and spinning sideband patterns, consistent with the presence of two crystallographically distinct cyanate ions in the X-ray diffraction structure of this salt cocrystal (Fig. 6). The isotropic CSs are 79.5 and 77.8 ppm, and the spans of these tensors are 222 and 191 ppm, respectively. It is seen that both the isotropic shifts and the spans are reduced compared to those in pure KOCN. This is mainly attributed to changes in δ33, the principal component which lies along the cyanate ion's axis. Its value increases from -64 ppm in KOCN to -55 and -38 ppm in each of the two sites in 1a. Furthermore, the axial symmetry of the 15N CS tensor in KOCN is lost upon formation of a chalcogen bond to tellurium in 1a. This can be quantified by the decrease in the skew of the tensor from 1.00 to 0.63, or alternatively by the decrease in the value of the intermediate component δ22 from 168 ppm to 126 ppm (site 1) or 118 ppm (site 2). This loss of axial symmetry is also indicative of a decrease in symmetry at nitrogen in the cyanate ion.
DFT calculations of magnetic shielding tensors
Density functional theory calculations of the tellurium magnetic shielding tensors in 1, 1a, 1b, and 1c were carried out using a variety of approaches. The results of these calculations are summarized in Table 3. Four sets of data are presented. The first two, carried out using a ZORA relativistic treatment as implemented in ADF, use a cluster model, the PBE0 functional, and the TZ2P basis set. In one set of calculations, only a scalar relativistic treatment is used, while in the second one a spin–orbit relativistic treatment is used. The other two sets of calculations, carried out using the GIPAW approach as implemented in CASTEP, used the RPBE functional. In one set of calculations, the default Koelling–Harmon scalar relativistic method is used, while in the second one the scalar relativistic ZORA method is employed. These various sets of calculations help to determine the relative importance of including the crystal lattice in the model used (as is done using periodic boundary conditions in the GIPAW approach) compared to the model used to treat relativistic effects. A cursory inspection of the data in Table 3 suggests that the ZORA-spin orbit method, using a cluster model, provides results in best agreement with the experimental data.
Table 3.
| 1 | 1a-mol1 | 1a-mol2 | 1b | 1c | |
|---|---|---|---|---|---|
| Cluster model, PBE0/TZ2P, ZORA-so (ADF) | |||||
| σ11/ppm | 688.4 | 910.8 | 852.6 | 311.0 | 296.9 |
| σ22/ppm | 939.2 | 1125.6 | 1161.9 | 911.8 | 936.1 |
| σ33/ppm | 2029.4 | 1641.2 | 1638.3 | 1763.5 | 1697.7 |
| σiso/ppm | 1219.0 | 1225.9 | 1217.6 | 995.4 | 976.9 |
| Ω /ppm | 1341.0 | 730.4 | 785.7 | 1452.5 | 1400.8 |
| κ | 0.63 | 0.41 | 0.21 | 0.17 | 0.09 |
| Cluster model, PBE0/TZ2P, ZORA scalar (ADF) | |||||
| σ11/ppm | 338.6 | 365.2 | 375.4 | -38.0 | -43.0 |
| σ22/ppm | 606.3 | 722.3 | 784.0 | 536.1 | 545.4 |
| σ33/ppm | 1231.9 | 852.5 | 795.4 | 978.8 | 974.0 |
| σiso/ppm | 725.6 | 646.7 | 651.6 | 492.3 | 492.1 |
| Ω /ppm | 893.4 | 487.3 | 420.0 | 1016.8 | 1016.9 |
| κ | 0.40 | −0.47 | −0.95 | −0.13 | −0.16 |
| Periodic boundary conditions, GIPAW, RPBE, 700 eV, Koelling–Harmon scalar (CASTEP) | |||||
| σ11/ppm | 248.8 | 349.8a | 376.3a | 119.4 | 136.5 |
| σ22/ppm | 383.1 | 727.2a | 828.4a | 506.1 | 658.3 |
| σ33/ppm | 977.0 | 749.1a | 872.9a | 793.7 | 874.8 |
| σiso/ppm | 548.3 | 608.7a | 692.5a | 473.0 | 556.5 |
| Ω /ppm | 692.2 | 399.2a | 496.6a | 674.3 | 738.2 |
| κ | 0.72 | −0.89a | −0.82a | −0.15 | −0.41 |
| Periodic boundary conditions, GIPAW, RPBE, 700 eV, ZORA scalar (CASTEP) | |||||
| σ11/ppm | 737.7 | 799.2a | 822.2a | 582.7 | 598.7 |
| σ22/ppm | 826.5 | 1145.6a | 1239.7a | 941.5 | 1083.1 |
| σ33/ppm | 1378.7 | 1166.6a | 1282.8a | 1208.6 | 1283.9 |
| σiso/ppm | 981.0 | 1037.1a | 1114.9a | 910.9 | 988.6 |
| Ω /ppm | 641.0 | 367.4a | 460.6a | 625.9 | 685.2 |
| κ | 0.72 | −0.89a | −0.81a | −0.15 | −0.41 |
a
500 eV cut-off. See Supplementary Material for convergence tests.
ADF: Amsterdam Density Functional; DFT: density functional theory; GIPAW: gauge-including projector-augmented wave; ZORA: zeroth-order regular approximation.
Selected data from Table 3 are plotted in Figs. 7 and 8. In Fig. 7, the experimental 125Te CS tensor spans (Ω), in navy blue, are compared to the DFT-computed values. Comparing the spans is one way to assess the computed values, as it removes the impact of imperfections in the computed isotropic magnetic shielding constant. The experimental values of the spans range from a low of 740 ppm for 1a to a high of 1268 ppm for pure chalcogen bond donor 1. The ZORA-spin orbit calculations (ADF) provide the best agreement with these experimental data; in the case of molecule 2 of salt cocrystal 1a, the computed value of 730.4 ppm is less than 2% below the experimental value. The computed value for 1b is in worst agreement with experiment, where an overestimation of 24% is seen (1453 ppm vs 1168 ppm). The ZORA-scalar calculations (ADF) provide the next-best agreement with experiment, but the spans are consistently underestimated by approximately 10 to 45%. GIPAW calculations using the Koelling–Harman scalar relativistic treatment consistently underestimate the experimental values by up to nearly 50%. Finally, the GIPAW calculations using the ZORA scalar relativistic treatment fare worst in comparison to experiment with most values underestimated by approximately 50%.
Fig. 7.
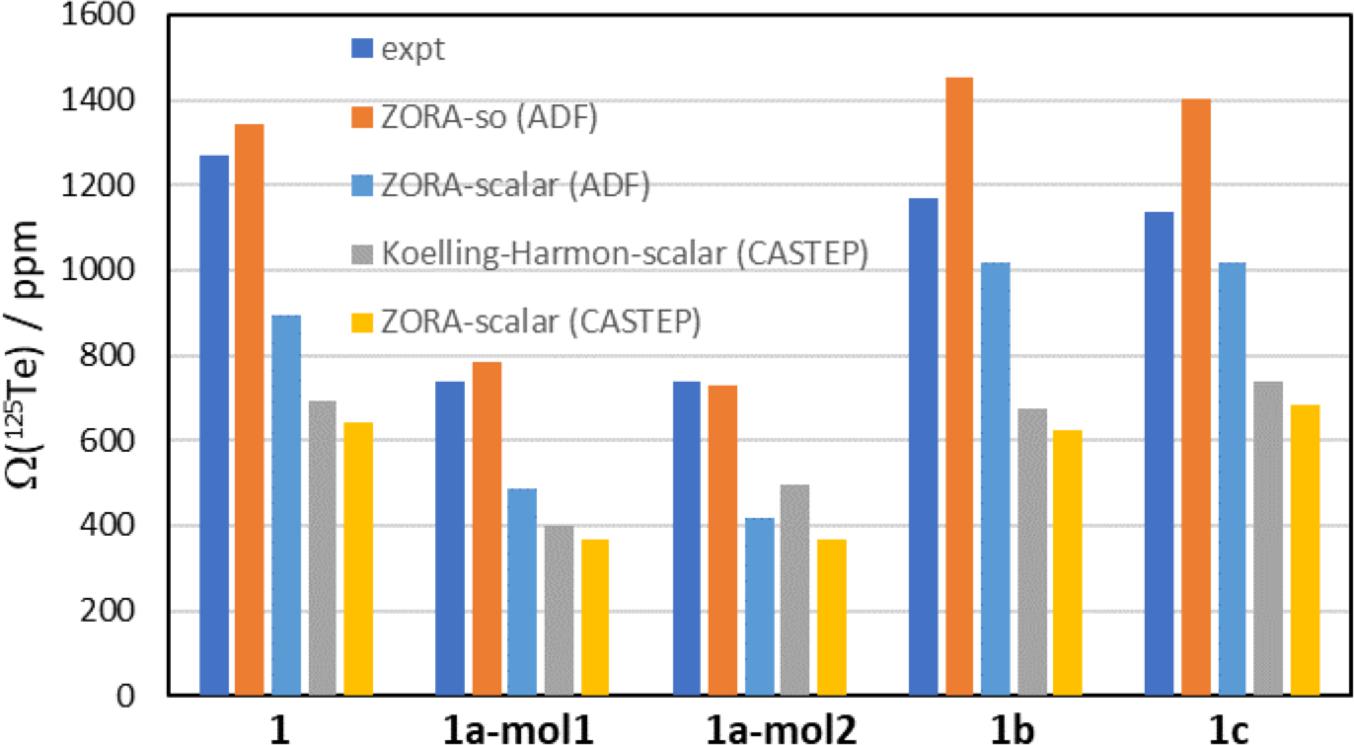
Fig. 8.

A further assessment of the DFT-computed tellurium magnetic shielding tensors is presented in Fig. 8, where the individual principal components are plotted against the experimental CS tensor values for the four computational methods used. Again, the ZORA-spin orbit approach provides the best agreement; the slope of the line of best fit (-1.1304) is the closest to unity among the four methods, the Pearson correlation coefficient of 0.9531 is the highest among the for methods, and the intercept of 3777.6 ppm is the closest to the experimental absolute shielding constant for dimethyltelluride, 4333 ppm. The remaining methods do not fare as well, with slopes as low as -0.4983 for the ZORA-scalar (CASTEP) calculations and R2 values as low as 0.7768 for the Koelling–Harmon (CASTEP) calculations. The computed intercept for the latter set of calculations is also very low, 1869.7 ppm.
From all of these calculations, it may be concluded that the ZORA-spin orbit approach, using cluster models, provides the best results for the systems studied herein. The substantial role of spin–orbit relativistic effects seems to be the most important consideration. Upward spin–orbit shifts of several hundred ppm in each the principal components of the magnetic shielding tensor are seen when comparing the ZORA-scalar results to the ZORA-spin orbit results. These spin–orbit effects are much more important in the systems studied here than any potential effects on the magnetic shielding tensors from the surrounding molecules in the crystal lattice. This finding is consistent with previous literature reports on unrelated tellurium-containing systems (Alkan and Dybowski 2018).
DFT-computed 15N magnetic shielding tensors for KOCN and for the salt cocrystals 1a, 1b, and 1c are shown in Table 4. The same four methods used above for 125Te magnetic shielding tensors were also used to calculate the 15N magnetic shielding tensors, except in the case of KOCN where building a cluster model was not realistic. The nuclear magnetic shielding values have also been converted to CSs using the experimental absolute shielding scale for nitrogen. As nitrogen is a lighter element, the impact of including spin–orbit relativistic effects is inconsequential for the systems studied here (i.e., changes in the components are less than 0.5 ppm). The computed 15N isotropic CS for KOCN, 80.7 ppm (GIPAW, RPBE, 500 eV, Koelling–Harmon) is 10 ppm lower than the experimental value of 90.7 ppm. The span of the 15N CS tensor for KOCN is calculated at the same level of theory to be 221.4 ppm, again about 10 ppm lower than the experimental value of 231(1) ppm. These discrepancies arise entirely due to underestimations of the δ11 and δ22 principal components, i.e., those which lie perpendicular to the cyanate principal axis. The δ33 component is calculated more easily as, in the limit of an isolated linear system, the paramagnetic contribution to the shielding constant is zero. It is seen that the experimental and computed values of δ33(15N) in KOCN are in agreement (-64(1) ppm and -63.9 ppm, respectively). The DFT calculations of 15N CS tensors for both crystallographic sites in salt cocrystal 1a, which features a chalcogen bond between the cyanate nitrogen atom and the tellurium atom, do not generally reproduce the experimentally observed decrease in span. When the same computational method is used for KOCN and for 1a (GIPAW, RPBE, 500 eV, Koelling–Harmon), an increase in the span from 221.4 ppm to 248.2 ppm is seen for site 1, and a small increase from 221.4 ppm to 222.6 ppm is seen for site 2. This is dominated by an increase in δ11, which is not seen experimentally.
Table 4.
| σ11/ppm | σ22/ppm | σ33/ppm | δ11/ppm | δ22/ppm | δ33/ppm | δiso/ppm | Ω/ppm | κ | |
|---|---|---|---|---|---|---|---|---|---|
| KOCNa | 87.1 | 96.3 | 308.5 | 157.6 | 148.4 | −63.9 | 80.7 | 221.4 | 0.92 |
| KOCNb | 87.4 | 96.6 | 308.6 | 157.2 | 148.0 | −64.0 | 80.4 | 221.2 | 0.92 |
| 1a-mol1a | 52.4 | 75.5 | 300.6 | 192.2 | 169.1 | −56.0 | 101.7 | 248.2 | 0.81 |
| 1a-mol2a | 64.3 | 81.4 | 286.9 | 180.4 | 163.2 | −42.3 | 100.4 | 222.6 | 0.85 |
| 1a-mol1b | 52.6 | 75.8 | 300.8 | 192.0 | 168.8 | −56.2 | 101.6 | 248.2 | 0.81 |
| 1a-mol2b | 64.7 | 81.8 | 287.1 | 179.9 | 162.8 | −42.5 | 100.1 | 222.4 | 0.85 |
| 1a-mol1c | 64.2 | 98.2 | 313.7 | 157.1 | 131.8 | −54.7 | 78.1 | 249.6 | 0.73 |
| 1a-mol2c | 87.6 | 112.8 | 299.3 | 180.5 | 146.4 | −69.2 | 85.9 | 211.7 | 0.76 |
| 1a-mol1d | 69.5 | 98.3 | 337.8 | 151.3 | 122.0 | −65.3 | 69.3 | 268.3 | 0.79 |
| 1a-mol2d | 93.4 | 122.6 | 309.9 | 175.1 | 146.3 | −93.3 | 76.1 | 175.3 | 0.73 |
a
GIPAW, RPBE, 500 eV, Koelling–Harmon.
b
GIPAW, RPBE, 500 eV, ZORA scalar.
c
ADF, PBE0/TZ2P, ZORA scalar.
d
ADF, PBE0/TZ2P, ZORA spin orbit.
ADF: Amsterdam Density Functional; DFT: density functional theory; GIPAW: gauge-including projector-augmented wave; ZORA: zeroth-order regular approximation.
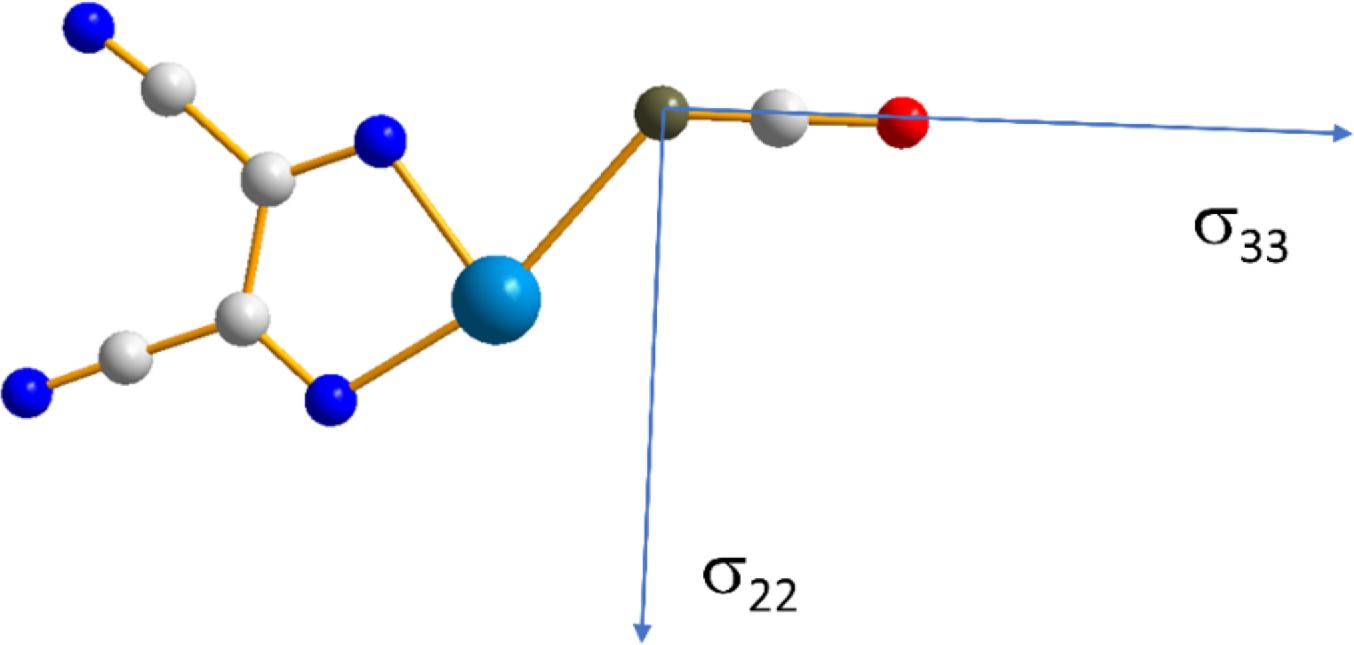
In addition to the impact of chalcogen bonding on the magnitudes of the tellurium and nitrogen magnetic shielding tensors, the impact on the orientations of these tensors in the molecular frame were considered. This absolute orientational information is not available from NMR studies of powdered samples; rather, approaches such as single-crystal NMR must be used. Recent experimental single-crystal NMR work from our group demonstrated how changes in CS tensor orientations could be correlated with halogen bond geometry in a series of phosphine oxide-iodoperfluorobenzene cocrystals (Xu et al. 2019). Presently, the results of DFT computations of the tellurium and nitrogen tensor orientations are assessed. As shown in Fig. 9, in both pure chalcogen bond donor 1, and in each of the cocrystals 1a, 1b, and 1c, the largest (and pseudounique) component of the 125Te magnetic shielding tensor lies approximately perpendicular to the telluradiazole plane. In pure 1, the structure of which features self-complementary Te…N chalcogen bonds, the direction of the least shielded σ11 component bisects the N-Te-N angle of the telluradiazole ring. The orientation of σ11 is modified away from this bisector as a result of chalcogen bonds to N, S, or Se. This change in orientation is also clearly reflective of the change in local symmetry about the telluradiazole ring. Conversely, the change in the orientation of the nitrogen CS tensor in 1a when compared to pure KOCN is negligible (Fig. 10); a deviation of the σ33 component of only 3° from the cyanate axis is noted in 1a.
Fig. 9.
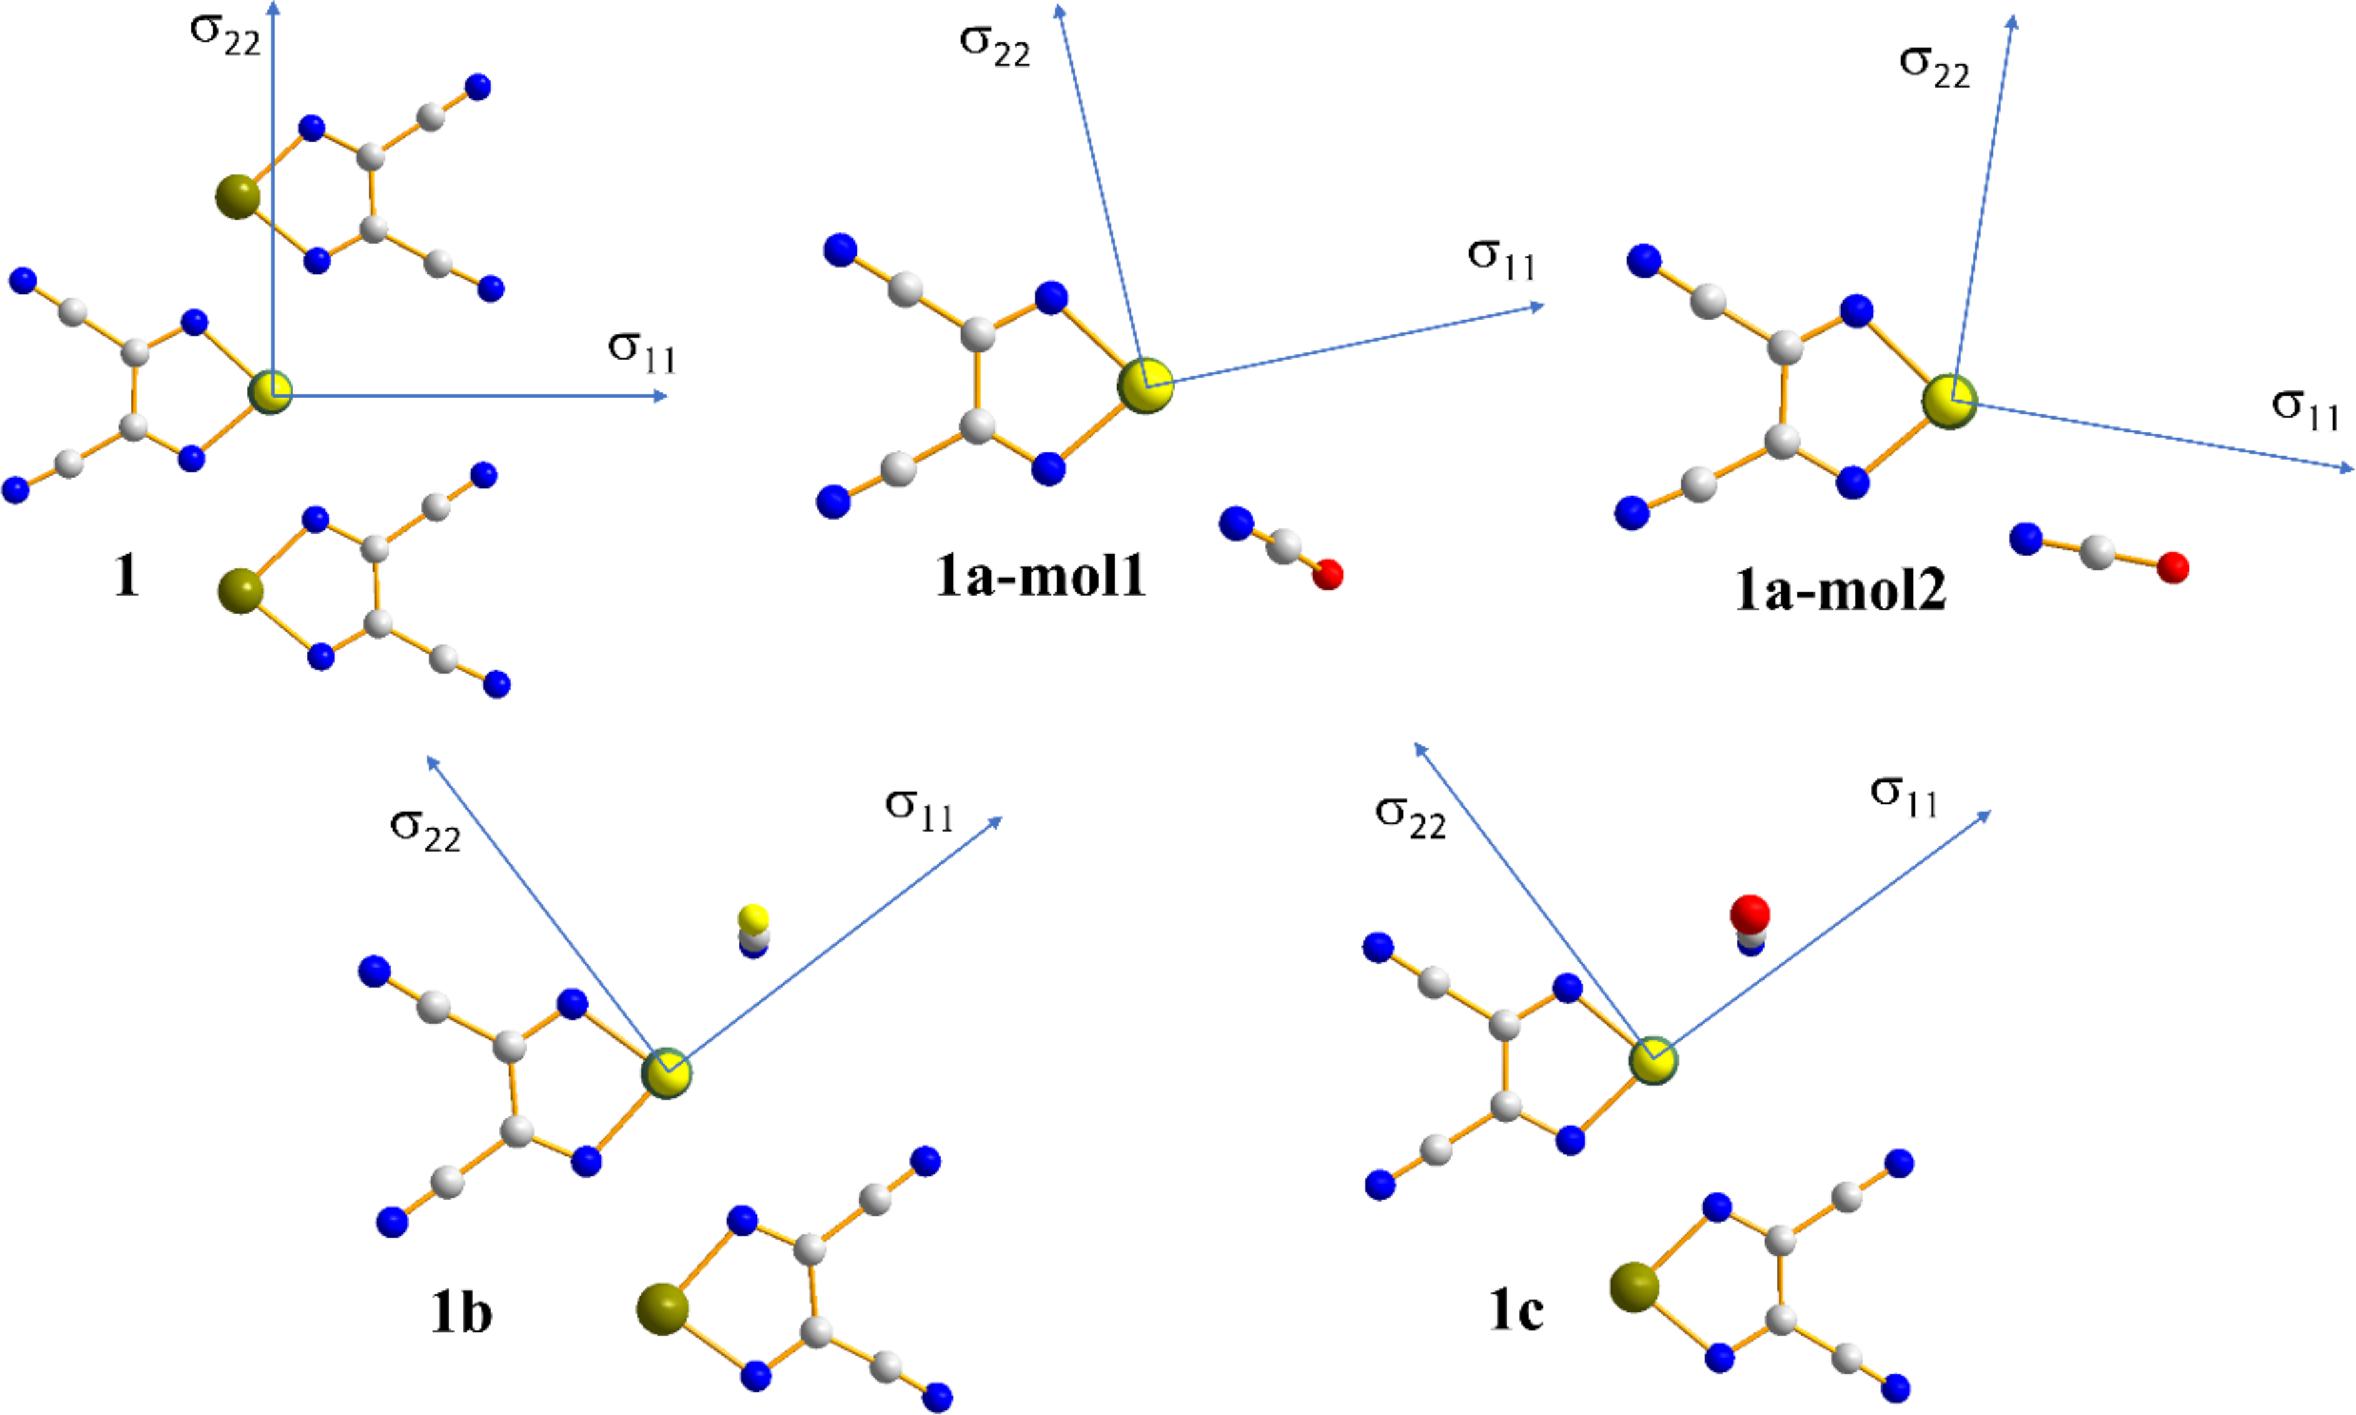
Fig. 10.
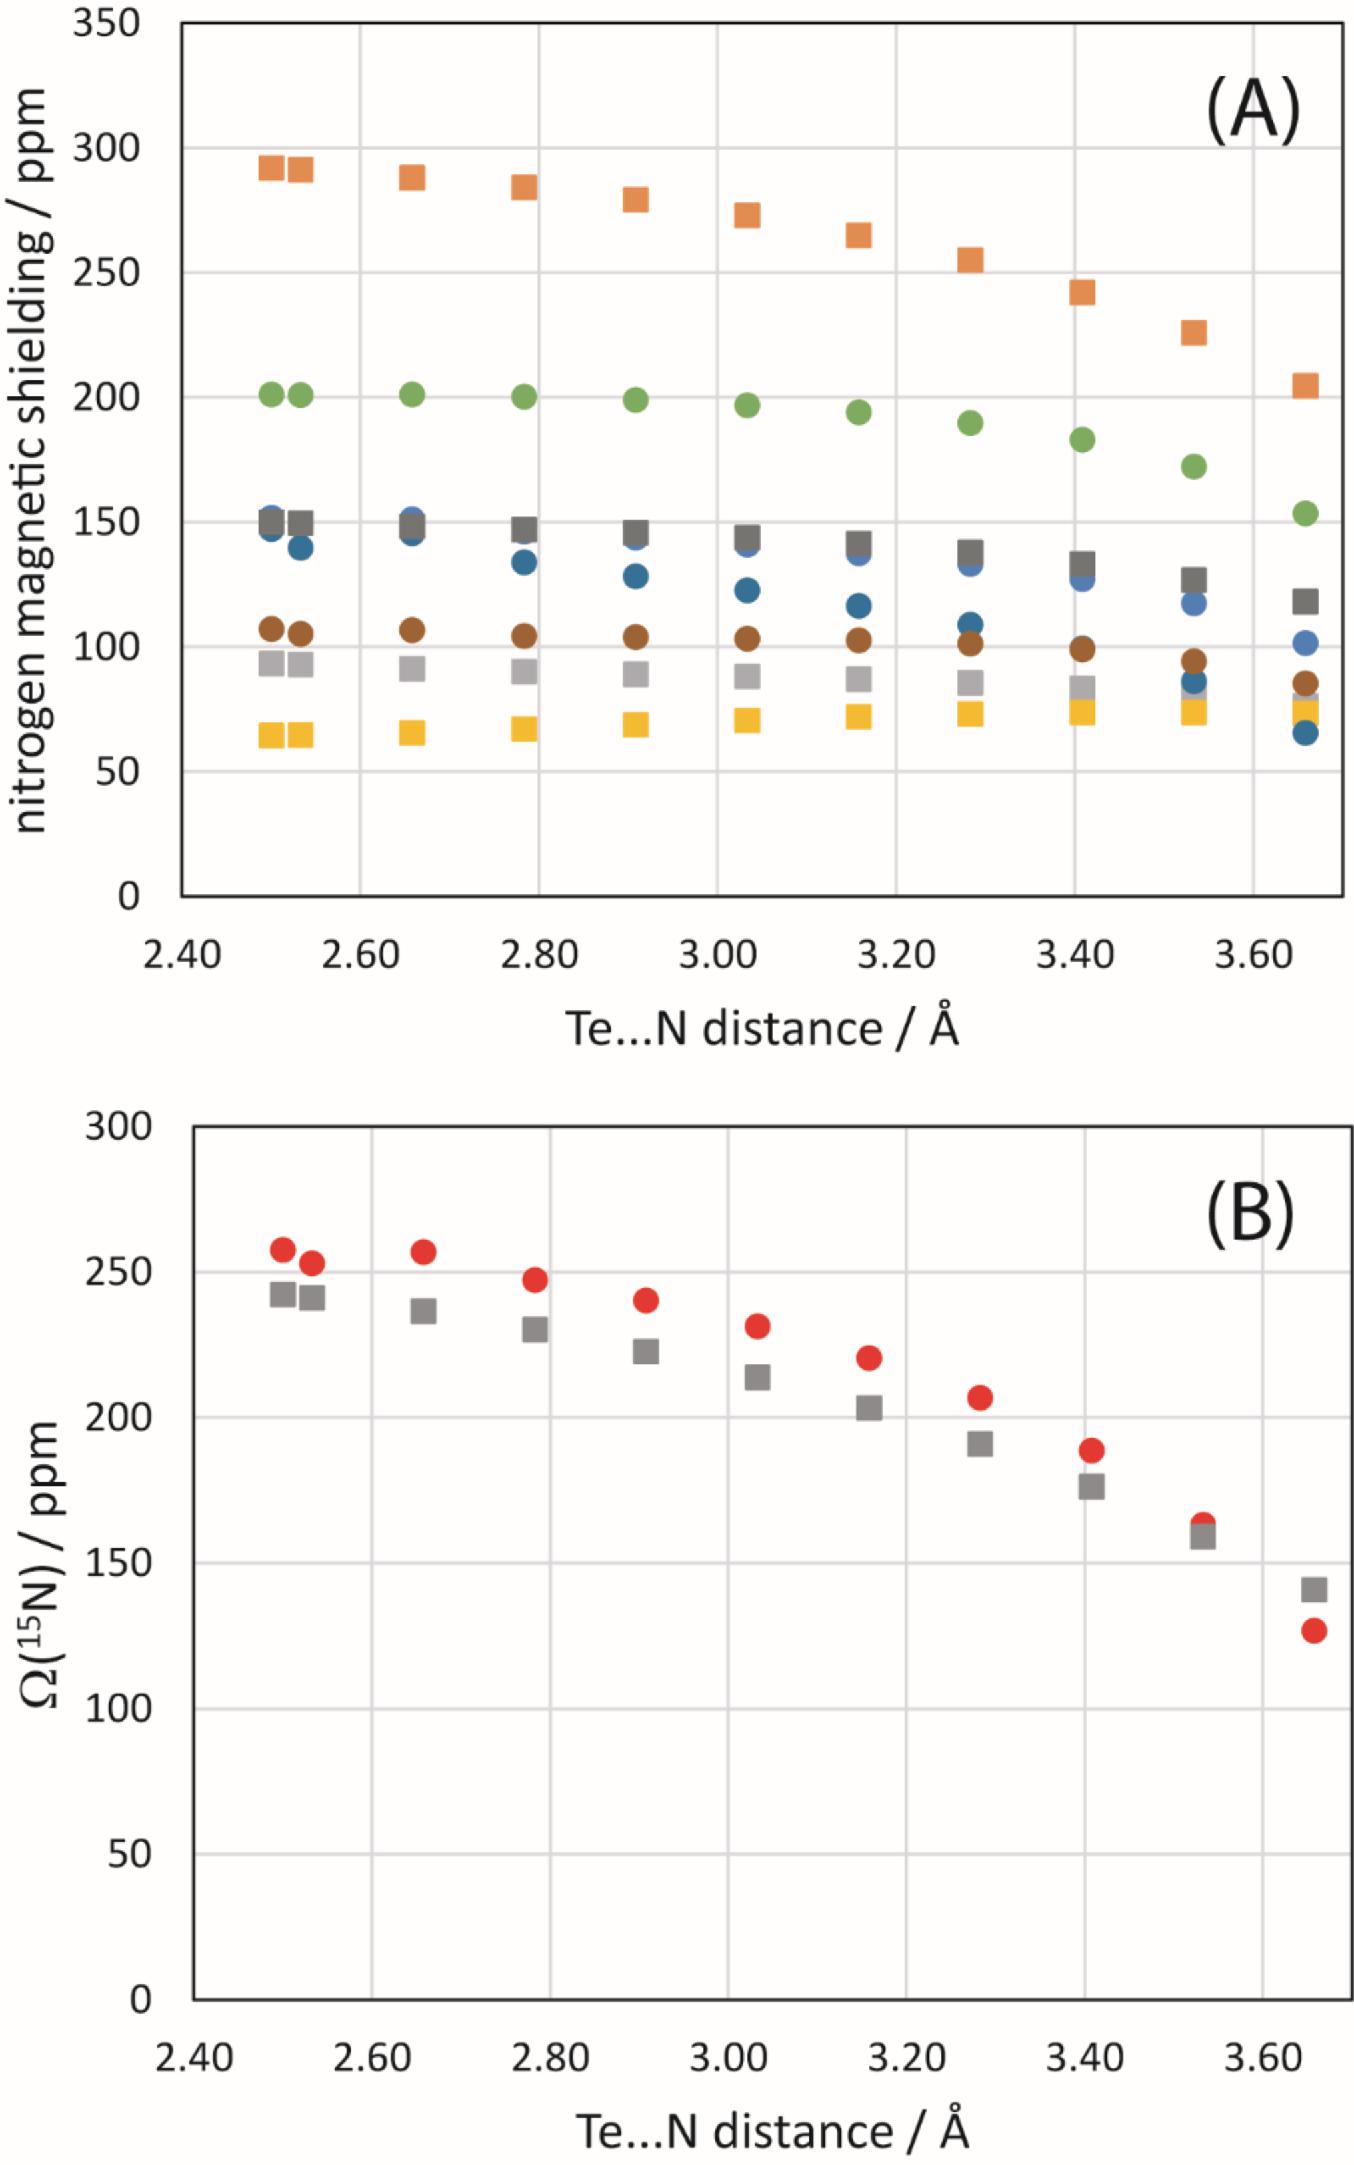
Finally, a simple model of 1 and the NCO− anion was constructed and the Te…N distance systematically modified to assess its impact on the 125Te and 15N magnetic shielding tensors of the chalcogen bond donor and acceptor, respectively. B3LYP/DGDZVP and ZORA-so (SAOP/QZ4P) calculations were both performed. The general trend noted for 125Te (Fig. 11) is that the span of the tellurium shielding tensor decreases as the chalcogen bond shortens and strengthens. This finding is consistent with the experimental data and with the other sets of calculations discussed above. In the case of 15N in the cyanate anion, an increase in the span is instead noted (Fig. 12) as the chalcogen bond shortens. This is generally consistent with the DFT results in Table 4, but in contrast with the experimental observation that the span of the 15N CS tensor decreases when engaged in a chalcogen bond in 1a. At the shortest relevant distances shown in Fig. 12, however, the span of the nitrogen magnetic shielding tensors becomes almost invariant to further reduction in the Te…N distance, suggesting that in this regime other structural factors may contribute to the observed experimental decrease in span.
Fig. 11.
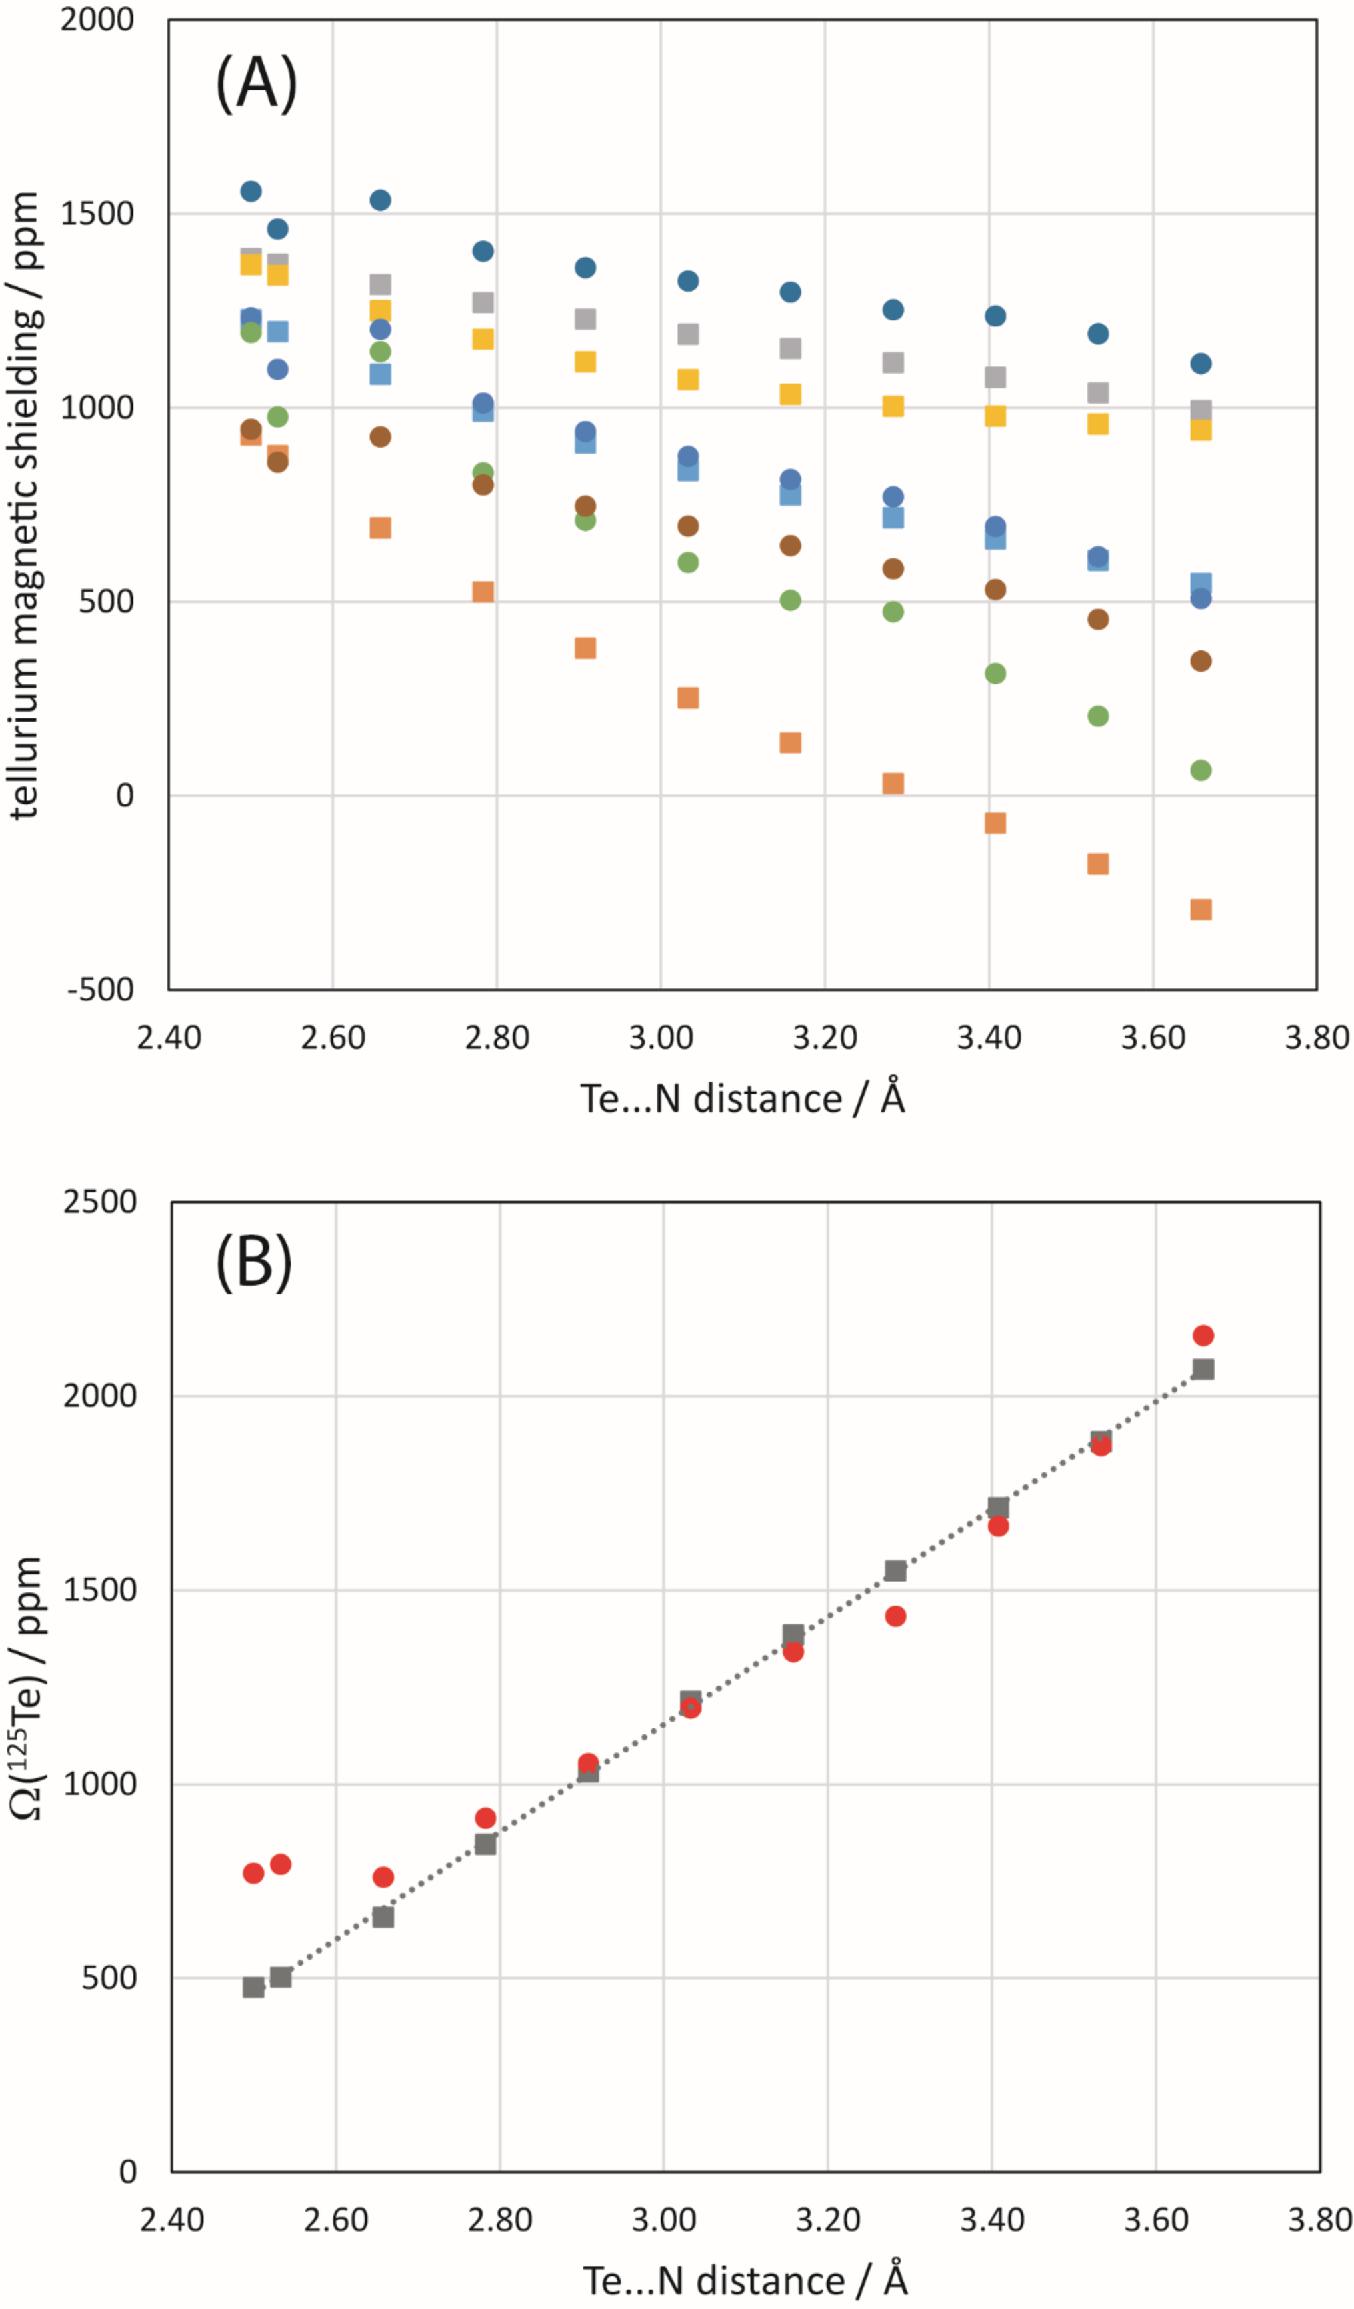
Fig. 12.
Conclusions
Tellurium-125 CS tensors have been measured and used as probes of chalcogen bonding in a series of three analogous salt cocrystals. These appear to be the first such measurements for chalcogen-bonded salt cocrystals. The 125Te isotropic CS is seen to increase or decrease upon formation of the salt cocrystals, while the span of the CS tensor consistently decreases as a result of the formation of new chalcogen bonds. These findings are consistent with prior work on neutral cocrystal systems. No simple correlations with chalcogen bond distance or angle are observed, suggesting that even in a series of analogous (but not isomorphic) systems, long-range crystal packing effects contribute non-trivially to the 125Te CS tensors. The 15N CS tensors were measured for pure potassium cyanate and for its chalcogen-bonded salt cocrystal. These data ruled out dynamic disorder of the cyanate ions at room temperature in pure KOCN. The 15N isotropic CS and CS tensor span both decreased upon formation of a chalcogen bond to tellurium.
Extensive DFT calculations of the 125Te and 15N magnetic shielding tensors provided some degree of agreement with experiment, but also highlighted some of the difficulties in describing systems where both spin–orbit relativistic effects and long-range crystal packing effects are important. Computed 125Te tensor orientations show a moderate response to the formation of chalcogen bonds in the salt cocrystals studied here. The inclusion of spin–orbit relativistic effects was found to be crucial to achieve improved agreement with the experimental 125Te CS tensors.
In conclusion, this work offers new experimental and computational insight into chalcogen bonds in solids via 125Te and 15N CS tensors. In particular, in the case of [K(18-crown-6)]+ 3,4-dicyano-1,2,5-telluradiazole-OC15N−, the simultaneous NMR response of both the donor and acceptor atoms in the same chalcogen bond has been assessed through measurement of their respective CS tensors.
Acknowledgements
D. L. B. thanks the Natural Sciences and Engineering Research Council of Canada for funding. We are grateful to Shubha Gunaga, Dr. Jeffrey Ovens, and Sarah Osterholm for single-crystal X-ray diffraction measurements, and to Dr. Patrick Szell, Dr. Peter Pallister, and Vincent Morin for NMR technical support. This research was enabled in part by support provided by the Digital Research Alliance of Canada (alliancecan.ca). We thank the members of the Bryce Lab for assistance in proofreading the manuscript.
References
Aakeroy C.B., Bryce D.L., Desiraju G.R., Frontera A., Legon A.C., Nicotra F., et al. 2019. Definition of the chalcogen bond. Pure Appl. Chem. 91: 1889–1892.
Adamo C., Barone V. 1999. Toward reliable density functional methods without adjustable parameters: the PBE0 model. J. Chem. Phys. 110: 6158–6170.
Adiga S., Aebi D., Bryce D.L. 2007. EFGShield—a program for parsing and summarizing the results of electric field gradient and nuclear magnetic shielding tensor calculations. Can. J. Chem. 85: 496–505.
Alkan F., Dybowski C. 2018. Spin-orbit effects on the 125Te magnetic-shielding tensor: a cluster-based ZORA/DFT investigation. Solid State Nucl. Magn. Reson. 95: 6–11.
Autschbach J. 2013. The role of the exchange-correlation response kernel and scaling corrections in relativistic density functional nuclear magnetic shielding calculations with the zeroth-order regular approximation. Mol. Phys. 111: 2544–2554.
Autschbach J., Zurek E. 2003. Relativistic density-functional computations of the chemical shift of 129Xe in Xe@C60. J. Phys. Chem. A 107: 4967–4972.
Baerends E.J., Ziegler T., Atkins A.J., Autschbach J., Baseggio O., Bashford D., et al. ADF 2019.305, SCM, Theoretical Chemistry. Vrije Universiteit, Amsterdam, The Netherlands. Available from http://www.scm.com.
Bauzá A., Seth S.K., Frontera A. 2019. Tetrel bonding interactions at work: impact on tin and lead coordination compounds. Coord. Chem. Rev. 384: 107–125.
Bauzá A., Alkorta I., Elguero J., Mooibroek T.J., Frontera A. 2020. Spodium bonds: noncovalent interactions involving group 12 elements. Angew. Chem. Int. Ed. 59: 17 482–17 487.
Bertani P., Raya J., Bechinger B. 2014. 15 N chemical shift referencing in solid state NMR. Solid State Nucl. Magn. Reson. 61–62: 15–18.
Bondi A. 1964. van der Waals volumes and radii. J. Phys. Chem. 68, 441–451.
Buchanan G.W., Kirby R.A., Ripmeester J.A., Ratcliffe C.I. 1987. Solid phase stereochemical dynamics of 18-crown-6 ether and its KNCS complex as studied by low temperature carbon-13 nuclear magnetic resonance. Tetrahedron Lett. 28: 4783–4786.
Cavallo G., Metrangolo P., Pilati T., Resnati G., Terraneo G. 2014. Naming interactions from the electrophilic site. Crystal Growth Design 14: 2697–2702.
Clark S.J., Segall M.D., Pickard C.J., Hasnip P.J., Probert M.J., Refson K., Payne M.C. 2005. First principles methods using CASTEP. Z. Kristallogr. 220(5–6): 567–570.
Collins M.J., Ripmeester J.A., Sawyer J.F. 1987. CP/MAS tellurium-125 NMR in solids: an example of 125Te-35,37Cl J coupling. J. Am. Chem. Soc. 109: 4113–4115.
Collins M.J., Ripmeester J.A., Sawyer J.F. 1988. Tellurium-125 solid-state NMR spectra and secondary bonding arrangements for some salts of the trimethyltelluronium and triphenyltelluronium cations. Journal of the American Chemical Society, 110, 8583–8590.
Daolio A., Pizzi A., Terraneo G., Frontera A., Resnati G. 2021. Anion⋅⋅⋅anion interactions involving σ-holes of perrhenate, pertechnetate and permanganate anions. Chemphyschem 22: 2281–2285.
Desiraju G.R., Ho P.S., Kloo L., Legon A.C., Marquardt R., Metrangolo P., et al. 2013. Definition of the halogen bond (IUPAC Recommendations 2013). Pure Appl. Chem. 85: 1711–1713.
Eichele K. 1995. HBA—Graphical Herzfeld-Berger Analysis software. Universitat Tuebingen. Version 1.7.3.
Frontera A., Bauzá A. 2018. Regium–π bonds: an unexplored link between noble metal nanoparticles and aromatic surfaces. Chem. Eur. J. 24: 7228–7234.
Gleiter R., Werz D.B., Rausch B.J. 2003. A world beyond hydrogen bonds?—chalcogen–chalcogen interactions yielding tubular structures. Chem. Eur. J. 9: 2676–2683.
Gleiter R., Haberhauer G., Werz D.B., Rominger F., Bleiholder C. 2018. From noncovalent chalcogen–chalcogen interactions to supramolecular aggregates: experiments and calculations. Chem. Rev. 118, 2010–2041.
Grabowski S.J. 2020. Triel bond and coordination of triel centres—comparison with hydrogen bond interaction. Coord. Chem. Rev. 407: 213171.
Haberhauer G., Gleiter R. 2020. The nature of strong chalcogen bonds involving chalcogen-containing heterocycles. Angew. Chem. Int. Ed. 59: 21 236–21 243.
Hammer B., Hansen L.B., Nørskov J.K. 1999. Improved adsorption energetics within density-functional theory using revised Perdew-Burke-Ernzerhof functionals. Phys. Rev. B 59: 7413–7421.
Hendricks S.B., Pauling L. 1925. The crystal structures of sodium and potassium trinitrides and potassium cyanate and the nature of the trinitride group. J. Am. Chem. Soc. 47: 2904–2920.
Herzfeld J., Berger A.E. 1980. Sideband intensities in NMR spectra of samples spinning at the magic angle. J. Chem. Phys. 73: 6021–6030.
Hodgkinson P., Emsley L. 1997. The reliability of the determination of tensor parameters by solid-state nuclear magnetic resonance. J. Chem. Phys. 107: 4808–4816.
Jameson C.J., Jameson A.K., Oppusunggu D., Wille S., Burrell P.M., Mason J. 1981. 15 N nuclear magnetic shielding scale from gas phase studies. J. Chem. Phys. 74, 81–88.
Jameson C.J., Jameson A.K. 1987. Concurrent 19F and 77Se or 19F and 125Te NMR T1 measurements for determination of 77Se and 125Te absolute shielding scales. Chem. Phys. Lett. 135: 254–259.
Kellett C.W., Kennepohl P., Berlinguette C.P. 2020. π covalency in the halogen bond. Nat. Commun. 11: 3310.
Koelling D.D., Harmon B.N. 1977. A technique for relativistic spin-polarised calculations. J. Phys. C Solid State Phys. 10: 3107–3114.
Kumar V., Triglav M., Morin V.M., Bryce D.L. 2022. On the predictability of chalcogen-bond-driven crystal engineering. an X-ray diffraction and selenium-77 solid-state NMR investigation of benzylic selenocyanate cocrystals. ACS Org. Inorg. Au, 2, 252–260.
Kumar V., Xu Y., Leroy C., Bryce D.L. 2020a. Direct investigation of chalcogen bonds by multinuclear solid-state magnetic resonance and vibrational spectroscopy. Phys. Chem. Chem. Phys. 22: 3817–3824.
Kumar V., Xu Y., Bryce D.L. 2020b. Double chalcogen bonds: crystal engineering stratagems via diffraction and multinuclear solid-state magnetic resonance spectroscopy. Chem. Eur. J. 26: 3275–3286.
Kumar V., Leroy C., Bryce D.L. 2018. Halide ion recognition via chalcogen bonding in the solid state and in solution. directionality and linearity. CrystEngComm 20: 6406–6411.
Legon A.C., Walker N.R. 2018. What’s in a name? ‘Coinage-metal’ non-covalent bonds and their definition. Phys. Chem. Chem. Phys. 20: 19 332–19 338.
Mahmudov K.T., Kopylovich M.N., Guedes da Silva M.F.C., Pombeiro A.J.L. 2017. Chalcogen bonding in synthesis, catalysis and design of materials. Dalton Trans. 46: 10 121–10 138.
Mercury 2021.1.0(Build 319587). Copyright © CCDC, 2001–2021.
Nag T., Ovens J.S., Bryce D.L. 2022. 77Se and 125Te solid-state NMR and X-ray diffraction structural study of chalcogen-bonded 3,4-dicyano-1,2,5-chalcogenodiazole cocrystals. Acta Crystallogr. C Struct. Chem. 78, 517–523.
Perdew J.P., Burke K., Ernzerhof M. 1996. Generalized gradient approximation made simple. Phys. Rev. Lett. 77: 3865–3868.
Pickard C.J., Mauri F. 2001. All-electron magnetic response with pseudopotentials: NMR chemical shifts. Phys. Rev. B 63: 245101.
Politzer P., Murray J.S., Clark T., Resnati G. 2017. The σ-hole revisited. Phys. Chem. Chem. Phys. 19: 32 166–32 178.
Profeta M., Mauri F., Pickard C.J. 2003. Accurate first principles prediction of 17O NMR parameters in SiO2: assignment of the zeolite ferrierite spectrum. J. Am. Chem. Soc. 125: 541–548.
Ratcliffe C.I., Ripmeester J.A., Buchanan G.W., Denike J.K. 1992. A molecular merry-go-round: motion of the large macrocyclic molecule 18-crown-6 in its solid complexes studied by 2H NMR. J. Am. Chem. Soc. 114: 3294–3299.
Resnati G., Bryce D.L., Desiraju G.R., Frontera A., Krossing I., Legon A.C., et al. 2023. Definition of the pnictogen bond. https://iupac.org/recommendation/definition-of-the-pnictogen-bond/Copyright © 2023 IUPAC [accessed May 2023].
Sanz Camacho P., McKay D., Dawson D.M., Kirst C., Yates J.R., Green T.F.G., et al. 2016. Investigating unusual homonuclear intermolecular “through-space” J couplings in organochalcogen systems. Inorg. Chem. 55: 10 881–10 887.
Sanz Camacho P., Athukorala Arachchige K.S., Slawin A.M.Z., Green T.F.G., Yates J.R., Dawson D.M., et al. 2015. Unusual intermolecular “through-space” J couplings in P–Se heterocycles. J. Am. Chem. Soc. 137: 6172–6175.
Sanz Camacho P., Stanford M.W., McKay D., Dawson D.M., Athukorala Arachchige K.S., Cordes D.B., et al. 2018. Polymorphism, weak interactions and phase transitions in chalcogen–phosphorus heterocycles. Chem. Eur. J. 24; 11067–11081.
Schreckenbach G., Ziegler T. 1996. The calculation of NMR shielding tensors based on density functional theory and the frozen-core approximation. Int. J. Quant. Chem. 60: 753–766.
Schreckenbach G., Ziegler T. 1997. Calculation of NMR shielding tensors based on density functional theory and a scalar relativistic Pauli-type Hamiltonian. The application to transition metal complexes. Int. J. Quant. Chem. 61: 899–918.
Schreckenbach G., Ziegler T. 1995. Calculation of NMR shielding tensors using gauge-including atomic orbitals and modern density functional theory. J. Phys. Chem. 99: 606–611.
Scilabra P., Terraneo G., Resnati G. 2019. The chalcogen bond in crystalline solids: a world parallel to halogen bond. Acc. Chem. Res. 52: 1313–1324.
Semenov N.A., Pushkarevsky N.A., Beckmann J., Finke P., Lork E., Mews R., et al. 2012. Tellurium–nitrogen π-heterocyclic chemistry—synthesis, structure, and reactivity toward halides and pyridine of 3,4-dicyano-1,2,5-telluradiazole. Eur. J. Inorg. Chem. 2012: 3693–3703.
Semenov N.A., Gorbunov D.E., Shakhova M.V., Salnikov G.E., Bagryanskaya I.Y., Korolev V.V., et al. 2018. Donor–acceptor complexes between 1,2,5-chalcogenadiazoles (Te, Se, S) and the pseudohalides CN− and XCN− (X=O, S, Se, Te). Chem. Eur. J. 24, 12983–12991.
Stanford M.W., Knight F.R., Athukorala Arachchige K.S., Sanz Camacho P., Ashbrook S.E., Bühl M., et al. 2014. Probing interactions through space using spin–spin coupling. Dalton Trans. 43: 6548–6560.
Sturniolo S., Green T.F.G., Hanson R.M., Zilka M., Refson K., Hodgkinson P., et al. 2016. Visualization and processing of computed solid-state NMR parameters: MagresView and MagresPython.Solid State Nucl. Magn. Reson. 78: 64–70.
te Velde G., Bickelhaupt F.M., Baerends E.J., Fonseca Guerra C., van Gisbergen S.J.A., Snijders J.G., Ziegler T. 2001. Chemistry with ADF. J. Comput. Chem. 22: 931–967.
Vogel L., Wonner P., Huber S.M. 2018. Chalcogen bonding: an overview. Angew. Chem. Int. Ed. 58: 1880–1891.
Werz D.B., Gleiter R., Rominger F. 2002. Nanotube formation favored by chalcogen−chalcogen interactions. J. Am. Chem. Soc. 124: 10 638–10 639.
Wolff S.K., Ziegler T., van Lenthe E., Baerends E.J. 1999. Density functional calculations of nuclear magnetic shieldings using the zeroth-order regular approximation (ZORA) for relativistic effects: ZORA nuclear magnetic resonance. Journal of Chemical Physics, 110, 7689–7698.
Wolff S.K., Ziegler T. 1998. Calculation of DFT-GIAO NMR shifts with the inclusion of spin-orbit coupling. J. Chem. Phys. 109: 895–905.
Xu Y., Gabidullin B., Bryce D.L. 2019. Single-crystal NMR characterization of halogen bonds. J. Phys. Chem. A 123: 6194–6209.
Xu Y., Kumar V., Bradshaw M.J.Z., Bryce D.L. 2020. Chalcogen-bonded cocrystals of substituted pyridine n-oxides and chalcogenodiazoles: an X-ray diffraction and solid-state NMR investigation. Crystal Growth Design 20: 7910–7920.
Yan W., Zheng M., Xu C., Chen F.E. 2021. Harnessing noncovalent interaction of chalcogen bond in organocatalysis: from the catalyst point of view. Green Synth. Catal. 2: 329–336.
Yates J.R., Pickard C.J., Mauri F. 2007. Calculation of NMR chemical shifts for extended systems using ultrasoft pseudopotentials. Phys. Rev. B 76: 024401.
Information & Authors
Information
Published In
FACETS
Volume 8 • January 2023
Pages: 1 - 14
Editor: Christophe Morell
History
Received: 12 May 2023
Accepted: 7 July 2023
Version of record online: 2 November 2023
Copyright
© 2023 The Authors. This work is licensed under a Creative Commons Attribution 4.0 International License (CC BY 4.0), which permits unrestricted use, distribution, and reproduction in any medium, provided the original author(s) and source are credited.
Data Availability Statement
Data are available upon reasonable request from the authors.
Key Words
Sections
Subjects
Authors
Author Contributions
Conceptualization: DLB
Data curation: CA
Formal analysis: CA, TN, DLB
Funding acquisition: DLB
Investigation: CA, TN
Methodology: TN, DLB
Project administration: DLB
Supervision: DLB
Writing – original draft: CA
Writing – review & editing: CA, TN, DLB
Competing Interests
The authors declare there are no competing interests related to this manuscript.
Funding Information
Metrics & Citations
Metrics
Other Metrics
Citations
Cite As
Carina Almario, Tamali Nag, and David L. Bryce. 2023. Chemical shift tensors as probes of chalcogen bonds: solid-state NMR study of telluradiazole-XCN− (X = O, S, Se) salt cocrystals. FACETS.
8(): 1-14. https://doi.org/10.1139/facets-2023-0082
Export Citations
If you have the appropriate software installed, you can download article citation data to the citation manager of your choice. Simply select your manager software from the list below and click Download.
There are no citations for this item