Evaluating the design of the first marine protected area network in Pacific Canada under a changing climate
Abstract
Marine protected area (MPAs) networks can buffer marine ecosystems from the impacts of climate change by allowing species to redistribute as conditions change and by reducing other stressors. There are, however, few examples where climate change has been considered in MPA network design. In this paper, we assess how climate change considerations were integrated into the design of a newly released MPA network in the Northern Shelf Bioregion in British Columbia, Canada, and then evaluate the resulting network against projected physical and biogeochemical changes and biological responses. We found that representation, replication, and size and spacing recommendations integrated into the design phase were met in most cases. Furthermore, despite varying degrees of projected changes in temperature, dissolved oxygen, and aragonite saturation across the MPA network, suitable habitat for demersal fish species is projected to remain in the network despite some redistribution among sites. We also found that mid-depth MPAs are particularly important for persistence, as fish are projected to move deeper to avoid warming in shallower areas. Our results highlight that a representative MPA network with adequate replication, that incorporates areas of varying climate change trajectory, should buffer against the impacts of climate change.
Introduction
The establishment of marine protected areas (MPAs) is a key conservation action used to support and maintain resilient marine ecosystems in the face of climate change (Magris et al. 2014; Roberts et al. 2017; Tittensor et al. 2019; Jacquemont et al. 2022). Several recent reviews have found that highly protected MPAs will provide the greatest ecological benefits and better buffer against some climate change impacts by alleviating stressors from other human pressures (Edgar et al. 2014; Grorud-Colvert et al. 2021; Jacquemont et al. 2022). MPAs also build resilience against climate impacts by protecting carbon storage and sequestering habitats (e.g., eelgrass, surfgrass, and kelp forests, seabed), promoting genetic diversity associated with higher capacity for adaptation, and restoring food web structure, including the presence of apex predators that may buffer climate-induced instabilities (reviewed in Roberts et al. 2017). However, despite the value of MPAs for maintaining ocean ecosystem resilience, climate change is a pervasive threat that has and will continue to impact marine ecosystems despite spatial protection measures (e.g., Selig et al. 2012; Ross et al. 2020; Stevenson et al. 2020), and strong emissions reductions are urgently needed to protect ocean ecosystems (Bruno et al. 2018; Bates et al. 2019). As mitigation tools, MPAs and MPA networks help buffer climate change effects on ocean ecosystems (Micheli et al. 2012; Olds et al. 2014; Ziegler et al. 2023); however, there are few examples of MPA networks that have built climate change considerations into their design, and most of them are from tropical ecosystems (Tittensor et al. 2019).
MPA networks, collections of individual MPAs that operate cooperatively and synergistically at various spatial scales under a range of protection levels (WCPA/IUCN 2007), offer greater resilience to climate change and other stressors than individual MPAs due to key network design principles including representativity, replication, and connectivity (Micheli et al. 2012; Green et al. 2014; Carr et al. 2017). Standard analytical approaches for incorporating representativity and replication into MPA networks are well established, but incorporating connectivity remains a challenge (Balbar and Metaxas 2019). One key barrier to incorporating connectivity into MPA design is that it varies with species life history, dispersal ability, habitat associations, and migration patterns, among other ecological traits (Bryan-Brown et al. 2017). Despite its recognized importance for MPA network effectiveness, a recent review found that only 11% of global MPAs considered connectivity in their design, mostly due to limited data (Balbar and Metaxas 2019). In the absence of connectivity models for all focal species in the planning process, MPA networks are often designed using rules of thumb to incorporate connectivity. These rules are usually informed by life history characteristics such as planktonic larval duration of focal species (e.g., Burt et al. 2014; D'Aloia et al. 2017) and inform MPA size and spacing recommendations that serve as a surrogate for connectivity in the design of the network.
An MPA network that is representative and well-distributed in space and with adequate replication across environmental, physical, and latitudinal gradients allows for potential future shifts in species distributions and is more likely to incorporate areas with different climatic trajectories and histories. These features add further robustness to the MPA network in the face of climate change (Tittensor et al. 2019). Climate refugia, areas that are more stable or experience incremental change through time (Barnosky 2008; Ban et al. 2016), although often rare, have also been recommended for inclusion in protected area design (Morelli et al. 2016; Tittensor et al. 2019; Walsworth et al. 2019; Wilson et al. 2020). Slower rates of change within climate refugia may allow the time necessary for populations to adapt to changing conditions in comparison to areas that may experience accelerated change. This kind of adaptation to climate change can help determine the persistence of future populations and the magnitude of range shifts (e.g., Pinsky et al. 2013). The nature of local adaptation to a range of representative environments in the planning area that includes different climatic histories and trajectories can help to protect the high levels of adaptive genetic variation that are essential to future climate adaptation (Bell and Gonzalez 2009; Norberg et al. 2012; Orr and Unckless 2014; Thompson and Fronhofer 2019). In the absence of data on the climate histories and genetic diversity of species in the MPA network planning area, an alternative is to rely on representativity to ensure that a range of physical (e.g., depth), geographical (e.g., latitude), and environmental (e.g., temperature) gradients are well represented, replicated, and adequately connected in the MPA network, thereby providing the greatest chance that climate and genetic heterogeneity are also included.
MPAs and MPA networks have more recently been highlighted as tools for climate change mitigation, in part through the protection of “blue carbon ecosystems”, or coastal ecosystems that sequester and store organic carbon, such as eelgrass meadows, salt marshes, and canopy-forming kelp forests (Jacquemont et al. 2022; Jankwoska et al. 2022). Often, these ecosystems are targeted for protection in MPAs for their ecological value, where they provide structural habitat for numerous fish and invertebrates, including those of cultural and commercial importance (Gale et al. 2019; Rubidge et al. 2020; Unsworth et al. 2022). However, the protection of these habitats also provides the co-benefit of carbon storage and sequestration, though the amount of carbon fixed and stored may vary regionally (Krause-Jensen and Duarte 2016; Röhr et al. 2018). Despite this variation and associated uncertainty around specific carbon fixation rates, there is building evidence on how to more directly include blue carbon ecosystems in MPA design to maximize climate-change mitigation benefits (Sala et al. 2021; Epstein and Roberts 2022; Jankowska et al. 2022).
Recent papers have been calling for more climate-robust or “climate-smart” ocean planning, where MPA networks are a cornerstone of approaches and explicitly managing and designing MPAs with climate change as an overarching factor is key (Wilson et al. 2020; O'Regan et al. 2021; Bryndum-Buchholz et al. 2022; Buenafe et al. 2023). Adaptation strategies that can be implemented by MPA networks to increase resilience include protecting climate refugia, protecting future habitats of priority species, increasing connectivity, increasing heterogeneity, incorporating blue-carbon ecosystems, and reducing other stressors (Wilson et al. 2020; Bryndum-Buchholz et al. 2022). Here, we present a case study on a proposed MPA network in Pacific Canada to illustrate how climate change considerations were built into the network design. Canada has committed to establishing MPA networks as part of its effort to meet international and national targets to protect 30% of their ocean and coastal waters by 2030 (PMO 2021; CBD 2022). The MPA network in the Northern Shelf Bioregion (NSB; Fig. 1) was announced by the planning governments of 15 First Nations,1 British Columbia (BC), and Canada in February 2023 (MPA Network BC Northern Shelf Initiative 2023). The objectives of this paper are to (1) evaluate the final proposed network against design strategies and guidelines linked to climate resilience developed and applied by the NSB MPA network technical team (MPATT); (2) assess how the proposed MPA network is projected to change in physical and biogeochemical characteristics (temperature, dissolved O2, and ocean acidification) under potential future climate change; and (3) evaluate how the proposed NSB network scenario will protect the future habitat of demersal fish.
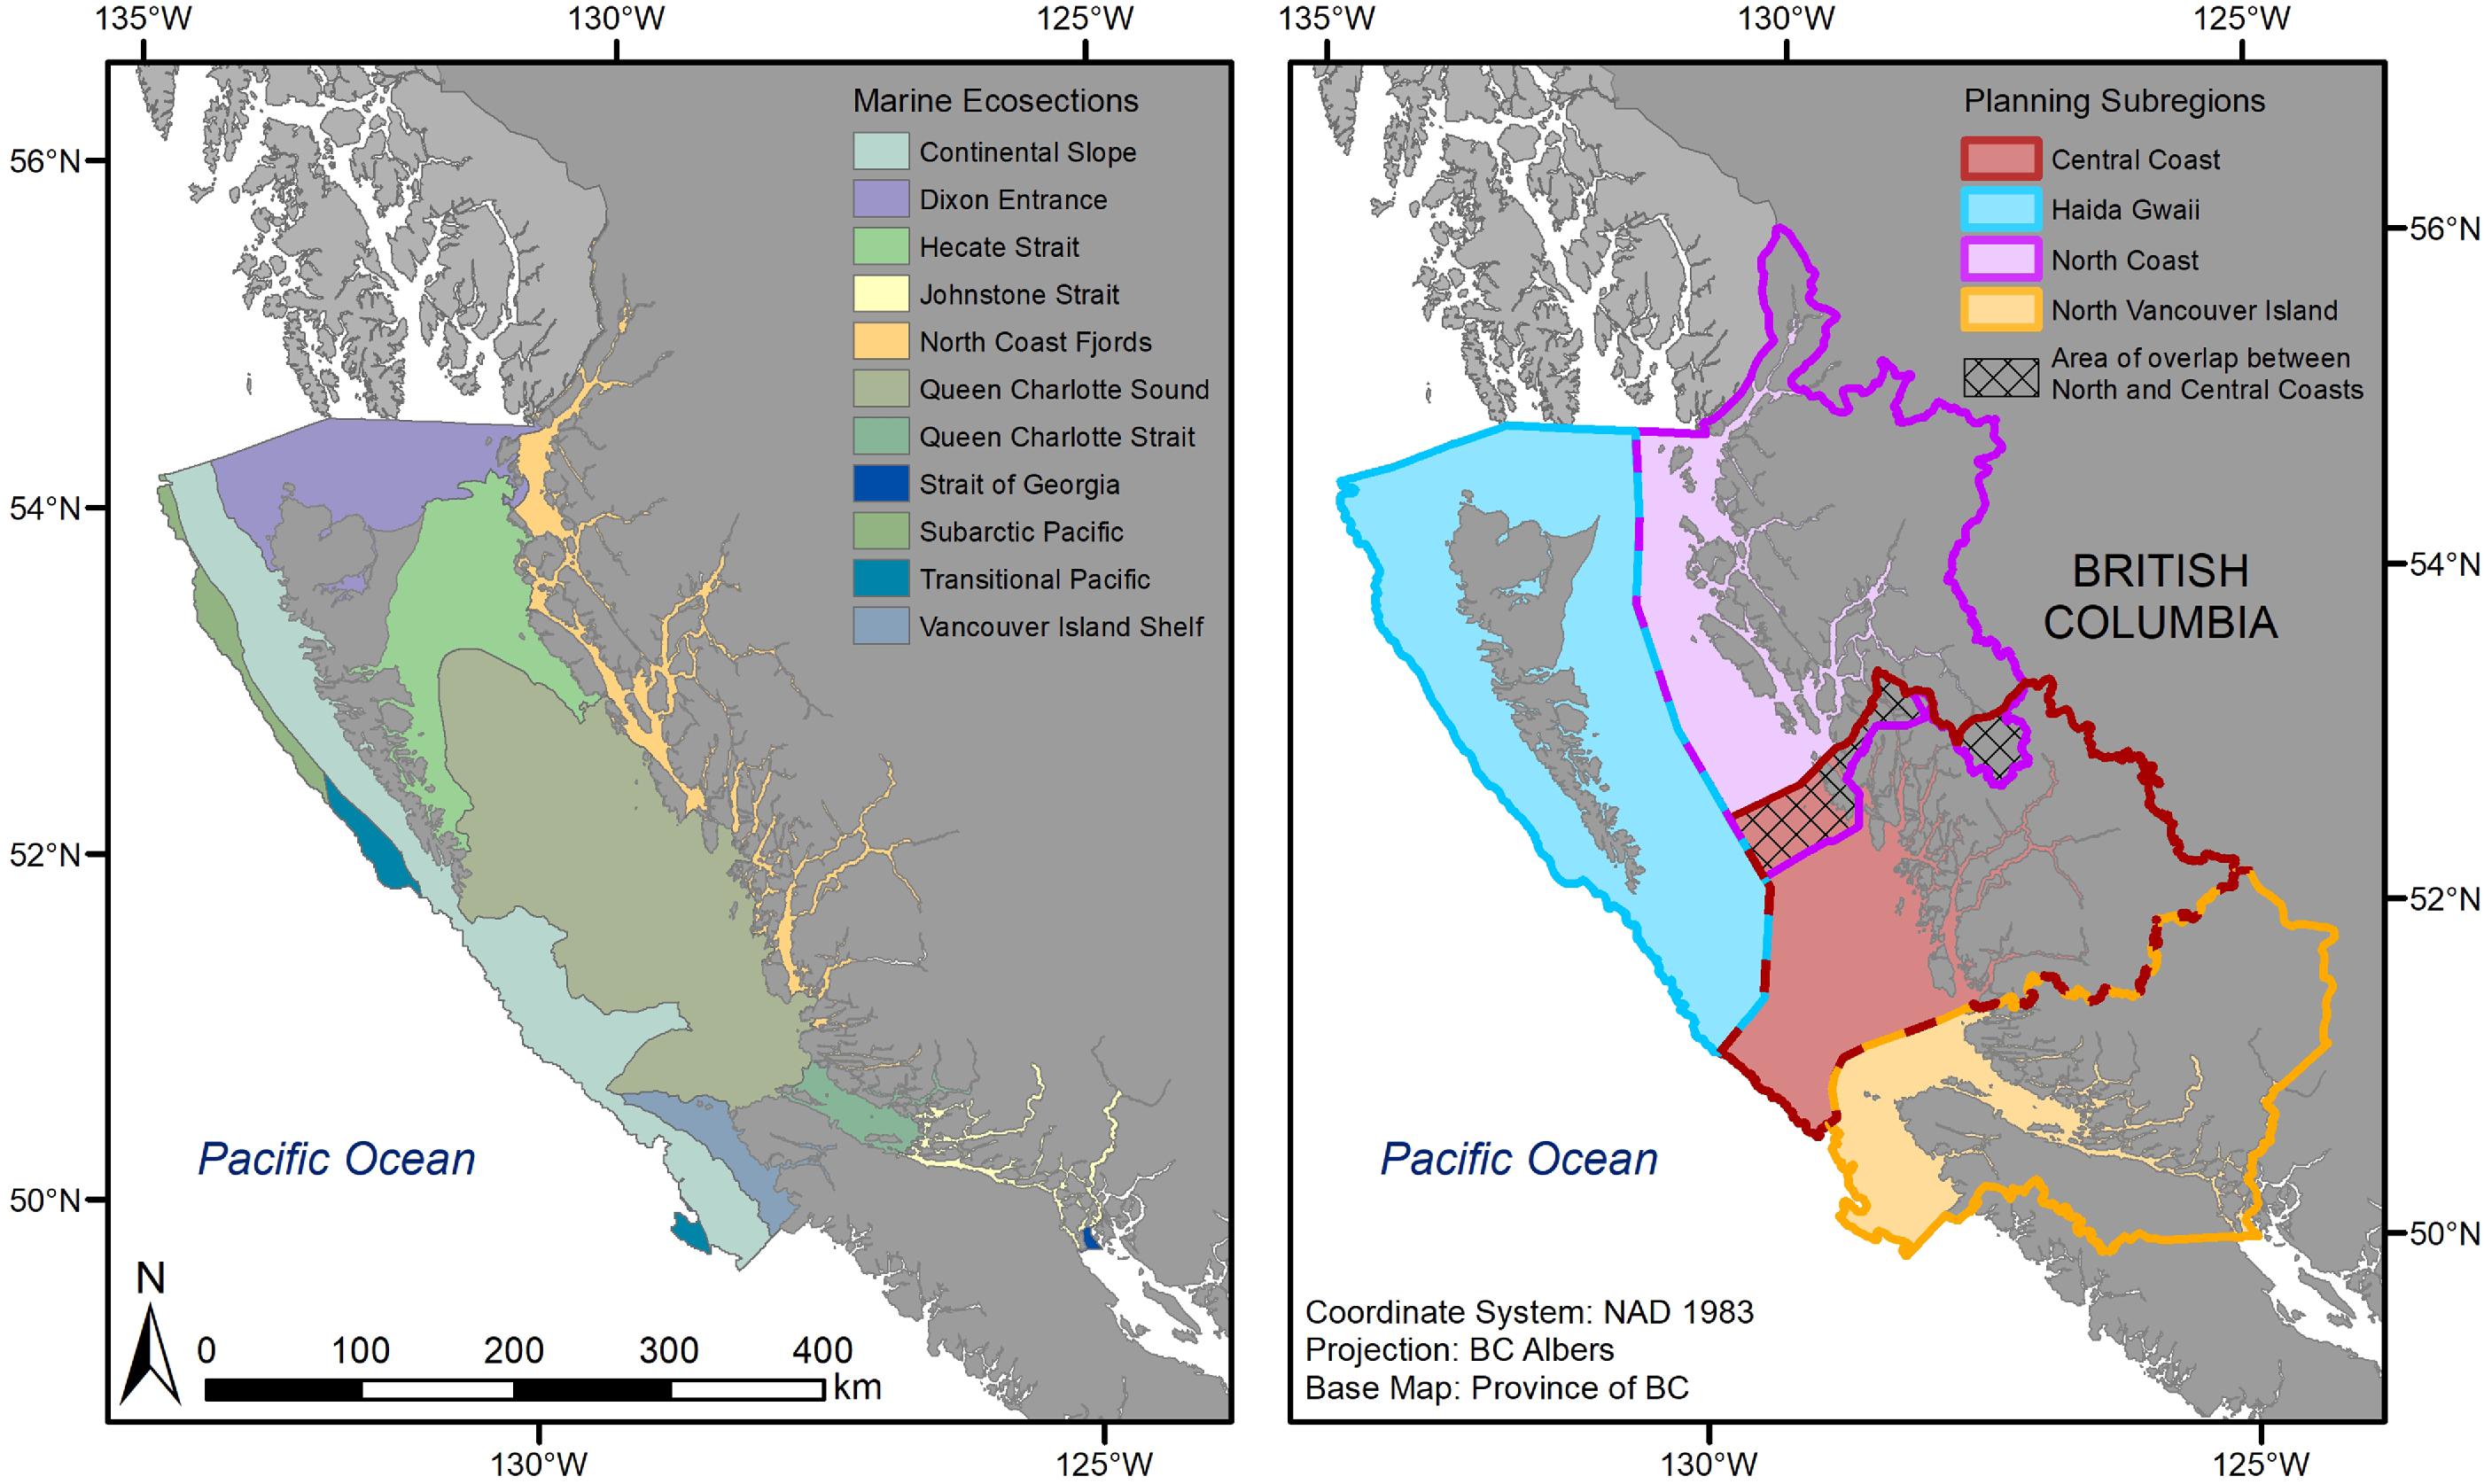
Fig. 1.
1
MPATT Governance partners: Gitga'at, Gitxaala, Haisla, Kitselas, Kitsumkalum, Metlakatla, Heiltsuk, Kitasoo/Xai'xais, Nuxalk, Wuikinuxv, Mamalilikulla, Kwiakah, Tlowitsis, and Wei Wai Kum First Nations; Council of the Haida Nation; the Province of British Columbia; and the Government of Canada.
Study area—Northern Shelf Bioregion
The NSB, one of 12 marine bioregions in Canada (DFO 2009), on the BC coast covers about 102,000 km2 of the continental shelf and extends from Bute Inlet on the east side of Vancouver Island, north to the Alaska border (Fig. 1). The NSB is a biodiverse and culturally rich area. It is home to over 30 First Nations and communities and spans many ecosystems, from estuaries, rocky and sandy beaches, and deep inland fjords, to continental shelf and trough ecosystems down to deep slope waters off the west coast of Haida Gwaii. To support marine spatial planning efforts, the NSB was further divided into four planning subregions: North Coast, Central Coast, North Vancouver Island, and Haida Gwaii (Fig. 1).
As with the rest of Canada's Pacific Ocean, the NSB waters are warming and becoming more acidic and less oxygenated, and marine heatwaves are becoming more frequent and extreme (Boldt et al. 2021). Biological consequences from climate change are evident in the NSB and surrounding waters (Weatherdon et al. 2016; Cheung and Frölicher 2020; Whitney et al. 2020; English et al. 2022; Reid et al. 2022; Free et al. 2023), and warming and associated biological responses are projected to increase in magnitude with future climate change (e.g., Holdsworth et al. 2021; Thompson et al. 2023; Peña and Fine 2023).
Climate change considerations in NSB MPA network development
Within the NSB, several previous planning processes have been initiated over many years by different groups of partners at a variety of scales (e.g., CCFN 2012; MaPP 2015; PNCIMA Initiative 2017). This long history provided a foundation for MPA network planning, and in 2015, the tripartite Marine Protected Area Network Technical Team (MPATT) was established to complete technical work on MPA network planning in the NSB. MPATT operates under the guidance of decision-makers from the governments of 15 First Nations, the province of British Columbia, and Canada, and includes representatives from each planning partner. Below, we summarize how the MPATT team integrated climate change considerations into the design of the NSB MPA network, using the data available at the time of network development.
MPA network goals and objectives
The NSB MPA network planning process followed a classic systematic conservation planning approach (Margules and Pressey 2000). The development of the MPA network was based on six overarching network goals identified in the 2014 Canada-BC MPA Network Strategy, with the primary goal (Goal 1) being “To protect and maintain marine biodiversity, ecological representation and special natural features” (Canada-BC Marine Protected Area Network Strategy 2014; MPA Network BC Northern Shelf Initiative 2023). Integrating climate resilience as an overarching goal, as recommended by Bryndum-Bucholz et al. (2022), was not explicitly stated in the NSB MPA network plan; however, resilience in the face of environmental change is clearly stated as one of seven objectives under the primary goal for MPA network planning in the NSB. This ecological resilience objective is stated as “to contribute to the conservation of the diversity of species, populations and ecological communities, and their viability in changing environments” (MPA Network BC Northern Shelf Initiative 2023). Further, ecological design guidelines solicited by MPATT from experts in the field and reviewed by stakeholders specific to the NSB network planning process specified the importance of “consider(ing) expected effects of climate change on habitats and species in determining replication and representation of Conservation Priorities and distribution of MPAs to foster ecological resilience” (Lieberknecht et al. 2016).
Conservation priorities and design strategies
Linked to the ecological network objectives under Goal 1, a framework was developed to identify ecological conservation priorities (DFO 2017; Gale et al. 2019), and research was done to develop MPA network design strategies (DFO 2019; Martone et al. 2021). The conservation priorities are the ecological and cultural features to be protected in the network, such as species, habitats, and sites of cultural importance (see MPA Network BC Northern Shelf Initiative (2023) for more details). Two types of ecological conservation priorities were identified: species-based conservation priorities and area-based conservation priorities. Species-based conservation priorities were selected based on their ecological role, their conservation status, and their vulnerability. Area-based conservation priorities were identified using the network objectives, specifically the protection of “representative habitats”, “ecologically significant areas”, and the conservation of biological communities and their “viability in changing environments”.
The ecological design strategies describe how ecological conservation priorities will be spatially incorporated into the MPA network and include advice on representation and replication of conservation priorities (e.g., 20%–40% eelgrass beds, two to three replicates within each subregion) and MPA size, spacing, and protection levels (Martone et al. 2021). The target ranges were developed systematically for all species-based and area-based conservation priorities, linked to specific network objectives, and subject to expert review. They were then used in site selection analyses based on the spatial data available to represent each conservation priority. Details and the final targets are available in Martone et al. (2021) and the MPA Network BC Northern Shelf Initiative (2023) Compendium 2.
MPA size/spacing
For MPA size, Martone et al. (2021) updated a synthesis of adult fish movements (Burt et al. 2014) to generate the distribution of adult home ranges for nearshore and shelf/slope conservation priorities, and MPA size recommendations were based on the rule of thumb that MPAs should be at least twice as large as those required for species with intermediate home ranges (Palumbi 2004; DFO 2019; Martone et al. 2021). For nearshore species, many were found to have a range of less than 1 km and therefore MPAs of 13–50 km2 were recommended. For species with intermediate home ranges, larger MPAs (50–150 km2) were recommended. MPA spacing recommendations were included as an initial means of addressing connectivity using pelagic larval duration and dispersal distance values compiled from the literature and existing studies (e.g., Shanks 2009; Burt et al. 2014). Similar to MPA size, spacing guidelines were based on species with intermediate dispersal distances, and MPAs spaced 40–200 km apart were recommended, with nearshore MPAs spaced closer than shelf/slope MPAs. This work fed into the site selection analyses and is summarized in a science advice report and associated documents (DFO 2019; Martone et al. 2021).
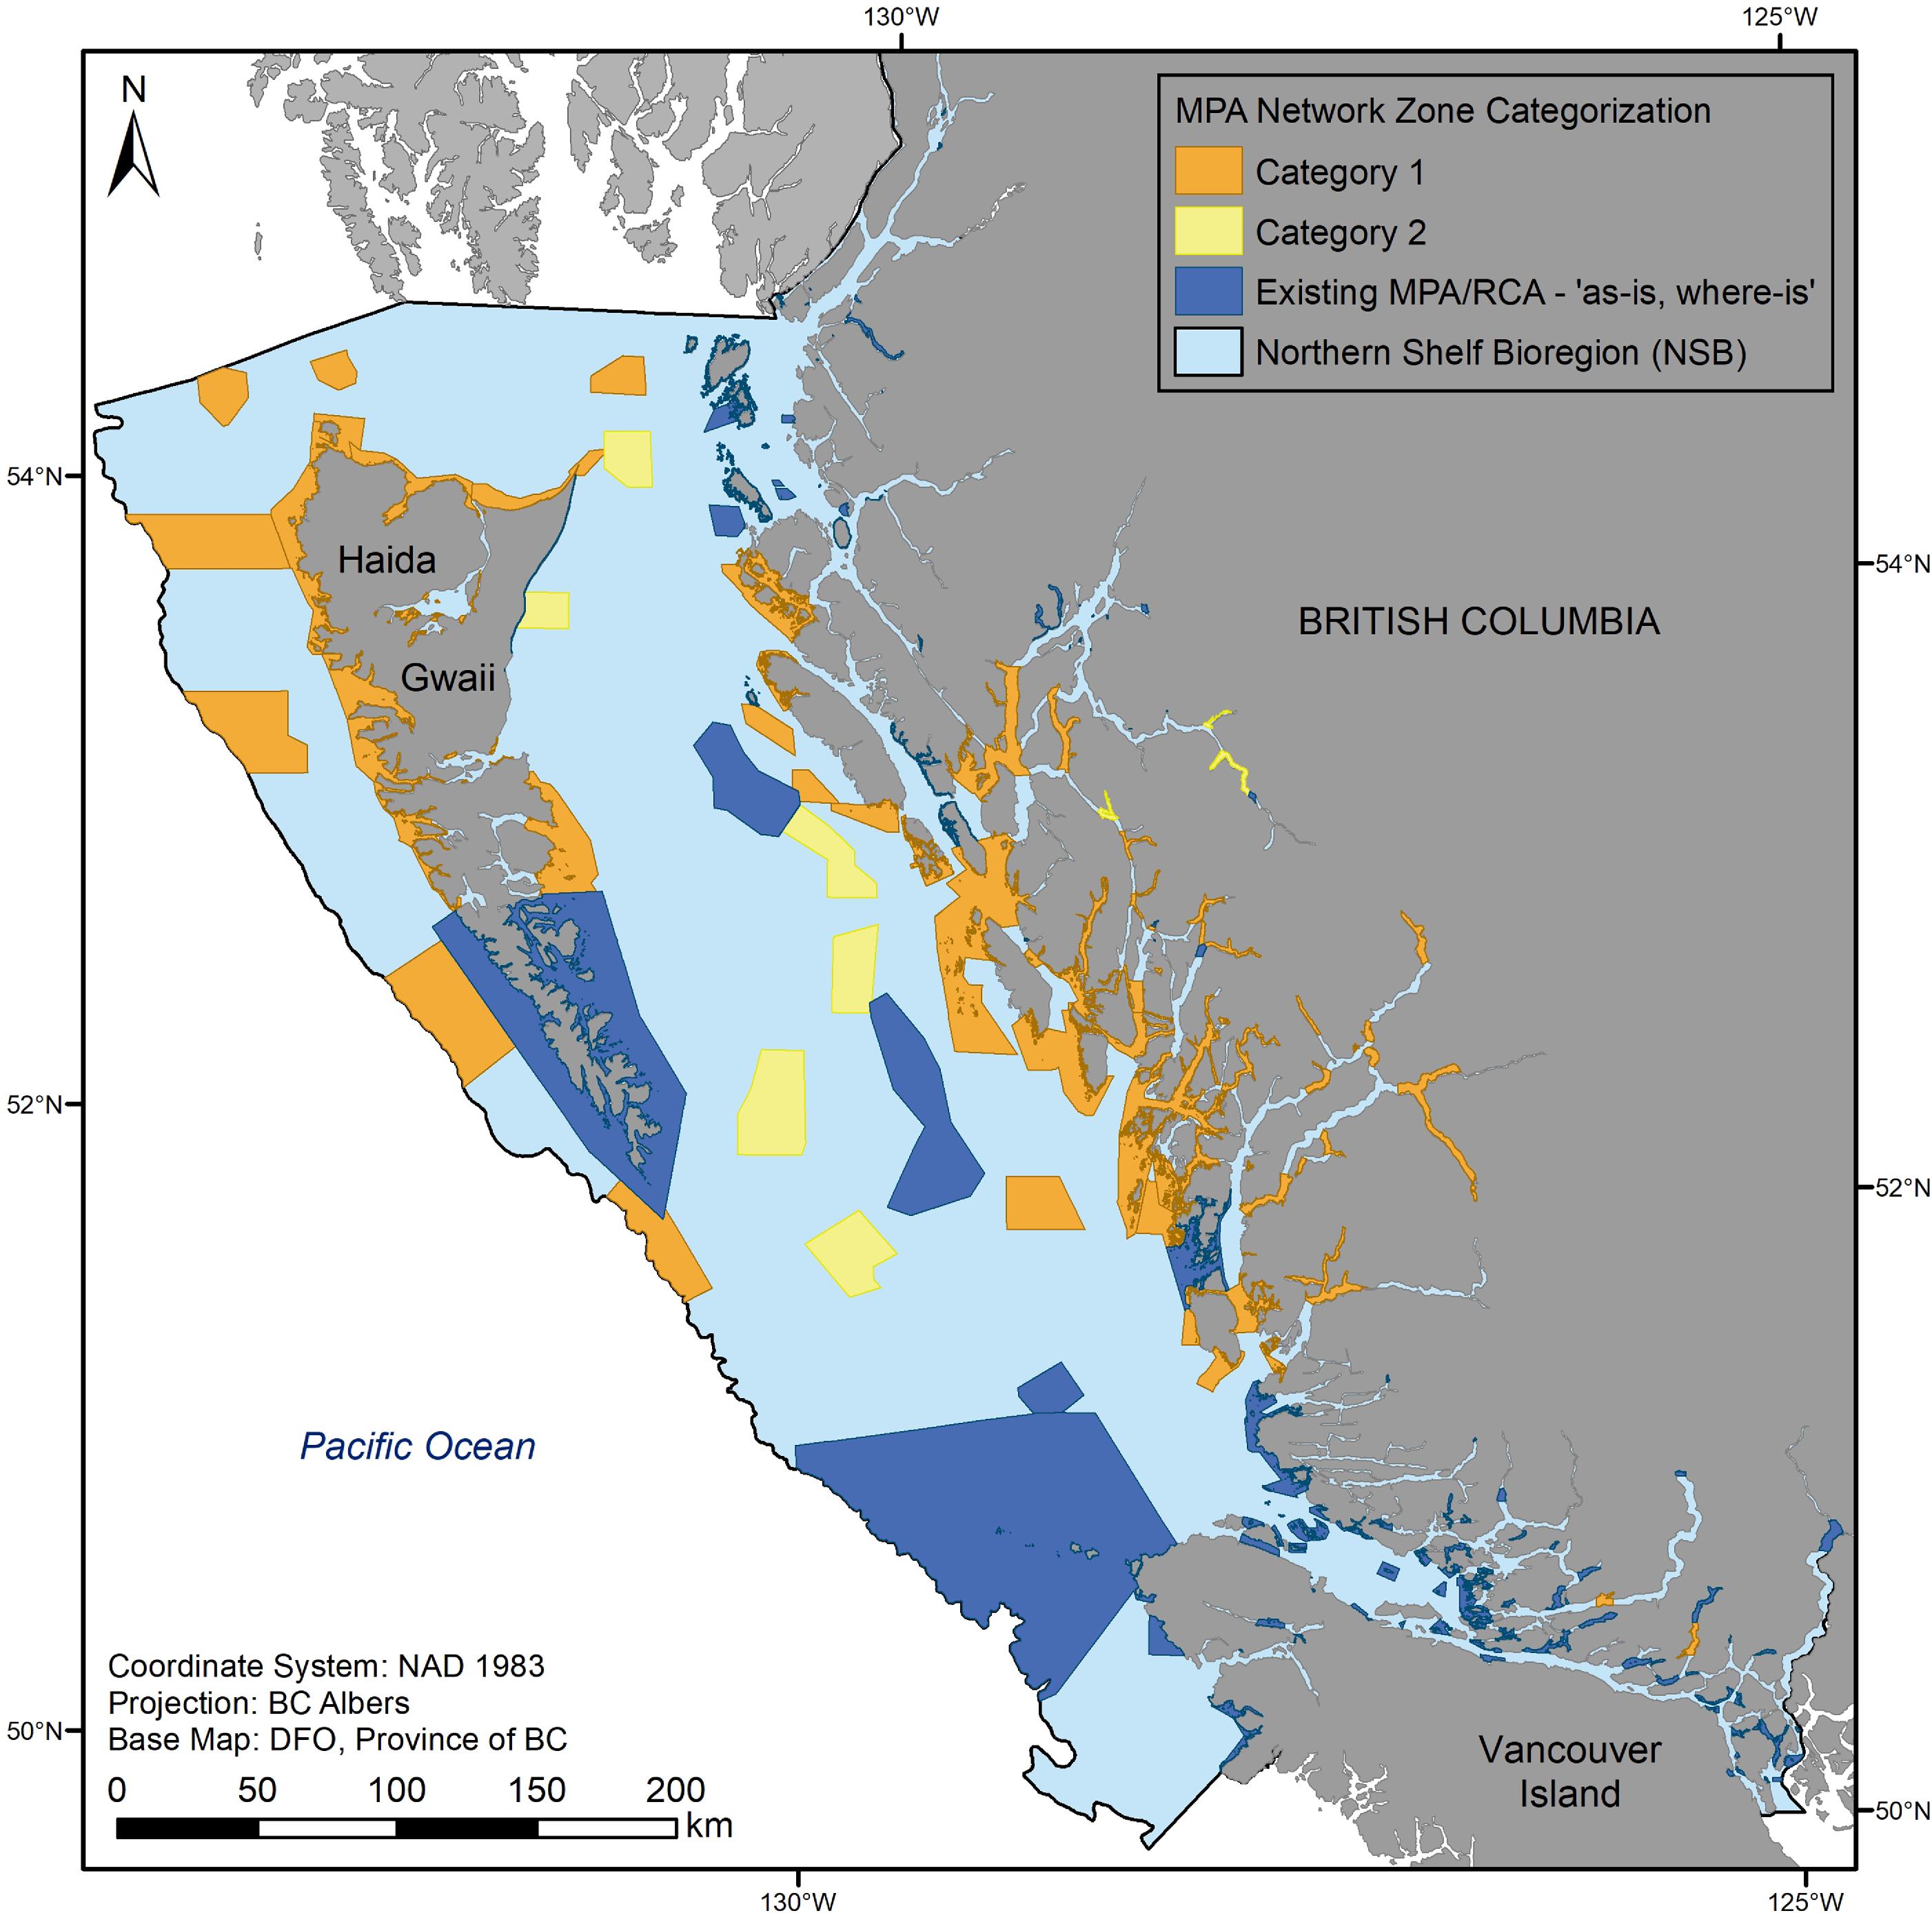
It is important to note that while climate change was a consideration and integrated into the design using the science advice summarized above, there were multiple other inputs and considerations in the MPA network planning process that influenced the final footprint of the proposed network. Thus, this analysis is not intended to evaluate the network against its full suite of goals and objectives and only provides an assessment of how well the final-draft MPA network design addressed climate change by evaluating the conservation priorities linked to climate resilience, specifically climate refugia, representative areas, and MPA size and spacing. Finally, the network is intended to be implemented in phases as outlined in the Network Action Plan (MPA Network BC Northern Shelf Initiative 2023). Implementation categories include existing MPAs and Rockfish Conservation Areas (RCAs), Category 1 sites intended for implementation by 2025, and Category 2 sites intended for implementation by 2030. Category 3 areas were also identified and have ecological and cultural importance but require further conversations among the planning partners and other First Nations prior to proposing any additional network zones within them (Fig. 2; MPA Network BC Northern Shelf Initiative 2023).
Fig. 2.
Methods
Evaluating representation and replication
To determine how well the final NSB network design addresses climate change objectives, we assessed the representation and replication of features linked to climate resilience in the proposed MPA network. This includes broad-scale ecological and physiographic classifications to represent both biological and environmental gradients and heterogeneity, and two important biogenic habitats that have also been identified as blue-carbon ecosystems—eelgrass meadows and canopy-forming kelp forests (Table 1). The biophysical units identified as part of the Pacific Marine Ecological Classification System (PMECS) represent fish and invertebrate communities and associated depth ranges (Rubidge et al. 2016a, 2016b), whereas the British Columbia Marine Ecological Classification (BCMEC) Ecosections represent physical and oceanographic classes on the BC coast (Zacharias et al. 1998).
Table 1.
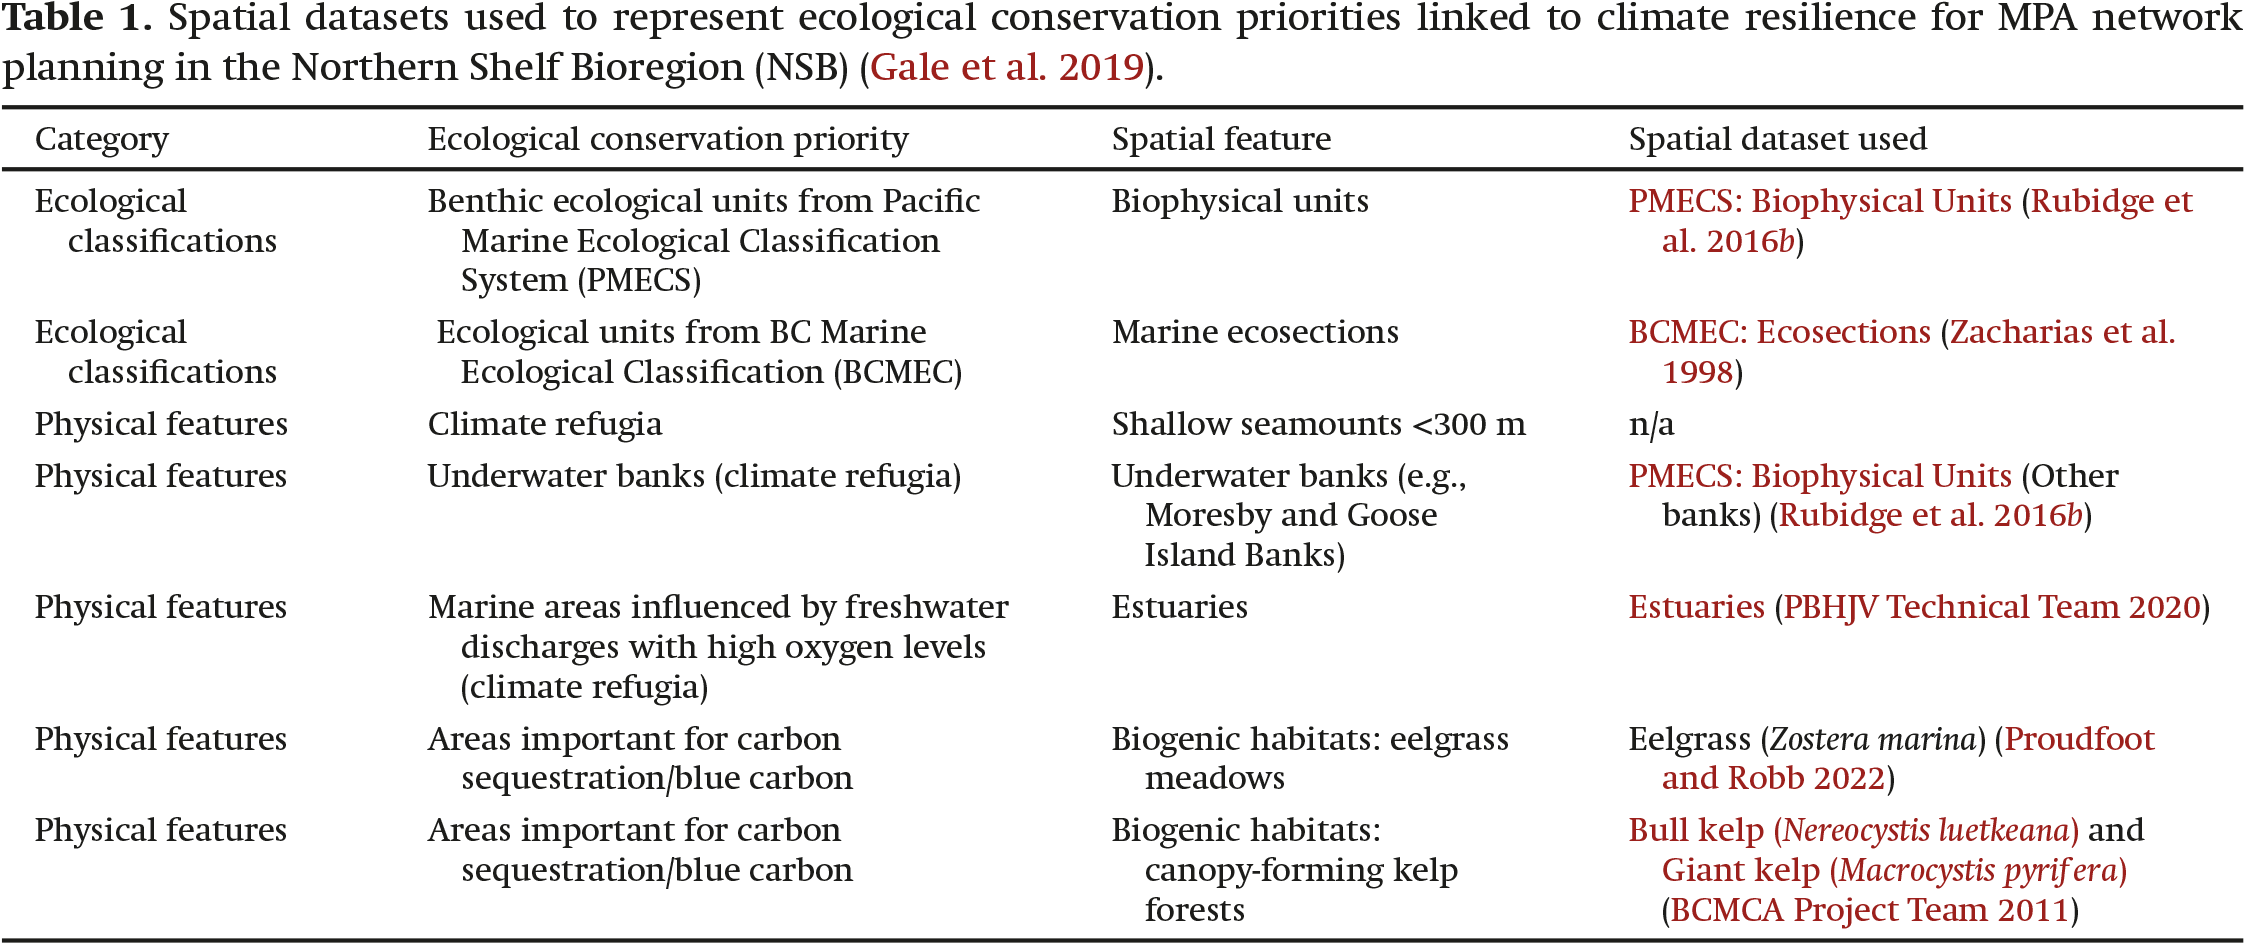
Eelgrass and canopy-forming kelp habitats were identified as conservation priorities and targeted in NSB MPA network site selection analyses for their ecological importance (Gale et al. 2019). An assessment of the representativeness of eelgrass and kelp captured in the network provides a starting point for understanding the blue carbon co-benefits of protected areas.
To assess representation, we used the intersect tool in ArcGIS 10.7.1 (ESRI 2019) to calculate the area overlap and proportion of each spatial dataset captured in the proposed network footprint and compared the proportions to the target ranges established through the ecological design strategies (Martone et al. 2021). Feature replication was assessed by counting the number of sites within each subregion that contained at least 1% of the total spatial coverage of the feature (defined as one replicate), with the aim of achieving two to three replicates for each feature within each subregion, which represent areas of different geographies and latitudes within the NSB (Fig. 1).
Integrating climate refugia
Climate refugia were identified as an area-based conservation priority for the NSB network (Gale et al. 2019). However, areas of climate refugia are not yet well-characterized in Pacific Canada waters, and an analysis of oceanographic features (sea surface temperature, sea surface height, and chlorophyll a) found few areas of stability (Ban et al. 2016). Given the lack of clearly defined climate refugia in the NSB, there was no spatial dataset to specifically target and incorporate into the MPA network design. However, using expert-identified approaches, Ban et al. (2016) also identified significant features that would likely support oceanographic stability, including shallow seamounts (peaks <300 m below surface), offshore banks (e.g., Moresby and Goose Island Banks), shelf areas protected by coastal buoyancy currents, zones of strong tidally driven vertical mixing, and zones of freshwater outflow from large rivers or streams. Therefore, we evaluated the inclusion of the physical features that may support more oceanographically stable areas for which we had available spatial datasets in the proposed network (Table 1). This was done following the methods described above for representativity using the intersect tool in ArcGIS 10.7.1 (ESRI 2019).
Evaluating MPA size and spacing
Individual MPAs within the networks were evaluated against the size recommendations provided in Martone et al. (2021) using ArcGIS 10.7.1 (ESRI 2019). Using the calculate geometry tool, we first calculated the area of each existing site and then recalculated individual site areas after the addition of Category 1 network sites and Category 2 network sites. For analysis, we dissolved zones within sites and calculated the area of the largest contiguous polygon for each type of MPA (existing, Category 1, and Category 2). Although it is understood that zones within these sites may vary in protection level, all adjacent zones will be under some sort of conservation management and therefore contribute to the overall network-level objectives. We evaluated the size of each MPA against the minimum size (13 km2).
Recommended spacing requirements suggest all sites should be within 40–200 km from each other (Martone et al. 2021). Spacing requirements were evaluated based on Euclidean distance from the MPA edge to the nearest neighbouring edge with land as a barrier using the Spatial Analyst extension in ArcGIS 10.7.1 (ESRI 2019). This is an initial assessment of whether the proposed MPA network fits spacing advice; however, more comprehensive evaluations of connectivity incorporating biophysical models and ocean currents are ongoing (Thompson et al. In press).
Projected environmental and biological changes in MPAs
Description of regional ocean models
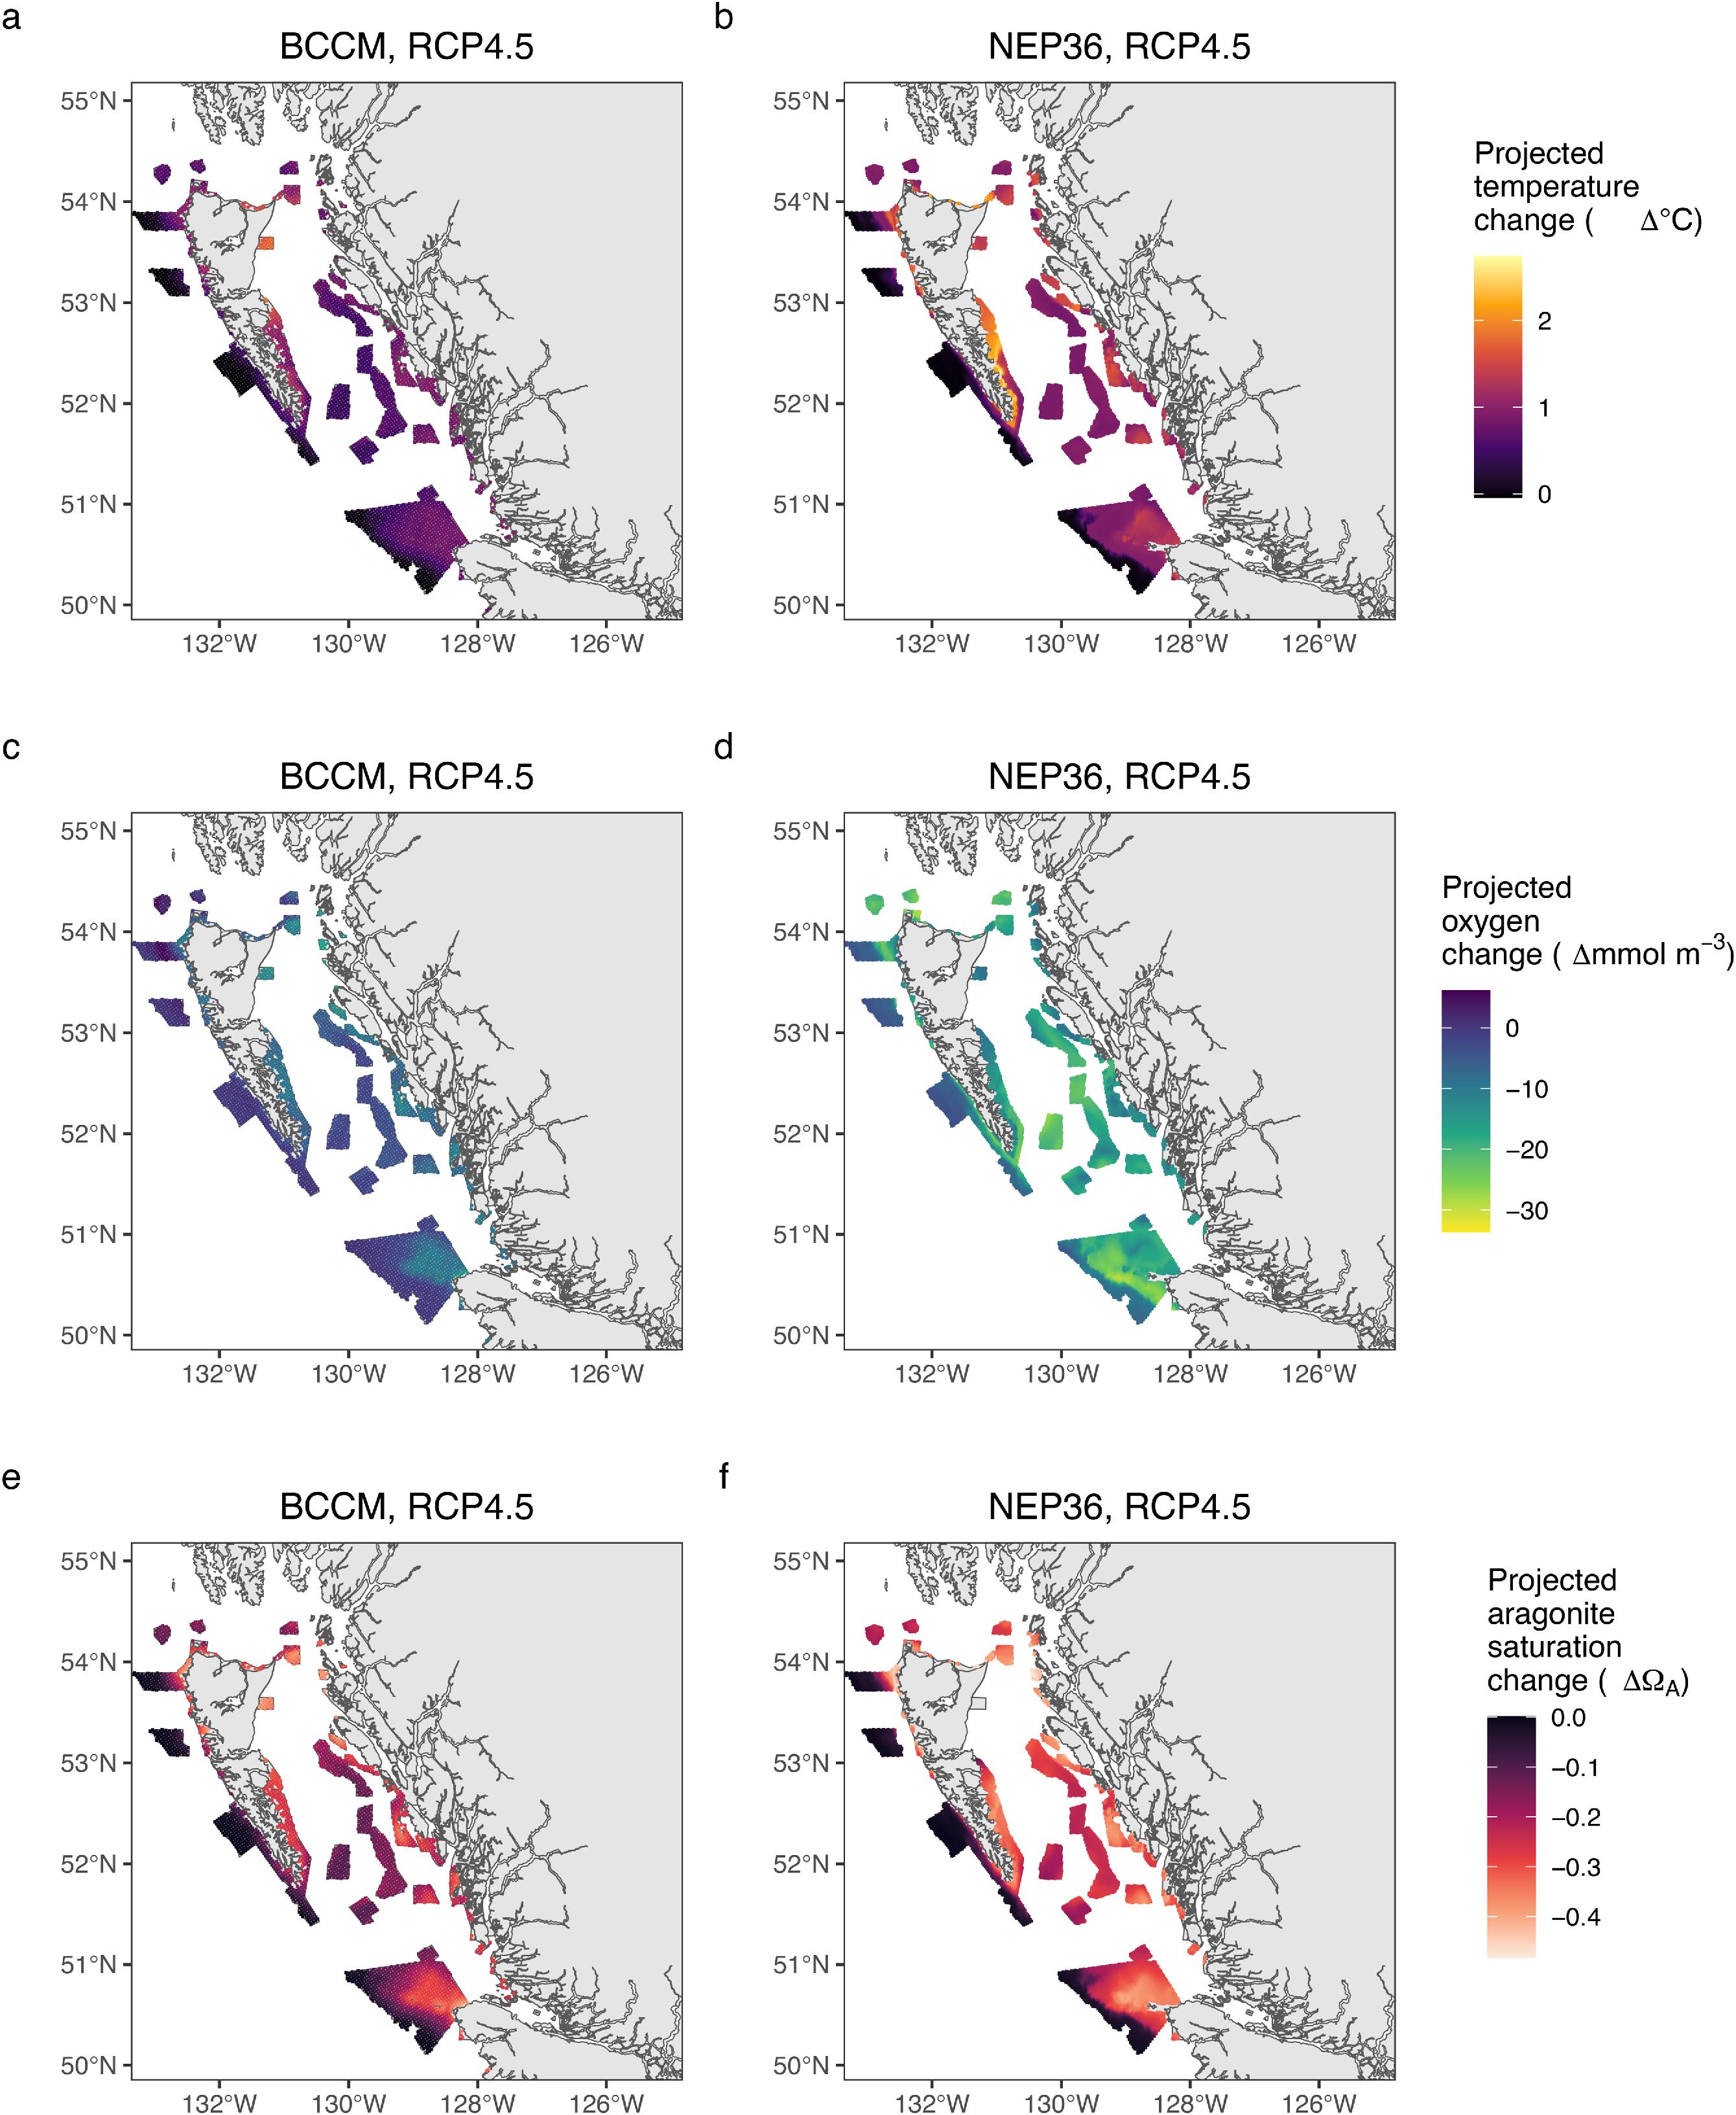
Two regional ocean models have been developed for the British Columbia continental margin (BCCM), and we used these to analyze projected changes in environmental parameters in the NSB under future climate change (Fig. 2). Each model has outputs for a historical or hindcast time period and a projected future time period under RCP4.5, representing moderate emissions mitigation, and RCP8.5, representing a no mitigation worst-case scenario (Moss et al. 2010). We have elected to use RCP4.5 for all analyses presented in this paper to provide a conservative estimate of future changes and because differences in projected change between RCP4.5 and 8.5 are relatively minor over the time span used in the projections (1985–2065; Peña et al. 2019; Holdsworth et al. 2021; Peña and Fine 2023). The models have been developed using different frameworks and parameterizations, so contrasting their outputs allows us to account for uncertainty in the downscaling methods used. The Northeastern Pacific Canadian Ocean Ecosystem Model (NEP36-CanOE) was developed by Holdsworth et al. (2021). This model is a regional configuration of the Nucleus for European Modelling of the Ocean (NEMO 3.6; Madec 2008). The NEP36-CanOE model domain spans the Canadian Pacific Ocean east of 140°W and north of 45°N with a spatial resolution of 1/36° (1.5–2.25 km) and 50 vertical levels. Because the model was forced with atmospheric climatologies (with augmented winds), model outputs represent climatologies of the historical 1986–2005 period and future 2046–2065 projections. The ocean circulation-biogeochemical model for the BCCM was developed by Peña et al. (2019). The model is a Regional Ocean Modelling System (ROMS; Haidvogel et al. 2008) implementation and covers the Canadian west coast, extending from the Alaska border (∼51°N) to the south of the Columbia River (∼47°N) and out to about 400 km from the shore. The model grid has a horizontal resolution of 3 km and a vertical resolution of 42 non-uniform sigma levels. The model outputs used in this study are from a 30-year-long hindcast simulation for the period 1981–2010 and a future projection for the period 2041–2070 (Peña and Fine 2023). The regional models are not well resolved in nearshore areas because of complex bathymetry, numerous islands, and narrow channels, and so we excluded these areas from our analysis. Additionally, due to insufficient freshwater inputs, aragonite saturation values in the NEP36 model are unrealistic in the shallowest areas to the east of Haida Gwaii (Holdsworth (personal communication)) and so we have excluded this area for this model as well. The BCCM overlaps with 52 MPA sites, and the NEP36 overlaps with 46 (45 for aragonite saturation) of the 119 sites. However, 73.0% and 69.2% of the total area of the MPA network overlaps with the BCCM and NEP36 models, respectively, because the sites that do not overlap are predominantly small and nearshore.
Building on methods developed by Friesen et al. (2021), we calculate projected seasonal changes in environmental parameters for each raster grid cell as the difference between the historical hindcast and the projected future value based on an RCP4.5 emissions scenario. Seasons were split into winter (Dec–Jan–Feb), spring (Mar–Apr–May), summer (Jun–Jul–Aug), and fall (Sep–Oct–Nov) as in Morrison et al. (2014). We calculated projected changes in (1) temperature, (2) dissolved oxygen, and (3) aragonite saturation state for benthic waters.
MPA network and fish distributions under future change
We used existing species distribution model (SDM) projections of 34 groundfish species (Thompson et al. 2023) to evaluate how the NSB MPA network would protect demersal fish assemblages under current and future climates. These SDM projections were generated by estimating species’ specific environment-occurrence relationships based on temperature, dissolved oxygen, and depth from 31,239 fisheries independent trawl surveys that span from California to Alaska over the period from 2000 to 2019. Estimated changes in occurrence at a 3 km resolution were then generated based on a historical baseline of 1986–2005 and a future RCP4.5 scenario in 2046–2065, using outputs from the BCCM and NEP36 regional climate models described previously. Here we used R (R Core Team 2022) and the sf package (Pebesma 2018) to extract projections for all species in grid cells that intersect the MPA network. We calculated species richness in each grid cell as the summed probability of occurrence across all species (Ovaskainen and Abrego 2020) and then calculated projected species richness change as the future value subtracted from the historical value (Thompson et al. 2023). We also estimated whether species that were historically present in an MPA are projected to remain present in that MPA under future conditions. For this, we assumed that a species is present in an MPA in a given time period if it has a probability of occurrence in any grid cell in the MPA that exceeds 50% of the species-specific regional maximum occurrence probability in the historical baseline. This species-specific presence threshold was used because some species are more common than others, and using a common occurrence probability threshold would not account for this. The proportion of species that persist in the MPA is the number of species that were present historically and are projected to remain present in the MPA divided by the number of species that were estimated to have been present historically. We estimated the number of species that persist in the MPA network as a whole by performing the same calculation, but considering all grid cells that fall into any MPA.
Results
Representation and replication
Our evaluation of the representation of broadscale ecological and physiographic classifications indicates that all representation targets were met for the features assessed. For some classes, only one replicate is present in each subregion (Table 2), but in most cases, this is because only a small portion of that class exists in that subregion or because planning is ongoing in the area (e.g., Category 3 area within the North Vancouver Island subregion). Environmental gradients and species assemblages associated with these classifications are captured and replicated where possible, resulting in a network that is representative of the ecosystems in the planning area—from deep slopes to estuaries (Table 2).
Table 2.
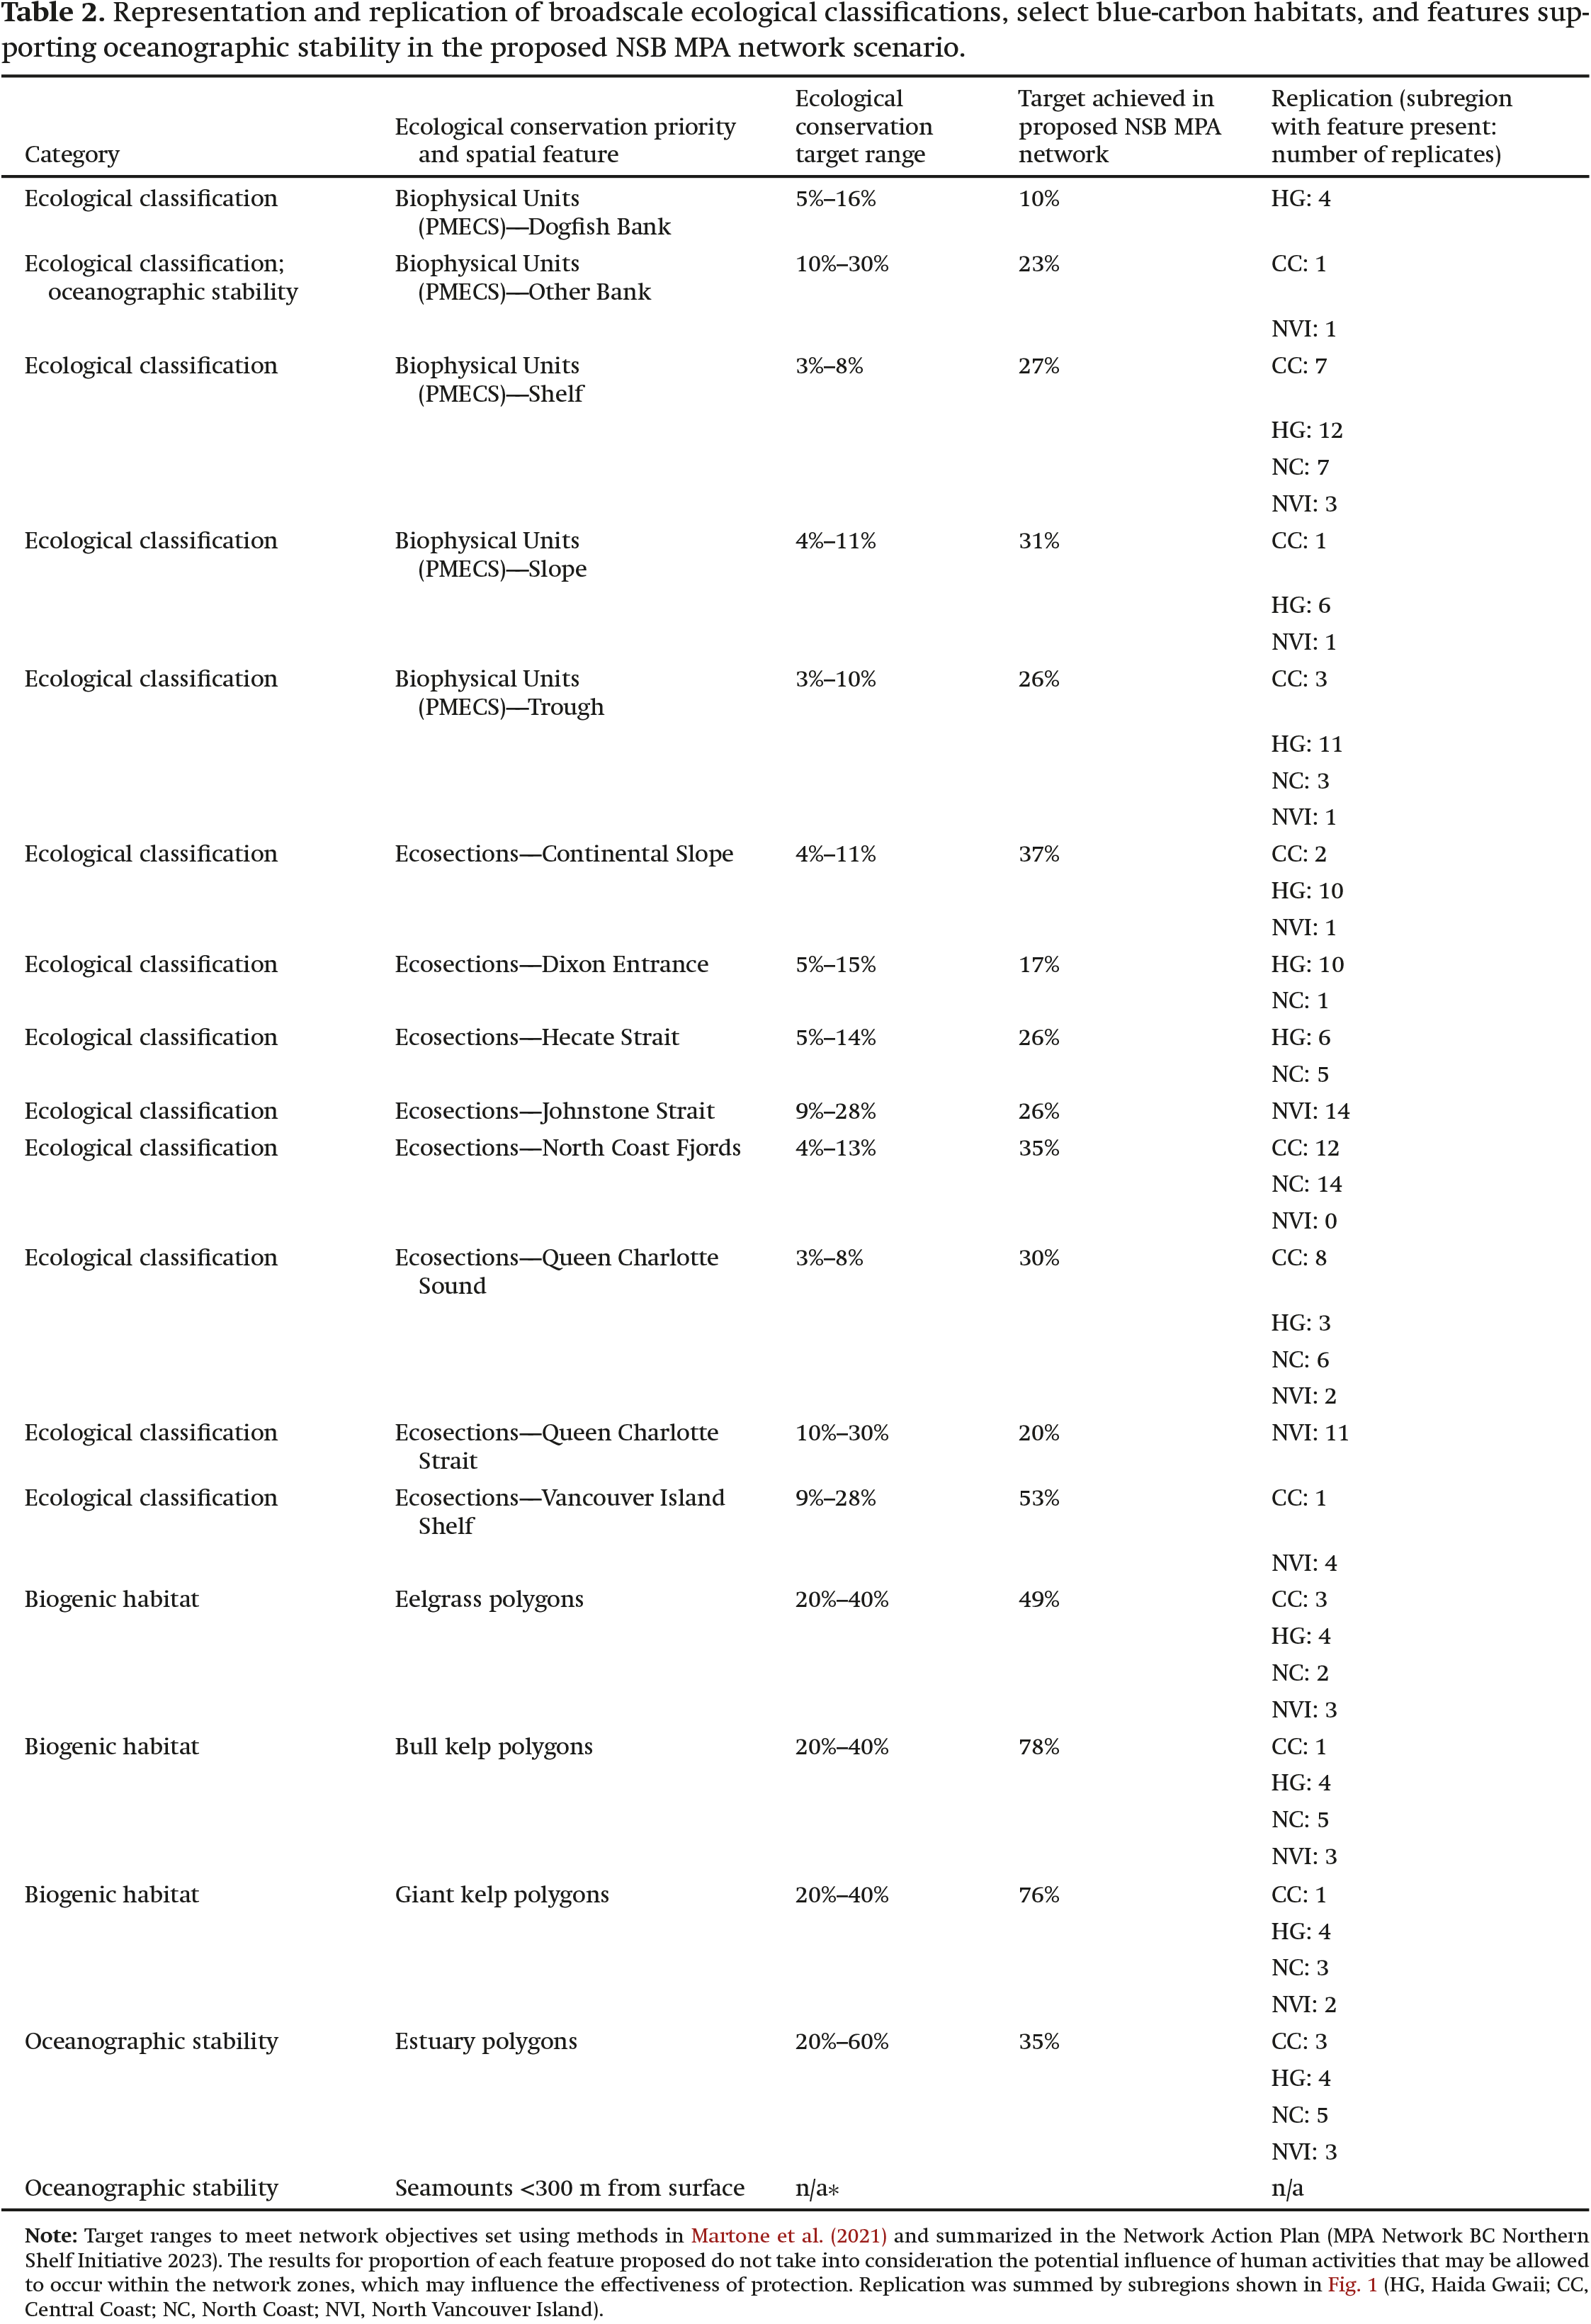
Eelgrass meadows and canopy-forming kelp ecosystems are also well represented and replicated across the MPA network footprint (Table 2), as intended following the recommendations in Martone et al. (2021).
Although no true climate refugia, as defined areas of relative climate stability through time, were identified for the NSB, we evaluated features that may provide more oceanographic stability and determined if they should be incorporated into the proposed network. The only seamount found in the NSB network has a summit depth of ∼800 m from the surface (Du Preez (personal communication)) and therefore does not meet the suggested minimum summit depth for creating some oceanographic stability reported by Ban et al. (2016). The Biophysical Units “Other Banks” classification, however, does capture both Moresby and Goose Islands Banks, where depths at the summits of these rocky banks reach <110 m, supporting recurring oceanographic features that may provide stability, as highlighted in Ban et al. (2016). In addition, zones of freshwater outflow, which we assessed using estuaries, indicate a high proportion of representation, where 35% of mapped estuaries in the NSB are included in the MPA network footprint.
MPA size and spacing
We assessed individual MPA size across the proposed network by MPA type: existing, Category 1, and Category 2. Prior to the development of the MPA network, 51% of existing sites were smaller than the minimum recommended size (<13 km2) with a mean size of 197 km2, ranging from 0.004 km2 (Echo Bay Marine Park) to 7180 km2 (Scott Islands Marine National Wildlife Area). After the implementation of Category 1, 32% of sites in the network (now comprising existing and Category 1 sites) fell below the minimum size, with a mean site area of 242 km2. Once Category 1 and 2 sites are implemented alongside the existing sites, the mean size of the sites in the network increases slightly (to 254 km2). While the median size of sites is 26 km2, about 32% of sites remain below the minimum size guideline (Supplemental Fig. S1). Most of these sites are existing provincial MPAs located in the North Vancouver Island subregion where conservation planning efforts are ongoing (Category 3).
MPA spacing recommendations were met in the proposed MPA network scenario. All individual MPAs in the network are within 200 km of their nearest neighbour, as measured by nautical distance, and 99% of MPAs are within 40 km of their nearest neighbouring MPA.
Physical and biogeochemical changes in the MPA network
Our evaluation of climate change projections across the network indicates that we have captured different climate trajectories across MPAs in the network. Temperature, dissolved oxygen, and aragonite saturation changes are projected to change across the network, but individual MPAs will vary in the degree and types of change (Figs. 3, 4, and S2–S5). For example, shallow MPAs (30 m) are expected to warm more than two times more (mean temperature change: BCCM = +1.3° C, SE = 0.02; NEP36 = +1.76° C, SE = 0.05) than deep MPAs (1000 m) (mean temperature change: BCCM = +0.16° C, SE = 0.04; NEP36 = +0.24° C, SE = 0.09; Table S1). Although oxygen decreases are projected to be higher in shallow than deep MPAs (Fig. 3b), deep MPAs are already near threshold levels for many species, so small losses in O2 at depth are more biologically meaningful than the larger dissolved O2 losses projected in shallow MPAs. Aragonite saturation is also projected to have greater decreases in shallow MPAs than deep MPAs (Figs. 3c, 4e, and 4f), but saturation levels are already lower at depth.
Fig. 3.
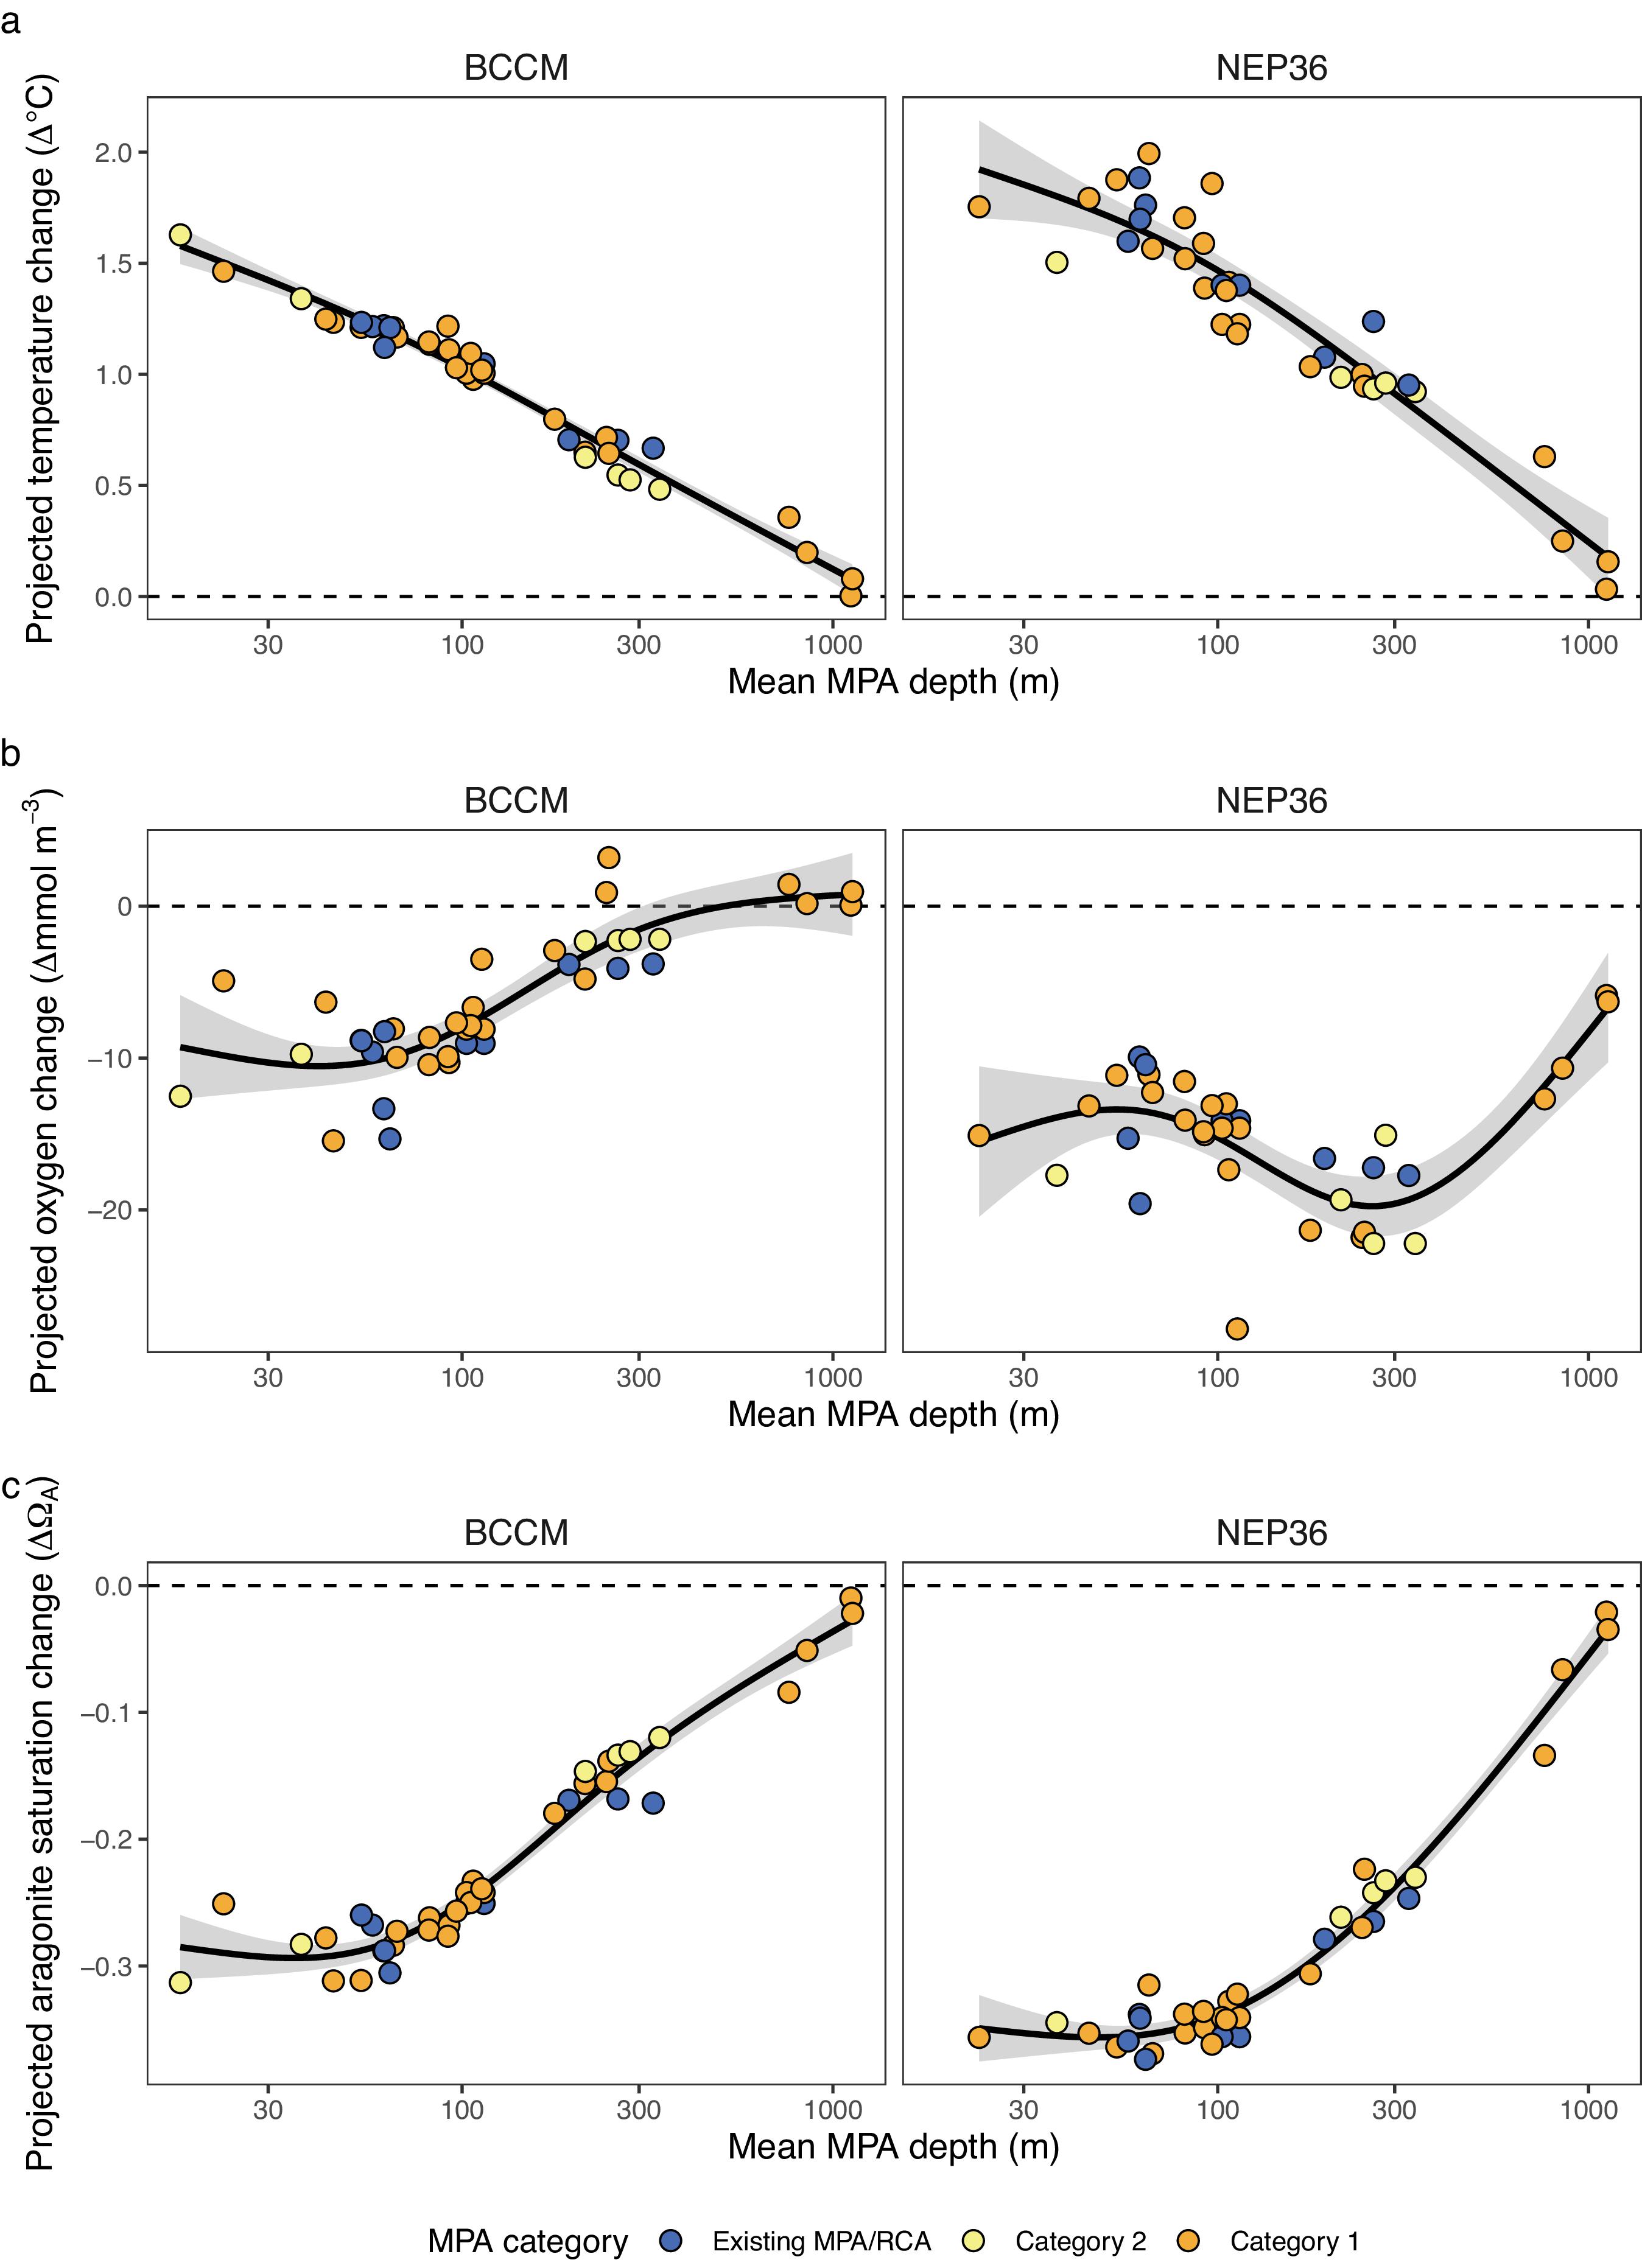
Fig. 4.
Examining the patterns of change by MPA implementation category shows that existing MPAs covered a range from shallow to mid-depths, but the addition of deeper Category 1 network sites improved the representation of variation in climate trajectories of the region, particularly the deepest sites that are generally expected to warm less (Figs. 3 and 4).
Protection of future fish habitats
Fish biodiversity is projected to change under future climate change in the NSB, and the changes vary greatly within the proposed sites of the MPA network, ranging from increases in species in some MPAs to decreases in other MPAs (Figs. 5 and 6). The network as a whole, however, should protect suitable habitat for all 34 groundfish species (see Table S2 for a list of species), both now (historical baseline) and in the future based on an RCP 4.5 scenario for 2046–2065 (Fig. 6), despite some redistribution among network sites.
Fig. 5.
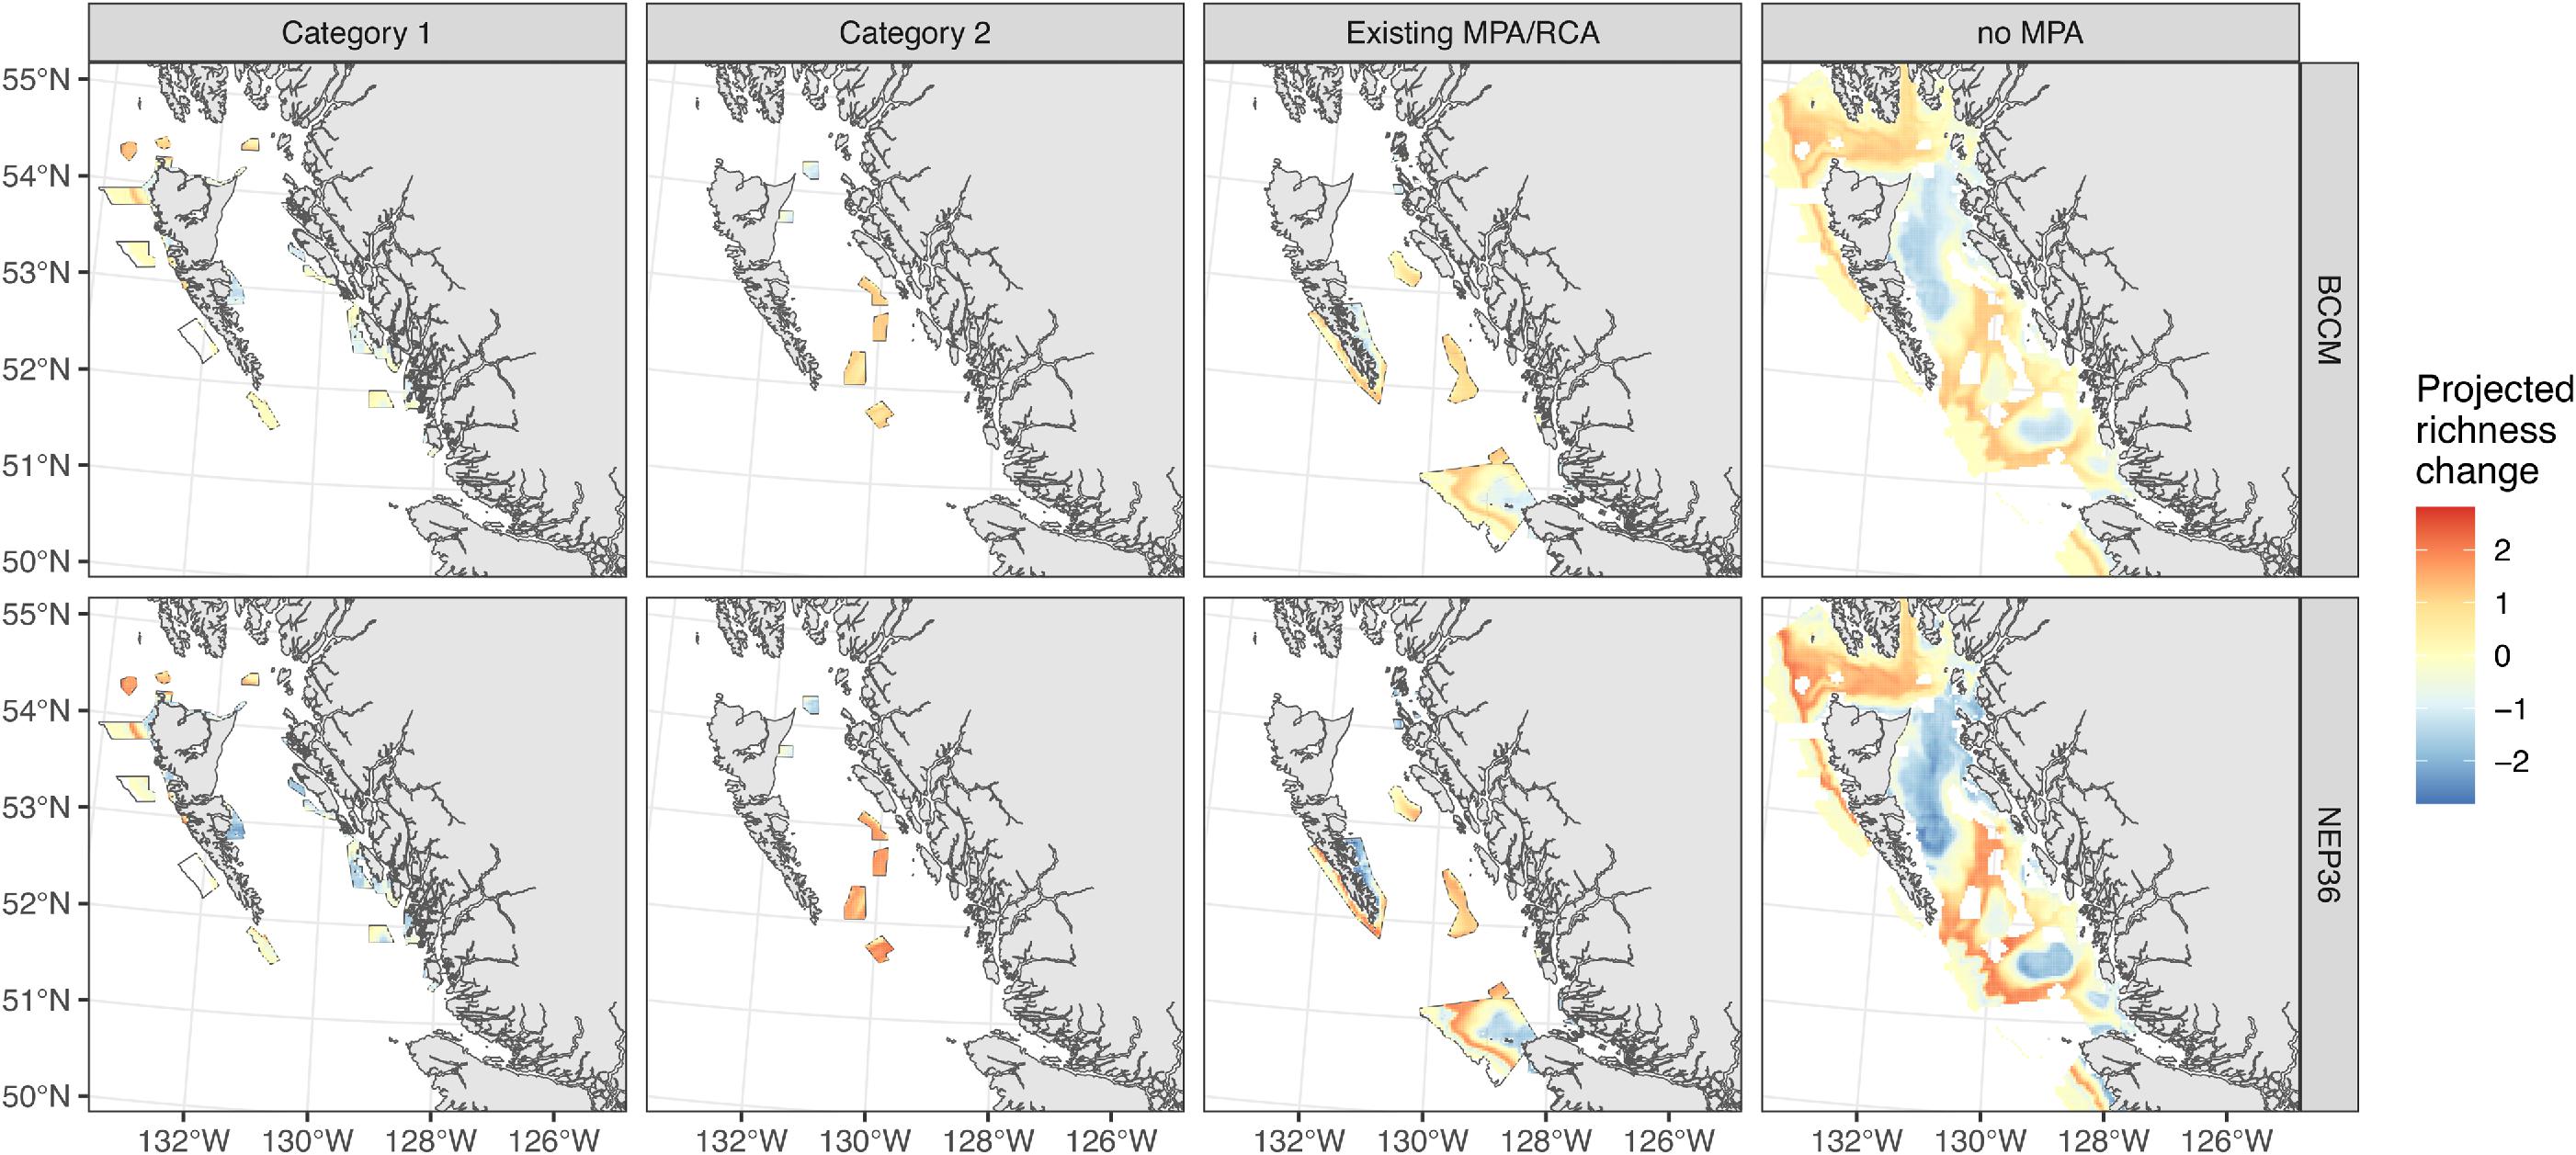
Fig. 6.
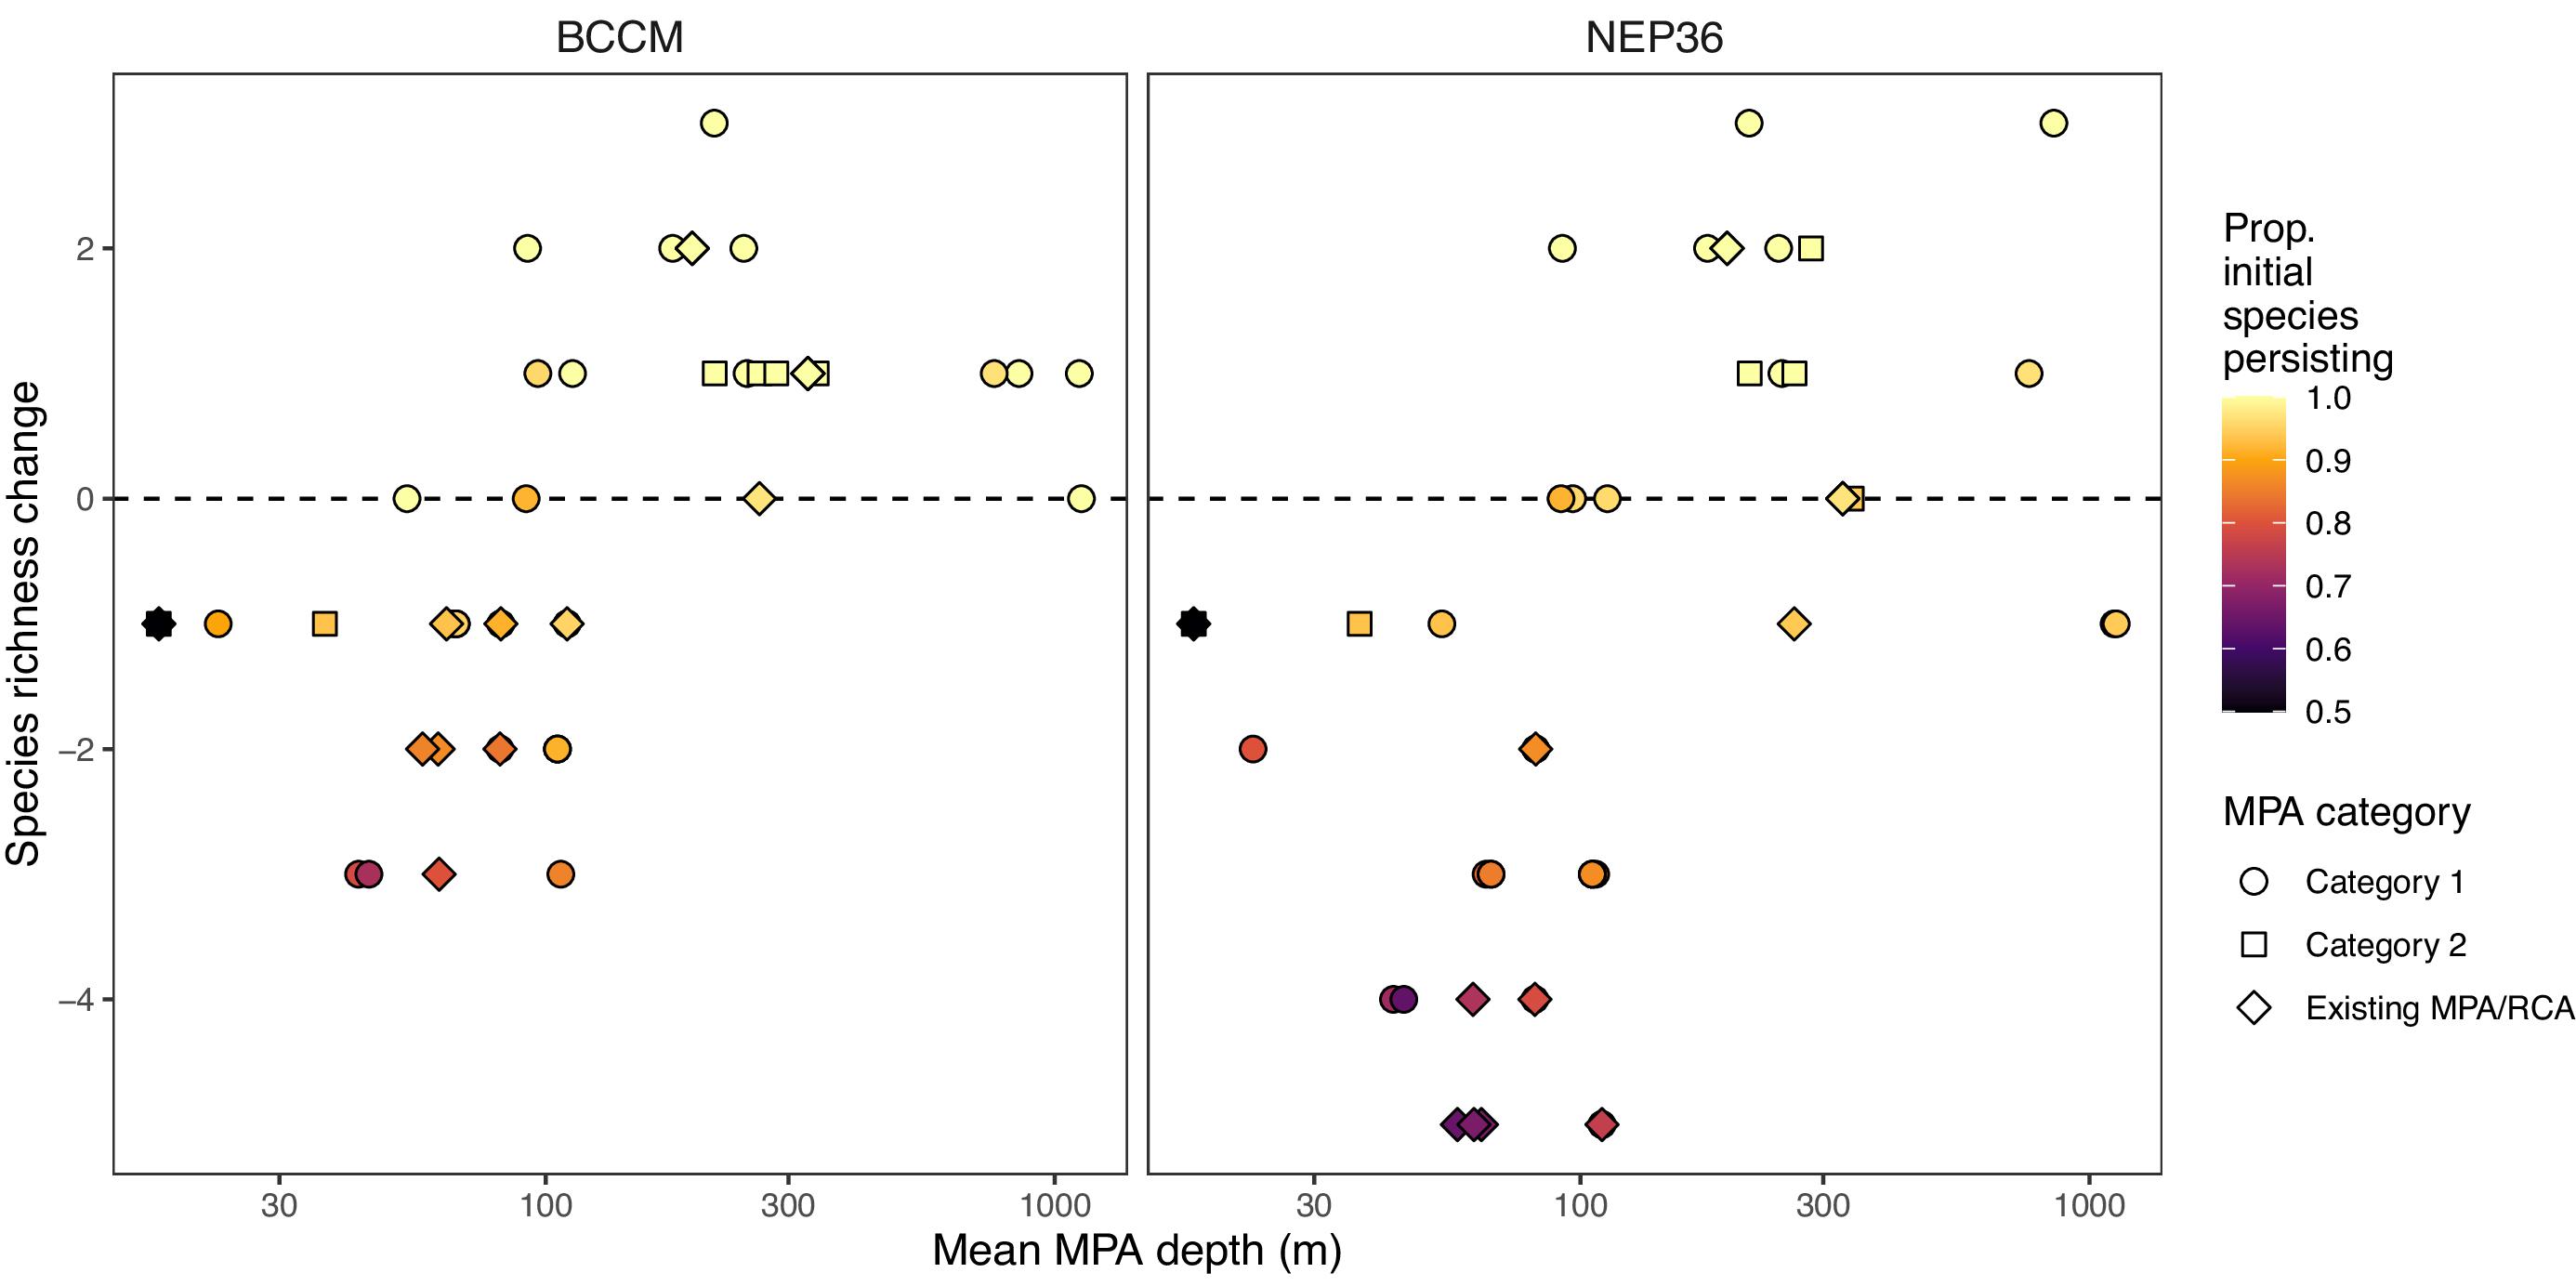
Existing MPAs and Category 1 MPAs span the full range of projected changes at the regional scale, while Category 2 MPAs include more areas where fish biodiversity is projected to increase (Fig. 7). Shallow MPAs are projected to lose the most species, but MPAs at depths of 100 m or greater should retain almost all of their species and may even increase in diversity as shallow species shift to deeper depths to avoid warmer waters (Fig. 6). Consistent with the analyses of physical changes in the MPAs, the warming associated with shallow MPAs is associated with projected decreases in fish richness, and the O2 decreases in some deeper MPAs are also associated with more subtle decreases in fish richness.
Fig. 7.
Discussion
Integrating climate change considerations into MPA network design is a challenging yet necessary task to provide the best chance of recovery, persistence, and adaptation for the species within MPAs. Here we show that a representative network with adequate replication following design principles using the best available data at the time of planning and operationalizing rules of thumb generally results in a climate-robust MPA network. Despite varying degrees of projected changes in temperature, dissolved oxygen, and aragonite saturation across the MPA network, the projected suitable habitat for 34 demersal fish species remains protected within the network footprint under RCP 4.5. This result highlights the importance of networks above individual MPAs and that including the full suite of MPAs within the NSB network is important for overall network climate robustness. For demersal fish species in this region, mid-depth sites are particularly important for persistence, as fish are projected to move deeper to avoid warming in shallower areas. The climate resilience of the NSB network will improve as sites are implemented—protection of suitable habitat for all species under both current and future climates requires all three categories of sites (i.e., existing MPA/RCA, Category 1, and Category 2).
Timing and uncertainty impact the use of spatial outputs in the MPA network design process
Many studies have evaluated the impacts of climate change on MPAs from global to local scales (Bruno et al. 2018; Bates et al. 2019), but there are fewer examples of the extent to which climate change considerations were integrated into MPA network design at the outset. Often, the lack of data or the uncertainty associated with broadscale climate projection models are the barriers to integrating climate change into marine spatial and conservation planning (Tittensor et al. 2019; Wilson et al. 2020), and this was true for this planning process as well. For example, Whitney et al. (2023) used global climate models (GCMs) and available information on correlative marine species distributions in the NSB to better understand where MPAs may protect the most diversity under future climate scenarios. Although this research was concurrent and made available to the MPATT team, the resolution of the data, the scale at which the projected changes were evaluated, and the uncertainty associated with the results made it difficult to confidently integrate it into the MPA network design process. In particular, the scale mismatch between the results and the scale at which MPA boundaries were assessed influenced the ability of the planning team to integrate the results into MPA network design.
The results of Whitney et al. (2023) differ somewhat from the Thompson et al. (2023) projection models used here. These differences are likely due to the use of GCMs by Whitney et al. (2023) compared to the regional climate models available for use by Thompson et al. (2023) that have complex bathymetry with a high enough spatial resolution to resolve important coastal processes (Peña et al. 2019; Holdsworth et al. 2021). Additional differences may be due to the fact that Thompson et al. (2023) explicitly account for the confounding effects of depth on temperature and oxygen. Models that do not account for these effects may overestimate species sensitivity to temperature and oxygen change because they assume that species depth ranges are only due to temperature and oxygen (Davies et al. 2023). This is particularly true in regions such as the NSB, where the composition of biological communities varies greatly over the wide range of depths represented, but only some of this variation can be attributed to temperature and oxygen (Rubidge et al. 2016a; Thompson et al. 2022).
Projecting species distributions under future climates is associated with varying degrees of uncertainty from multiple sources, including uncertainty associated with the underlying climate models, emission scenarios, and eco-evolutionary processes (Davies et al. 2023). For evaluating the climate-robustness of the MPA network, we attempted to reduce uncertainty by using climate projections downscaled from two different climate models. We recommend that multiple regional climate projections for MPA climate resiliency assessments be used when they are available, particularly for complex coastal regions. For our fish SDMs, Thompson et al. (2023) used catch data from throughout the species’ range from California to Alaska, maximizing information from the range of environmental conditions these species inhabit. Although species interactions and other variables (e.g., substrate type, oceanographic currents) likely to influence species’ distributions were not included because they were unavailable for the full dataset, Thompson et al. (2023) showed that models trained on data from 2000–2010 were able to forecast data from 2011–2020 with reasonable accuracy (AUC > 0.7 and Tjur R2 > 0.2; see Thompson et al. 2023). The uncertainty associated with models projecting species responses under future climate change leaves conservation planners with a difficult dilemma. Do they build the MPA networks where species are projected to occur in the future or lock in areas where species are known to occur at the time of planning even though they may move? One way to more confidently incorporate areas of future habitat is to look for “areas of no regret” where there is overlap between where species occur now and are predicted to remain in the future (Heltberg et al. 2009; Davies et al. 2023).
In the case of the NSB MPA network planning process, the timing and availability of other datasets also affected their inclusion in the MPA network design. For example, Friesen et al. (2019) developed a novel method for estimating adult connectivity using a multiplex benthic habitat connectivity model for BC marine waters, and although the outputs of this work were used by MPATT to evaluate competing network scenarios, they were not explicitly incorporated into the design nor used to adjust final network boundaries. Connectivity had already been accounted for using spacing rules, and the overlap of the network scenario with Friesen et al. (2019) areas of high connectivity was sufficient, given there were many other inputs influencing the final network boundaries. In addition, the availability of the outputs of Friesen et al. (2019) came at a time in the planning process after much of the site selection analyses had been completed, making it difficult to integrate. The spacing recommendations for the NSB were met as shown here, suggesting the NSB network is somewhat connected; however, post-hoc assessments of the final proposed network will be conducted as additional multispecies biophysical models for larval and adult connectivity become available.
Climate refugia
Climate refugia had not been identified in the NSB at the time of network development and therefore were not targeted in the site selection analyses. However, climate refugia were explicitly selected as area-based conservation priorities by MPATT following recommendations for building climate-smart MPAs (Tittensor et al. 2019; Wilson et al. 2020). Ban et al. (2016) examined sea surface temperature, sea surface height, and chlorophyll a and found little to no evidence of areas unaffected by climate change in the region. This was similar to our analyses of the regional impacts of climate change on benthic temperature, dissolved O2, and aragonite saturation, as corroborated by the results in the associated more detailed report by Friesen et al. (2021), which also examines sea surface layers for all three variables. The downscaled regional climate models used in these analyses (Peña et al. 2019; Holdsworth et al. 2021) were not available during the initial network design process but were critical to estimating future conditions for MPAs on the continental shelf and to improving our understanding of physical changes and associated biological responses at the regional scale. Having two regional models provides a measure of the regional model uncertainty as both of the models downscaled the same GCM CanESM2. These analyses showed that the projected physical and biogeochemical environmental changes in the MPA network varied by depth, with deeper, cooler MPAs changing more slowly than shallow areas, providing some refuge for species adapted to deep waters. Many Category 2 sites in the MPA network cover mid-depths (100–300 m) that may become increasingly important not just for shallow species moving deeper but also for deeper species moving shallower to avoid areas of hypoxia (Ross et al. 2020; Thompson et al. 2023), further highlighting the importance of fulfilling the entire MPA network implementation strategy by 2030, as currently planned.
MPA blue carbon co-benefits
In the NSB MPA network, habitats that are likely to provide carbon storage and sequestration ecosystem services were identified as conservation priorities and targeted in the site selection analyses based on their importance as habitats for numerous fish and invertebrates. Therefore, any carbon storage or sequestration services they provide serve as a co-benefit of the MPA network. Our results show that eelgrass meadows and kelp forests are well-represented and replicated across the network, building insurance against localized climate stressors at the site level. In this region, coastwide datasets of kelp and eelgrass are known to be patchy. Although we are reporting a high proportion of these habitat types within the network footprint, the distribution of kelp and eelgrass across the entire coast is likely underestimated. The patchiness of the kelp dataset used, especially in the central coast subregion, is likely influencing our accounting of replicates, where we report only one replicate of both bull and giant kelp in the central coast subregion. From localized studies in the central coast subregion, we know more kelp inhabits the area (Nijland et al. 2019), and efforts are underway to improve our understanding of kelp distribution coastwide. As new, more comprehensive datasets become available, along with targeted monitoring, these analyses can be redone.
Marine heatwaves (discrete periods of anomalously warm water; Hobday et al. (2016)) have become more frequent, extensive, and intense (Frölicher et al. 2018) and are impacting seagrass, kelp, and other coastal ecosystems around the world (Arias-Ortiz et al. 2018; Wernberg et al. 2018; Bass et al. 2023). In the East Pacific, the marine heatwave that persisted from 2014–2016 impacted multiple species, including kelp ecosystems (Cavanaugh et al. 2019; McPherson et al. 2021; Rogers-Bennett et al. 2021; Bell et al. 2023; Free et al. 2023). For example, bull kelp forests (Nereocystis) have decreased dramatically over the last decade at the southernmost edge of their range in California (McPherson et al. 2021; Bell et al. 2023), but trends in our region show that floating kelp forests in exposed areas are more persistent (Pfister et al. 2018), even at very fine scales (Starko et al. 2022). The varying environmental conditions that impact this foundational species highlight the need for protection and monitoring, and that replication at broad scales (as achieved in the NSB network) and also at fine scales is necessary for kelp persistence at the network level.
Our regional climate models have a grid spacing of 2–3 km which is not enough to resolve the nearshore. As a result, we currently understand less about future climate impacts in the shallow and fjord ecosystems compared to the shelf and slope ecosystems on the BC coast. Given this uncertainty, representation and adequate replication of these important coastal blue carbon ecosystems are even more critical as a strategy for building climate resilience. In addition to eelgrass meadows and kelp beds, the NSB MPA network has the potential to protect other blue-carbon ecosystems within its boundaries. This includes estuaries and salt marshes (e.g., Douglas et al. 2022), carbon stores in marine sediment protected from disturbance (e.g., Epstein and Roberts 2022), and cold water glass sponge reefs (Dunham et al. 2018). For example, the Hecate Strait/Queen Charlotte Sound Glass Sponge Reefs MPA, an existing site within the MPA network, protects up to ∼345 km2 of glass sponge reef and has the potential to be important for carbon sequestration and storage. Depending on the amount of live, healthy tissue present, glass sponge reefs have been estimated to sequester 1 g of carbon per m2 per day (Dunham et al. 2018), and 7% to 11% of their tissues (depending on sponge species) consist of carbon (Archer et al. 2020), with additional carbon being sequestered into sediments. Although a full assessment of potential blue carbon co-benefits was not conducted here, just this cursory analysis highlights the value of the network for protecting blue carbon ecosystems and the need for effective management, monitoring, and communication of co-benefits once the network is established.
Adaptive management and monitoring
Our analysis suggests that suitable demersal fish habitat will remain within the network footprint into the future (2046–2065); however, effective protection for these species depends on the management of the areas. In addition, while many demersal fish may shift to deeper waters as conditions warm, not all species are adapted to the conditions experienced in deeper waters. Shallow species, which were mostly excluded from our analysis, may be particularly vulnerable, as shallow waters (<100 m) are projected to experience the greatest environmental change due to climate change. Therefore, protection from other stressors will be particularly important to buffer these nearshore species and ecosystems as the climate changes. Studies have shown that other stressors may be important for resilience against climate stress, particularly coral reefs (Côté and Darling 2010; Bruno et al. 2019); however, global analyses have shown that to provide the highest climate mitigation benefits, MPAs must be highly or fully protected (Jacquemont et al. 2022). The NSB MPA network is intended to have a range of protection levels across sites; therefore, integrated monitoring of human pressures, ecological responses, and climate variables across the network will be key to understanding ecosystem recovery, climate resilience, and any potential climate mitigation benefits.
As an overarching influencing factor, it is recommended that climate change be integrated into MPA management and monitoring (Bryndum-Buchholz et al. 2022); however, to date, federal and provincial MPAs in Canada have not often explicitly addressed climate change in their management plans (O'Regan et al. 2021). Information on potential climate impacts, like downscaled regional climate models and associated models of projected biological responses, can be used to inform monitoring plans and survey design. For example, for conservation priorities in the NSB MPA network, stratified monitoring across representative depths will help to validate models and better understand how species may redistribute among individual MPAs in the network to track projected temperature or oxygen changes. Finally, understanding the climate-related sensitivity of the species and habitats protected in the network should be linked to indicators for monitoring and to management measures to ensure climate change is integrated throughout the adaptive management cycle for the MPA network.
Acknowledgements
We would like to thank S. Diggon, K. Worsley, K. Leslie, J. Dunham, A. Heidt, and all the members of the Marine Protected Area Network Technical Committee for their leadership and participation in the NSB MPA network planning process and for their contributions that helped shape the research in this paper. This includes representatives from the following partners: Gitga'at, Gitxaala, Haisla, Kitselas, Kitsumkalum, Metlakatla, Heiltsuk, Kitasoo/Xai'xais, Nuxalk, Wuikinuxv, Mamalilikulla, Kwiakah, Tlowitsis, and Wei Wai Kum First Nations; Council of the Haida Nation; the Province of British Columbia; and the Government of Canada. This research was funded, in part, by the Fisheries and Oceans Marine Conservation Targets Program.
References
Archer S.K., Kahn A.S., Thiess M., Law L., Leys S.P., Johannessen S.C., et al. 2020. Foundation species abundance influences food web topology on glass sponge reefs. Frontiers in Marine Science, 7: 549478.
Arias-Ortiz A., Serrano O., Masqué P., Lavery P.S., Mueller U., Kendrick G.A., et al. 2018. A marine heatwave drives massive losses from the world's largest seagrass carbon stocks. Nature Climate Change, 8: 338–344.
Balbar A.C., Metaxas A. 2019. The current application of ecological connectivity in the design of marine protected areas. Global Ecology and Conservation, 17: e00569.
Ban S.S., Alidina H.M., Okey T.A., Gregg R.M., Ban N.C. 2016. Identifying potential marine climate change refugia: a case study in Canada's Pacific marine ecosystems. Global Ecology and Conservation, 8: 41–54.
Barnosky A.D. 2008. Climatic change, refugia, and biodiversity: where do we go from here? An editorial comment. Climatic Change, 86: 29–32.
Bass A.V., Smith K.E., Smale D.A. 2023. Marine heatwaves and decreased light availability interact to erode the ecophysiological performance of habitat-forming kelp species. Journal of Phycology, 59(3): 481–495.
Bates A.E., Cooke R.S.C., Duncan M.I., Edgar G.J., Bruno J.F., Benedetti-Cecchi L., et al. 2019. Climate resilience in marine protected areas and the ‘Protection Paradox’. Biological Conservation, 236: 305–314.
Bell G., Gonzalez A. 2009. Evolutionary rescue can prevent extinction following environmental change. Ecology Letters, 12: 942–948.
Bell T.W., Cavanaugh K.C., Saccomanno V.R., Cavanaugh K.C., Houskeeper H.F., Eddy N., et al. 2023. Kelpwatch: a new visualization and analysis tool to explore kelp canopy dynamics reveals variable response to and recovery from marine heatwaves. PLoS One, 18(3): e0271477.
Boldt J.L., Javorski A., Chandler P. 2021. State of the physical, biological and selected fishery resources of Pacific Canadian marine ecosystems in 2020. Canadian Technical Report of Fisheries and Aquatic Sciences, 3434: vii + 231.
British Columbia Marine Conservation Analysis (BCMCA) Project Team. 2011. Marine atlas of Pacific Canada: a product of the British Columbia marine conservation analysis.
Bruno J.F., Bates A.E., Cacciapaglia C., Pike E.P., Amstrup S.C., Van Hooidonk R., et al. 2018. Climate change threatens the world's marine protected areas. Nature Climate Change, 8: 499–503.
Bruno J.F., Côté I.M., Toth L.T. 2019. Climate change, coral loss, and the curious case of the parrotfish paradigm: why don't marine protected areas improve reef resilience? Annual Review of Marine Science, 11: 307–334.
Bryan-Brown D.N., Brown C.J., Hughes J.M., Connolly R.M. 2017. Patterns and trends in marine population connectivity research. Marine Ecology Progress Series, 585: 243–256.
Bryndum-Buchholz A., Boerder K., Stanley R.R.E., Hurley I., Boyce D.G., Dunmall K.M., et al. 2022. A climate-resilient marine conservation network for Canada. Facets, 7: 571–590.
Buenafe K.C.V., Dunn D.C., Everett J.D., Brito-Morales I., Schoeman D.S., Hanson J.O., et al. 2023. A metric-based framework for climate-smart conservation planning. Ecological Applications, 33: e2852.
Burt J.M., Akins P., Lathem E., Beck M., Salomon A.K., Ban N.C. 2014. Marine protected area network design features that support resilient human-oceam systems—applications for British Columbia, Canada. Simon Fraser University, Vancouver, BC, Canada.
Canada—British Columbia marine protected area network strategy. 2014.
Carr M.H., Robinson S.P., Wahle C., Davis G., Kroll S., Murray S., et al. 2017. The central importance of ecological spatial connectivity to effective coastal marine protected areas and to meeting the challenges of climate change in the marine environment. Aquatic Conservation, 27: 6–29.
Cavanaugh K.C., Reed D.C., Bell T.W., Castorani M.N., Beas-Luna R. 2019. Spatial variability in the resistance and resilience of giant kelp in Southern and Baja California to a multiyear heatwave. Frontiers in Marine Science, 6: 413.
CBD. 2022. Kunming–Montreal Global Biodiversity Framework. Conference to the Parties to the Convention on Biological Diversity 15th Meeting– Part II, Montreal, Canada, 7–19 December. UN Environment Program. Available from https://www.cbd.int/doc/c/e6d3/cd1d/daf663719a03902a9b116c34/cop-15-l-25-en.pdf.
CCFN. 2012. Central Coast First Nations marine use plan: executive summary.
Cheung W.W.L., Frölicher T.L. 2020. Marine heatwaves exacerbate climate change impacts for fisheries in the northeast Pacific. Scientific Reports, 10: 6678.
Côté I.M., Darling E.S. 2010. Rethinking ecosystem resilience in the face of climate change. PLoS Biology, 8: e1000438.
D'Aloia C.C., Daigle R.M., Côté I.M., Curtis J.M.R., Guichard F., Fortin M.-J. 2017. A multiple-species framework for integrating movement processes across life stages into the design of marine protected areas. Biological Conservation, 216: 93–100.
Davies S.C., Thompson P.L., Gomez C., Nephin J., Knudby A., Park A.E., et al. 2023. Adressing uncertainty when projecting marine species distrubutions under climate change. Ecography, e06731. 2023.
DFO. 2009. Development of a framework and principles for the biogeographic classification of Canadian marine waters. DFO Canadian Science Advisory Secretariat Report, 2009/056.
DFO. 2017. Framework for the identification of ecological conservation priorities for the marine protected area network design and its application in the Northern Shelf Bioregion. DFO Canadian Science Advisory Secretariat Report,2017/019.
DFO. 2019. Design strategies for the Northern Shelf Bioregional marine protected area network. DFO Canadian Science Advisory Secretariat Report, 2019/026.
Douglas T.J., Schuerholz G., Juniper S.K. 2022. Blue carbon storage in a Northern temperate estuary subject to habitat loss and chronic habitat disturbance, Cowichan Estuary, British Columbia, Canada. Frontiers in Marine Science, 9: 857586.
Dunham A., Archer S.K., Davies S.C., Burke L.A., Mossman J., Pegg J.R., et al. 2018. Assessing condition and ecological role of deep-water biogenic habitats: glass sponge reefs in the Salish Sea. Marine Environmental Research, 141: 88–99.
Edgar G.J., Stuart-Smith R.D., Willis T.J., Kininmonth S., Baker S.C., Banks S., et al. 2014. Global conservation outcomes depend on marine protected areas with five key features. Nature, 506: 216–220.
English P.A., Ward E.J., Rooper C.N., Forrest R.E., Rogers L.A., Hunter K.L., et al. 2022. Contrasting climate velocity impacts in warm and cool locations show that effects of marine warming are worse in already warmer temperate waters. Fish and Fisheries, 23: 239–255.
Epstein G., Roberts C.M. 2022. Does biodiversity-focused protection of the seabed deliver carbon benefits? A UK case study. Conservation Letters, 9: e12929.
ESRI. 2019. ArcGIS Desktop 10.7.1. Redlands, CA, USA.
Free C.M., Anderson S.C., Hellmers E.A., Muhling B.A., Navarro M.O., Richerson K., et al. 2023. Impact of the 2014–2016 marine heatwave on US and Canada West Coast fisheries: surprises and lessons from key case studies. Fish and Fisheries, 24: 652–674.
Friesen S.K., Martone R., Rubidge E., Baggio J.A., Ban N.C. 2019. An approach to incorporating inferred connectivity of adult movement into marine protected area design with limited data. Ecological Applications, 29: e01890.
Friesen S.K., Ban N.C., Holdsworth A.M., Peña M.A., Christian J., Hunter K.L. 2021. Physical impact of projected climate change within marine protected areas in the Pacific Bioregions. Canadian Technical Report of Fisheries and Aquatic Sciences, 3422: iv + 60.
Frölicher T.L., Fischer E.M., Gruber N. 2018. Marine heatwaves under global warming. Nature, 560: 360–364.
Gale K.S.P., Frid A., Lee L., Mccarthy J.-B., Robb C.K., Rubidge E., et al. 2019. A framework for identification of ecological conservation priorities for marine protected area network design and its application in the Northern Shelf Bioregion. Canadian Science Advisory Secretariat Research Documnet 2018/055. pp. viii + 186.
Green A.L., Fernandes L., Almany G., Abesamis R., Mcleod E., Aliño P.M., et al. 2014. Designing marine reserves for fisheries management, biodiversity conservation, and climate change adaptation. Coastal Management, 42: 143–159.
Grorud-Colvert K., Sullivan-Stack J., Roberts C., Constant V., Horta E.C.B., Pike E.P., et al. 2021. The MPA Guide: a framework to achieve global goals for the ocean. Science, 373: eabf0861.
Haidvogel D.B., Arango H., Budgell W.P., Cornuelle B.D., Curchitser E., Di Lorenzo E., et al. 2008. Ocean forecasting in terrain-following coordinates: formulation and skill assessment of the regional ocean modeling system. Journal of Computational Physics, 227: 3595–3624.
Heltberg R., Siegel P.B., Jorgensen S.L. 2009. Addressing human vulnerability to climate change: toward a ‘no-regrets’ approach. Global Environmental Change, 19: 89–99.
Hobday A.J., Alexander L.V., Perkins S.E., Smale D.A., Straub S.C., Oliver E.C.J., et al. 2016. A hierarchical approach to defining marine heatwaves. Progress in Oceanography, 141: 227–238.
Holdsworth A.M., Zhai L., Lu Y., Christian J.R. 2021. Future changes in oceanography and biogeochemistry along the Canadian Pacific continental margin. Frontiers in Marine Science, 8: 602991.
Jacquemont J., Blasiak R., Le Cam C., Le Gouellec M., Claudet J. 2022. Ocean conservation boosts climate change mitigation and adaptation. One Earth, 5: 1126–1138.
Jankowska E., Pelc R., Alvarez J., Mehra M., Frischmann C.J. 2022. Climate benefits from establishing marine protected areas targeted at blue carbon solutions. Proc. Natl. Acad. Sci. U.S.A., 119: e2121705119.
Krause-Jensen D., Duarte C.M. 2016. Substantial role of macroalgae in marine carbon sequestration. Nature Geosci, 9, 737–742.
Lieberknecht L., Ardron J.A., Ban N.C., Bennett J.R., Hooper T.E.J., Robinson C.L.K. 2016. Recommended guidelines for applying Canada-BC Marine Protected Area Network Principles in Canada's Northern Shelf Bioregion: Principles1,2,3,5,6,7,8,9,11,14 and 15. Report produced by PacMARA for the British Columbia Marine Protected Area Technical Team (MPATT).
Madec G. 2008. NEMO ocean engine. Note Du P ô le De Mod é lisation. Institut PierreSimon Laplace (IPSL), France No 27, ISSN No 1288-1619.
Magris R.A., Pressey R.L., Weeks R., Ban N.C. 2014. Integrating connectivity and climate change into marine conservation planning. Biological Conservation, 170: 207–221.
MaPP. 2015. Marine Plan Partnership Initiative: Haida Gwaii Marine Plan.
Margules C.R., Pressey R.L. 2000. Systematic conservation planning. Nature, 405: 243–253.
Martone R.G., Robb C.K., Gale K.S.P., Frid A., Mcdougall C., Rubidge E.M. 2021. Design strategies for the Northern Shelf bioregional marine protected area network. DFO Canadian Science Advisory Secretariat Research Document, 2021/024. pp. xi + 156.
Mcpherson M.L., Finger D.J.I., Houskeeper H.F., Bell T.W., Carr M.H., Rogers-Bennett L., et al. 2021. Large-scale shift in the structure of a kelp forest ecosystem co-occurs with an epizootic and marine heatwave. Communications Biology, 4: 298.
Micheli F., Saenz-Arroyo A., Greenley A., Vazquez L., Espinoza Montes J.A., Rossetto M., et al. 2012. Evidence that marine reserves enhance resilience to climatic impacts. PLoS One, 7: e40832.
Morelli T.L., Daly C., Dobrowski S.Z., Dulen D.M., Ebersole J.L., Jackson S.T., et al. 2016. Managing climate change refugia for climate adaptation. PLoS One, 11: e0159909.
Morrison J., Callendar W., Foreman M.G.G., Masson D., Fine I. 2014. A model simulation of future oceanic conditions along the British Columbia continental shelf. Part I: forcing fields and initial conditions. Atmosphere-Ocean, 52: 1–19.
Moss R.H., Edmonds J.A., Hibbard K.A., Manning M.R., Rose S.K., Van Vuuren D.P., et al. 2010. The next generation of scenarios for climate change research and assessment. Nature, 463: 747–756.
MPA Network BC Northern Shelf Initiative. 2023. Network action plan.
Nijland W., Reshitnyk L., Rubidge E. 2019. Satellite remote sensing of canopy-forming kelp on a complex coastline: a novel procedure using the Landsat image archive. Remote Sensing of Environment, 220: 41–50.
Norberg J., Urban M.C., Vellend M., Klausmeier C.A., Loeuille N. 2012. Eco-evolutionary responses of biodiversity to climate change. Nature Climate Change, 2: 747–751.
O'Regan S.M., Archer S.K., Friesen S.K., Hunter K.L. 2021. A global assessment of climate change adaptation in marine protected area management plans. Frontiers in Marine Science, 8: 711085.
Olds A.D., Pitt K.A., Maxwell P.S., Babcock R.C., Rissik D., Connolly R.M. 2014. Marine reserves help coastal ecosystems cope with extreme weather. Global Change Biology, 20: 3050–3058.
Orr H.A., Unckless R.L. 2014. The population genetics of evolutionary rescue. PLoS Genetics, 10(8): e1004551.
Ovaskainen O., Abrego N. 2020. Joint species distribution modelling: with applications in R. Cambridge University Press, UK.
Pacific Birds Habitat Joint Venture Technical Team. 2020. Pacific estuary conservation program identified estuaries of British Columbia mapping and ranking project: 2019 update. p. 44.
Pacific North Coast Integrated Management Area (PNCIMA) Initiative. 2017. Pacific North Coast integrated managment area plan. pp. vii ± 78.
Palumbi S.R. 2004. Marine reserves and ocean neighborhoods: the spatial scale of marine populations and their management. Annual Review of Environment and Resources, 29: 31–68.
Pebesma E., 2018. Simple features for R: standardized support for spatial vector data. The R Journal, 10(1): 439–446.
Peña M.A., Fine I., Callendar W. 2019. Interannual variability in primary production and shelf-offshore transport of nutrients along the northeast Pacific Ocean margin. Deep Sea Research Part II: Topical Studies in Oceanography, 169–170: 104637.
Peña M.A., Fine I. 2023. Future physical and biogeochemical ocean conditions under climate change along the British Columbia continental margin. Atmosphere-Ocean. 1.
Pfister C.A., Berry H.D., Mumford T. 2018. The dynamics of Kelp forests in the Northeast Pacific Ocean and the relationship with environmental drivers. Journal of Ecology, 106: 1520–1533.
Pinsky M.L., Worm B., Fogarty M.J., Sarmiento J.L., Levin S.A. 2013. Marine taxa track local climate velocities. Science, 341: 1239–1242.
PMO. 2021. Minister of fisheries, oceans and the Canadian Coast Guard mandate letter. Available from https://www.pm.gc.ca/en/mandate-letters/2021/12/16/minister-fisheries-oceans-and-canadian-coast-guard-mandate-letter.
Proudfoot B., Robb C.K. 2022. Eelgrass (Zostera marina) spatial data updated from BCMCA version. In press.
R Core Team. 2022. R: a language and environment for statistical computing. R Foundation for Statistical Computing, Vienna, Austria. Available from https://www.R-project.org/.
Reid M., Collins M.L., Hall S.R.J., Mason E., Mcgee G., Frid A. 2022. Protecting our coast for everyone's future: indigenous and scientific knowledge support marine spatial protections proposed by Central Coast First Nations in Pacific Canada. People and Nature, 4: 1052–1070.
Roberts C.M., O'leary B.C., Mccauley D.J., Cury P.M., Duarte C.M., Lubchenco J., et al. 2017. Marine reserves can mitigate and promote adaptation to climate change. Proceedings of the National Academy of Sciences of the United States of America,114: 6167–6175.
Rogers-Bennett L., Klamt R., Catton C.A. 2021. Survivors of climate driven abalone mass mortality exhibit declines in health and reproduction following Kelp Forest collapse. Frontiers in Marine Science, 8: 725134.
Röhr M.E., Holmer M., Baum J.K., Björk M., Boyer K., Chin D., et al. 2018. Blue carbon storage capacity of temperate eelgrass (Zostera marina) meadows. Global Biogeochemical Cycles, 32: 1457–1475.
Ross T., Du Preez C., Ianson D. 2020. Rapid deep ocean deoxygenation and acidification threaten life on Northeast Pacific seamounts. Global Change Biology, 26: 6424–6444.
Rubidge E., Jeffery S., Gregr E.J., Gale K.S.P., Frid A. 2020. Assessment of nearshore features in the Northern Shelf Bioregion against criteria for determining ecologically and biologically significant areas (EBSAs). DFO Canadian Science Advisory Secretariat Research Document, 2020/023. pp. vii + 63.
Rubidge E.M.,Gale K.S.P., Curtis J.M.R. 2016a. Community ecological modelling as an alternative to physiographic classifications for marine conservation planning. Biodiversity and Conservation, 25: 1899–1920.
Rubidge E.M., Gale K.S.P., Curtis J.M.R., Mcclellend E., Feyrer L., Bodtker K.M., et al. 2016b. Methodology of the Pacific Marine Ecological Classification System and its application to the Northern and southern shelf bioregion. DFO Canadian Science Advisory Secretariat Research Document, 2016/035. pp. xi + 124.
Sala E., Mayorga J., Bradley D., Cabral R.B., Atwood T.B., Auber A., et al. 2021. Protecting the global ocean for biodiversity, food and climate. Nature, 592. 397.
Selig E.R., Casey K.S., Bruno J.F. 2012. Temperature-driven coral decline: the role of marine protected areas. Global Change Biology, 18: 1561–1570.
Shanks A.L. 2009. Pelagic larval duration and dispersal distance revisited. The Biological Bulletin, 216: 373–385.
Starko S., Neufeld C.J., Gendall L., Timmer B., Campbell L., Yakimishyn J., et al. 2022. Microclimate predicts kelp forest extinction in the face of direct and indirect marine heatwave effects. Ecological Applications, 32: e2673.
Stevenson A., Archer S.K., Schultz J.A., Dunham A., Marliave J.B., Martone P., et al. 2020. Warming and acidification threaten glass sponge aphrocallistes vastus pumping and reef formation. Scientific Reports, 10: 8176.
Thompson P.L., Fronhofer E.A. 2019. The conflict between adaptation and dispersal for maintaining biodiversity in changing environments. Proceedings of the National Academy of Sciences of the United States of America, 116: 21061–21067.
Thompson P.L., Anderson S.C., Nephin J., Haggarty D.R., Peña M.A., English P.A., et al. 2022. Disentangling the impacts of environmental change and commercial fishing on demersal fish biodiversity in a northeast Pacific ecosystem. Marine Ecology Progress Series, 689: 137–154.
Thompson P.L., Rooper C.N., Nephin J., Park A.E., Christian J.R., Davies S.C., et al. 2023. Response of Pacific halibut (Hippoglossus stenolepis) to future climate scenarios in the Northeast Pacific Ocean. Fisheries Research, 258: 106540.
Tittensor D.P., Beger M., Boerder K., Boyce D.G., Cavanagh R.D., Cosandey-Godin A., et al. 2019. Integrating climate adaptation and biodiversity conservation in the global ocean. Science Advances, 5: eaay9969.
Unsworth R.K.F., Cullen-Unsworth L.C., Jones B.L.H., Lilley R.J. 2022. The planetary role of seagrass conservation. Science, 377: 609–613.
Walsworth T.E., Schindler D.E., Colton M.A., Webster M.S., Palumbi S.R., Mumby P.J., et al. 2019. Management for network diversity speeds evolutionary adaptation to climate change. Nature Climate Change, 9: 632–636.
WCPA/IUCN. 2007. Establishing networks of marine protected areas: a guide for developing national and regional capacity for building MPA networks. Non-technical summary report. 8.5x11_interior_pages (cbd.int).
Weatherdon L.V., Magnan A.K., Rogers A.D., Sumaila U.R., Cheung W.W.L. 2016. Observed and projected impacts of climate change on marine fisheries, aquaculture, coastal tourism, and human health: an update. Frontiers in Marine Science, 3: 48.
Wernberg T., Coleman M.A., Bennett S., Thomsen M.S., Tuya F., Kelaher B.P. 2018. Genetic diversity and kelp forest vulnerability to climatic stress. Scientific Reports, 8: 1851.
Whitney C.K., Frid A., Edgar B.K., Walkus J., Siwallace P., Siwallace I.L., et al. 2020. “Like the plains people losing the buffalo”: perceptions of climate change impacts, fisheries management, and adaptation actions by indigenous peoples in coastal British Columbia, Ecology and Society, 25(4): 33.
Whitney C.K., Cheung W.W.L., Ban N.C. 2023. Considering the implications of climate-induced species range shifts in marine protected area planning. Facets, 8: 1–10.
Wilson K.L., Tittensor D.P., Worm B., Lotze H.K. 2020. Incorporating climate change adaptation into marine protected area planning. Global Change Biology, 26: 3251–3267.
Zacharias M.A., Howes D.E., Harper J.R., Wainwright P. 1998. The British Columbia marine ecosystem classification: rationale, development, and verification. Coastal Management, 26: 105–124.
Ziegler S.L., Johnson J.M., Brooks R.O., Johnston E.M., Mohay J.L., Ruttenberg B.I., et al. 2023. Marine protected areas, marine heatwaves, and the resilience of nearshore fish communities. Scientific Reports, 13: 1405.
Supplementary material
Supplementary Material 1 (DOCX / 341 KB).
- Download
- 341.88 KB
Information & Authors
Information
Published In
FACETS
Volume 9 • January 2024
Pages: 1 - 18
Editor: Derek Tittensor
History
Received: 17 July 2023
Accepted: 27 October 2023
Version of record online: 15 February 2024
Notes
This paper is part of a collection entitled “Climate change and the Canadian marine conservation framework”.
The article was added to the “Climate change and the Canadian marine conservation framework” collection after publication, a note has been added to indicate this.
Copyright
© 2024 Authors Bodtker, Tayler Brown, Shanatien, Sachiko, Ban, Ban, Martone, and the Crown. This work is licensed under a Creative Commons Attribution 4.0 International License (CC BY 4.0), which permits unrestricted use, distribution, and reproduction in any medium, provided the original author(s) and source are credited.
Data Availability Statement
No new data were generated for this paper, and only existing datasets from other publications were used. References for those datasets are provided within.
Key Words
Sections
Subjects
Authors
Author Contributions
Conceptualization: EMR, CKR, PLT, CM, KMB, KSPG, SB, VS, SO, SKF, NCB, KLH, RM
Data curation: CKR, PLT, KMB, KSPG, SKF, AP, AH
Formal analysis: EMR, CKR, PLT, CM, KMB, KSPG, SKF
Methodology: EMR, CKR, PLT, SKF, RM
Project administration: EMR, CM, RM
Supervision: EMR, CM, NCB, KLH, RM
Visualization: CKR, PLT
Writing – original draft: EMR, CKR, PLT, RM
Writing – review & editing: EMR, CKR, PLT, CM, KMB, KSPG, SB, KHTB, VS, SO, SKF, NCB, KLH, AP, AH, RM
Competing Interests
The authors have no competing interests to disclose.
Metrics & Citations
Metrics
Other Metrics
Citations
Cite As
Emily M. Rubidge, Carrie K. Robb, Patrick L. Thompson, Chris McDougall, Karin M. Bodtker, Katie S.P. Gale, Stephen Ban, Kil Hltaanuwaay Tayler Brown, Vicki Sahanatien, Sachiko Ouchi, Sarah K. Friesen, Natalie C. Ban, Karen L. Hunter, Angelica Pena, Amber Holdsworth, and Rebecca Martone. 2024. Evaluating the design of the first marine protected area network in Pacific Canada under a changing climate. FACETS.
9(): 1-18. https://doi.org/10.1139/facets-2023-0126
Export Citations
If you have the appropriate software installed, you can download article citation data to the citation manager of your choice. Simply select your manager software from the list below and click Download.
There are no citations for this item