Abstract

The parallel evolution of lateral plates and body shape in the threespine stickleback (Gasterosteus aculeatus) is an iconic example of adaptation. We test a case of contemporary evolutionary transition in a recently isolated population of marine G. aculeatus in British Columbia, Canada. We investigate Ectodysplasin (Eda) genotypes, plate counts, neutral genetic divergence, and whole-body phenotypes to determine the genetic and phenotypic distance between this population and nearby comparative populations. Our focal population is in the process of adapting both genetically and phenotypically to a freshwater environment, and we provide an example of the genetic basis for parallel evolution on a contemporary timescale. The frequency of Eda genotypes and lateral plate phenotypes in our focal population is not consistent with those of marine or fully freshwater populations. Although our focal population is genetically distinct from nearby marine populations, these fish still more closely resemble marine populations in overall body shape while demonstrating an intriguing intermediate phenotype. Eda frequency and lateral plate phenotype change faster than body shape in response to freshwater conditions, suggesting that the pace of adaptation differs across traits in response to the same environmental conditions. Our results further bolster the case for G. aculeatus as a key model of contemporary evolution.

Introduction

Evolution can occur on different time scales. Frequently, however, we aim to infer evolutionary processes by looking back thousands of years rather than looking at the first steps of evolution. Integrating genotype-phenotype information across timescales can help us elucidate how evolution works (Linnen and Hoekstra 2009). Contemporary evolution is defined as recent and ongoing evolutionary change occurring on an ecological timescale in wild populations (Hendry and Kinnison 1999; Hairston Jr. et al. 2005), ranging from a few generations to a few centuries. Characterizing contemporary evolution is relevant for conservation biology, and it is becoming increasingly important to understand as climate change accelerates rapid environmental change (Stockwell et al. 2003). Several examples of contemporary evolution have been identified in nature (e.g., Lake Malawi cichlids, Streelman et al. 2004; saltmarsh beetles, Van Belleghem et al. 2018; Heliconius butterflies, Reed et al. 2011). These exemplars provide key information on the mode and pace of adaptation as we seek to understand how rapid evolution occurs. However, evolutionary processes, including the strength of selection and the pace and probability of evolution, vary greatly within and among taxa (Kingsolver et al. 2001; Siepielski et al. 2009; Sanderson et al. 2022), illustrating the need for studies in well-established systems to better test hypotheses regarding evolutionary patterns.
Disentangling the effects of natural selection from other evolutionary mechanisms, such as genetic drift, is an important first step as we seek to determine what selective pressures organisms face. This clarification is critical in predicting how organisms will respond to environmental change. Parallel evolution, the repeated evolution of traits in related lineages in response to similar environmental conditions (Simpson 1953), has historically been used as strong supporting evidence for natural selection (Endler 1986; Schluter and Nagel 1995; Schluter et al. 2004; Wake et al. 2011; Bolnick et al. 2018). Consistent and directional changes in traits described as parallel evolution are indicative of natural selection because it is highly unlikely that these repeated patterns would emerge based on chance alone (Endler 1986; Schluter and Nagel 1995; Schluter et al. 2004; Wake et al. 2011). Identifying cases of parallel evolution occurring in contemporary time frames may thus provide insight into processes that allow organisms to adapt to rapidly changing selective regimes.
Parallel evolution across populations of threespine stickleback (Gasterosteus aculeatus) that move into freshwater habitats is an iconic example of adaptation (e.g., Bell and Foster 1994; Schluter et al. 2004; Colosimo et al. 2005). The threespine stickleback is a small ancestrally marine fish with a Holarctic distribution that is characterized by bony armour consisting of lateral plates, dorsal plates, three dorsal spines, and two pelvic spines (Hagen and Gilbertson 1973; Reimchen 1983; Bell and Foster 1994; Barrett et al. 2010; Bjærke et al. 2010). Populations that colonized freshwater environments have consistently diverged in a variety of traits related to morphology, physiology, behaviour, genetics, and life history when compared to their contemporary marine ancestors (Bell and Foster 1994; McKinnon 2002; Barrett et al. 2010; Jones et al. 2012). Freshwater threespine stickleback typically have a more streamlined body shape, reduced body armour (bony plates, spines, and pelvic girdle), decreased salt tolerance, differences in mate preference, dietary changes, and reduced fecundity (Bell and Foster 1994; McKinnon 2002). The reduction in the number of lateral plates and the role of selection in freshwater populations have been particularly well studied (e.g., Klepaker 1993; Reimchen 2000; Bell 2001; Schluter et al. 2004; Colosimo et al. 2005; Barrett et al. 2008; Leinonen et al. 2011b; Marchinko et al. 2014). Parallel evolution favoring a reduction in the number of lateral plates in freshwater colonizing threespine stickleback populations is so widespread that it is almost certainly an adaptive response to selection and highly unlikely to be the sole result of other mechanisms such as genetic drift or ecological vicariance (Schluter et al. 2004; Roesti et al. 2015). Threespine stickleback thus provide a powerful model for investigating questions pertaining to contemporary evolution because they have a well-characterized ecology (Hagen and Gilbertson 1973; Bell and Foster 1994; McKinnon 2002), exhibit variation linked to environmental conditions (Colosimo et al. 2005; Barrett et al. 2010), and a large number of genomic resources are available for the species (e.g., Colosimo et al. 2004; Jones et al. 2012; Rogers et al. 2012; Glazer et al. 2015; Peichel and Marques 2017; Peichel et al. 2017).
Lateral plate phenotype in threespine stickleback is under the genetic control of a large-effect gene, Ectodysplasin (Eda), that singlehandedly explains over 75% of the variation in lateral plate phenotype (Colosimo et al. 2004, 2005; Cresko et al. 2004; Peichel and Marques 2017). Recent work has also shown a key role for this gene's receptor (Edar; Laurentino et al. 2022). The completely-plated morphs (>30 plates, Hagen and Gilbertson 1972) that dominate in Eastern Pacific marine populations are usually homozygous for the complete-plated Eda allele (Colosimo et al. 2005; Barrett et al. 2008; although we note this is not necessarily the case elsewhere; see, for example, DeFaveri and Merilä 2013). Likewise, the low-plated morphs (<10 plates; Hagen and Gilbertson 1972) that often dominate in freshwater populations are homozygous for the low-plated Eda allele, resulting in many freshwater populations at or near fixation for the low-plated Eda allele (Colosimo et al. 2005). Heterozygotes for Eda display either complete or partial morphs (10–30 plates; Hagen and Gilbertson 1972) and are rare in both marine and freshwater environments (Colosimo et al. 2004; Cresko et al. 2004). Eda is also known to have pleiotropic effects and has been previously linked to differences in shape, which could help explain why lateral plate phenotype and shape vary together in freshwater adaptation (Albert et al. 2008; Barrett et al. 2009; Aguirre and Bell 2012; Rogers et al. 2012). Multiple studies have found the low-plated allele is present as standing genetic variation at a frequency of ∼1% in marine populations off the coast of British Columbia, Canada (Colosimo et al. 2005; Barrett et al. 2008; Morris et al. 2018). This standing genetic variation gives populations the potential to rapidly adapt to new freshwater environments (Colosimo et al. 2005; Mäkinen et al. 2006) and provides a clear link between genotype and phenotype (Colosimo et al. 2004; Peichel and Marques 2017).
There exist, to our knowledge, only three described cases of contemporary evolution in threespine stickleback, and both the mechanisms responsible and the pace of evolution remain relatively poorly understood. In the first well-documented case, a pond in Bergen, Norway, was disconnected from the ocean in 1960, resulting in the rapid isolation of a population of marine stickleback from their previous marine habitat (Klepaker 1993). This population was sampled for nine years and showed a progressive decrease in complete morphs, reduction in spine length, change in body form, and enlargement of the eyes over this time period. Similarly, threespine stickleback in an Icelandic fjord that was isolated from the ocean for a period of 12 years exhibited a reduced number of lateral plates, shorter pelvic spines, and variation in overall shape morphology compared to nearby marine populations (Kristjánsson et al. 2002). In Loberg Lake, Alaska, the stickleback population was wiped out by rotenone poisoning in 1983 (Bell et al. 2004). The lake was later recolonized by marine stickleback and annual sampling from 1990 to 2001 revealed a shift in the population from 96% complete morphs to 11% complete morphs (Bell et al. 2004). Although these studies suggest that threespine stickleback rapidly respond to environmental changes related to isolation in freshwater, more replicates, as well as more comprehensive experiments and analyses, are needed to support initial findings on the pace and progression of adaptation observed early in the adaptive process. Hypotheses around factors driving freshwater adaptation include selection on osmoregulatory genes linked to Eda (Heuts 1947), increased cost of plate production due to calcium limitation in freshwater (Giles 1983), a juvenile growth advantage for low morphs in freshwater leading to higher overwinter survival (Marchinko and Schluter 2007; Barrett et al. 2009), differences in predation regimes (Reimchen 1992; Reimchen 2000; Leinonen et al. 2011b), and differences in swimming ability (Reimchen 1992; Reimchen 1994; Bergstrom 2002).
Here we test a case of contemporary evolution in a recently identified population of marine threespine stickleback that has been isolated to Lost Lagoon, British Columbia, Canada, for nearly 100 years. The population was isolated from the surrounding ocean waters of Coal Harbour in 1916, and marine water input via pumps ceased in 1929 (Carl 1932). Since this time, Lost Lagoon has become a freshwater environment. We created genetic and phenotypic profiles of Lost Lagoon fish and compared these to genetic and phenotypic profiles of nearby marine and freshwater populations to test the hypothesis that this system represents an example of contemporary evolution. We predicted that Lost Lagoon fish would be intermediate in both genetic and phenotypic terms when compared to nearby marine and freshwater populations, indicating short-term effects of adaptive change in response to freshwater.

Methods

Study site

Lost Lagoon is located at the south entrance of Stanley Park in Vancouver, British Columbia, Canada (49°17′44.5″N, 123°8′25.3″W). Originally, Lost Lagoon was a saltwater marsh providing habitat for many marine organisms and was disconnected from the ocean when the causeway linking downtown Vancouver and Stanley Park was built in 1916 (Carl 1932). The water in the lagoon became stagnant and initially experienced large fluctuations in salinity. The combined actions of permanently shutting off pumps bringing saltwater into Lost Lagoon in 1929 and the introduction of municipal wastewater inflow in 1930 turned Lost Lagoon into a freshwater lake (Carl 1932). Freshwater is currently maintained through a flap gate that allows outflow from Lost Lagoon while preventing saltwater from entering the lagoon, as well as input from groundwater, runoff from surrounding roads and trails, and Ceperley Creek, which brings municipal water supply into the lagoon. At the time of specimen collection for this study (November 2017), the average salinity in Lost Lagoon was 0.08 parts per trillion.

Specimen collection

Threespine stickleback (n = 64) were collected from Lost Lagoon in November 2017 using minnow traps. The sample from Lost Lagoon was compared genetically and morphometrically to samples from nearby populations located in Madeira Park, on the Sunshine Coast of British Columbia, collected in 2015 (Barry 2019). Comparative populations include two marine populations, Bargain Bay Lagoon (49°36′48.6″N, 124°1′46.9″W; n = 50) and Bargain Bay Narrows (49°36′59.9″N, 124°1′50.3″W; n = 50), and two freshwater populations, Klein Lake (49°43′45.1″N, 123°58′7.1″W; n = 50) and Hotel Lake (49°38′24.3″N, 124°2′42.3″W; n = 50; Supplementary Fig. 1). The collection and euthanasia of all specimens were carried out in accordance with the Canadian Council for Animal Care and the University of Calgary Animal Care Committee (AC13-0040, AC16-0059, and AC17-0050).

Sex and Eda genotyping

DNA was extracted from fin clips using a Qiagen DNeasy Blood and Tissue kit, following the standard protocol. The allozyme isocitrate dehydrogenase (Idh), linked to sex determination in threespine stickleback (Peichel et al. 2004), was amplified using a polymerase chain reaction (PCR) and resolved on a 2% agarose gel run at 110 V for 30 min following reaction conditions described elsewhere (Morris et al. 2018; Kozak 2021).
Extracted DNA was similarly used to genotype individuals at the Eda locus. PCR was used to amplify stn382, a diagnostic intel marker within intron one of Eda (Colosimo et al. 2005; Lucek et al. 2010; Le Rouzic et al. 2011), following reaction conditions described elsewhere (Morris et al. 2018; Kozak 2021). PCR products were resolved on a 2% agarose gel run at 110 V for 30 min. The complete-plated Eda allele has 218 base pairs at stn382, and the low-plated Eda allele has 158 base pairs at stn382 (Lucek et al. 2010; Le Rouzic et al. 2011).

Morphometrics

The threespine stickleback underwent microcomputed tomography (μCT) scanning using a Scanco μCT35 instrument (μCT35; Scanco Medical AG, Brütisellen, Switzerland) at a resolution of 20.00 µm (70 kVp, 114 µA, 20.5 mm field of view, and 200 ms integration time). Raw images were imported into the Amira 5.4 software package (FEI Visualization Sciences Group, Burlington, Massachusetts, USA), where they were reconstructed into meshes using the Isosurface tool (Hotel and Klein Lakes: threshold 2800; Bargain Bay Lagoon, Bargain Bay Narrows, and Lost Lagoon: threshold 3300).
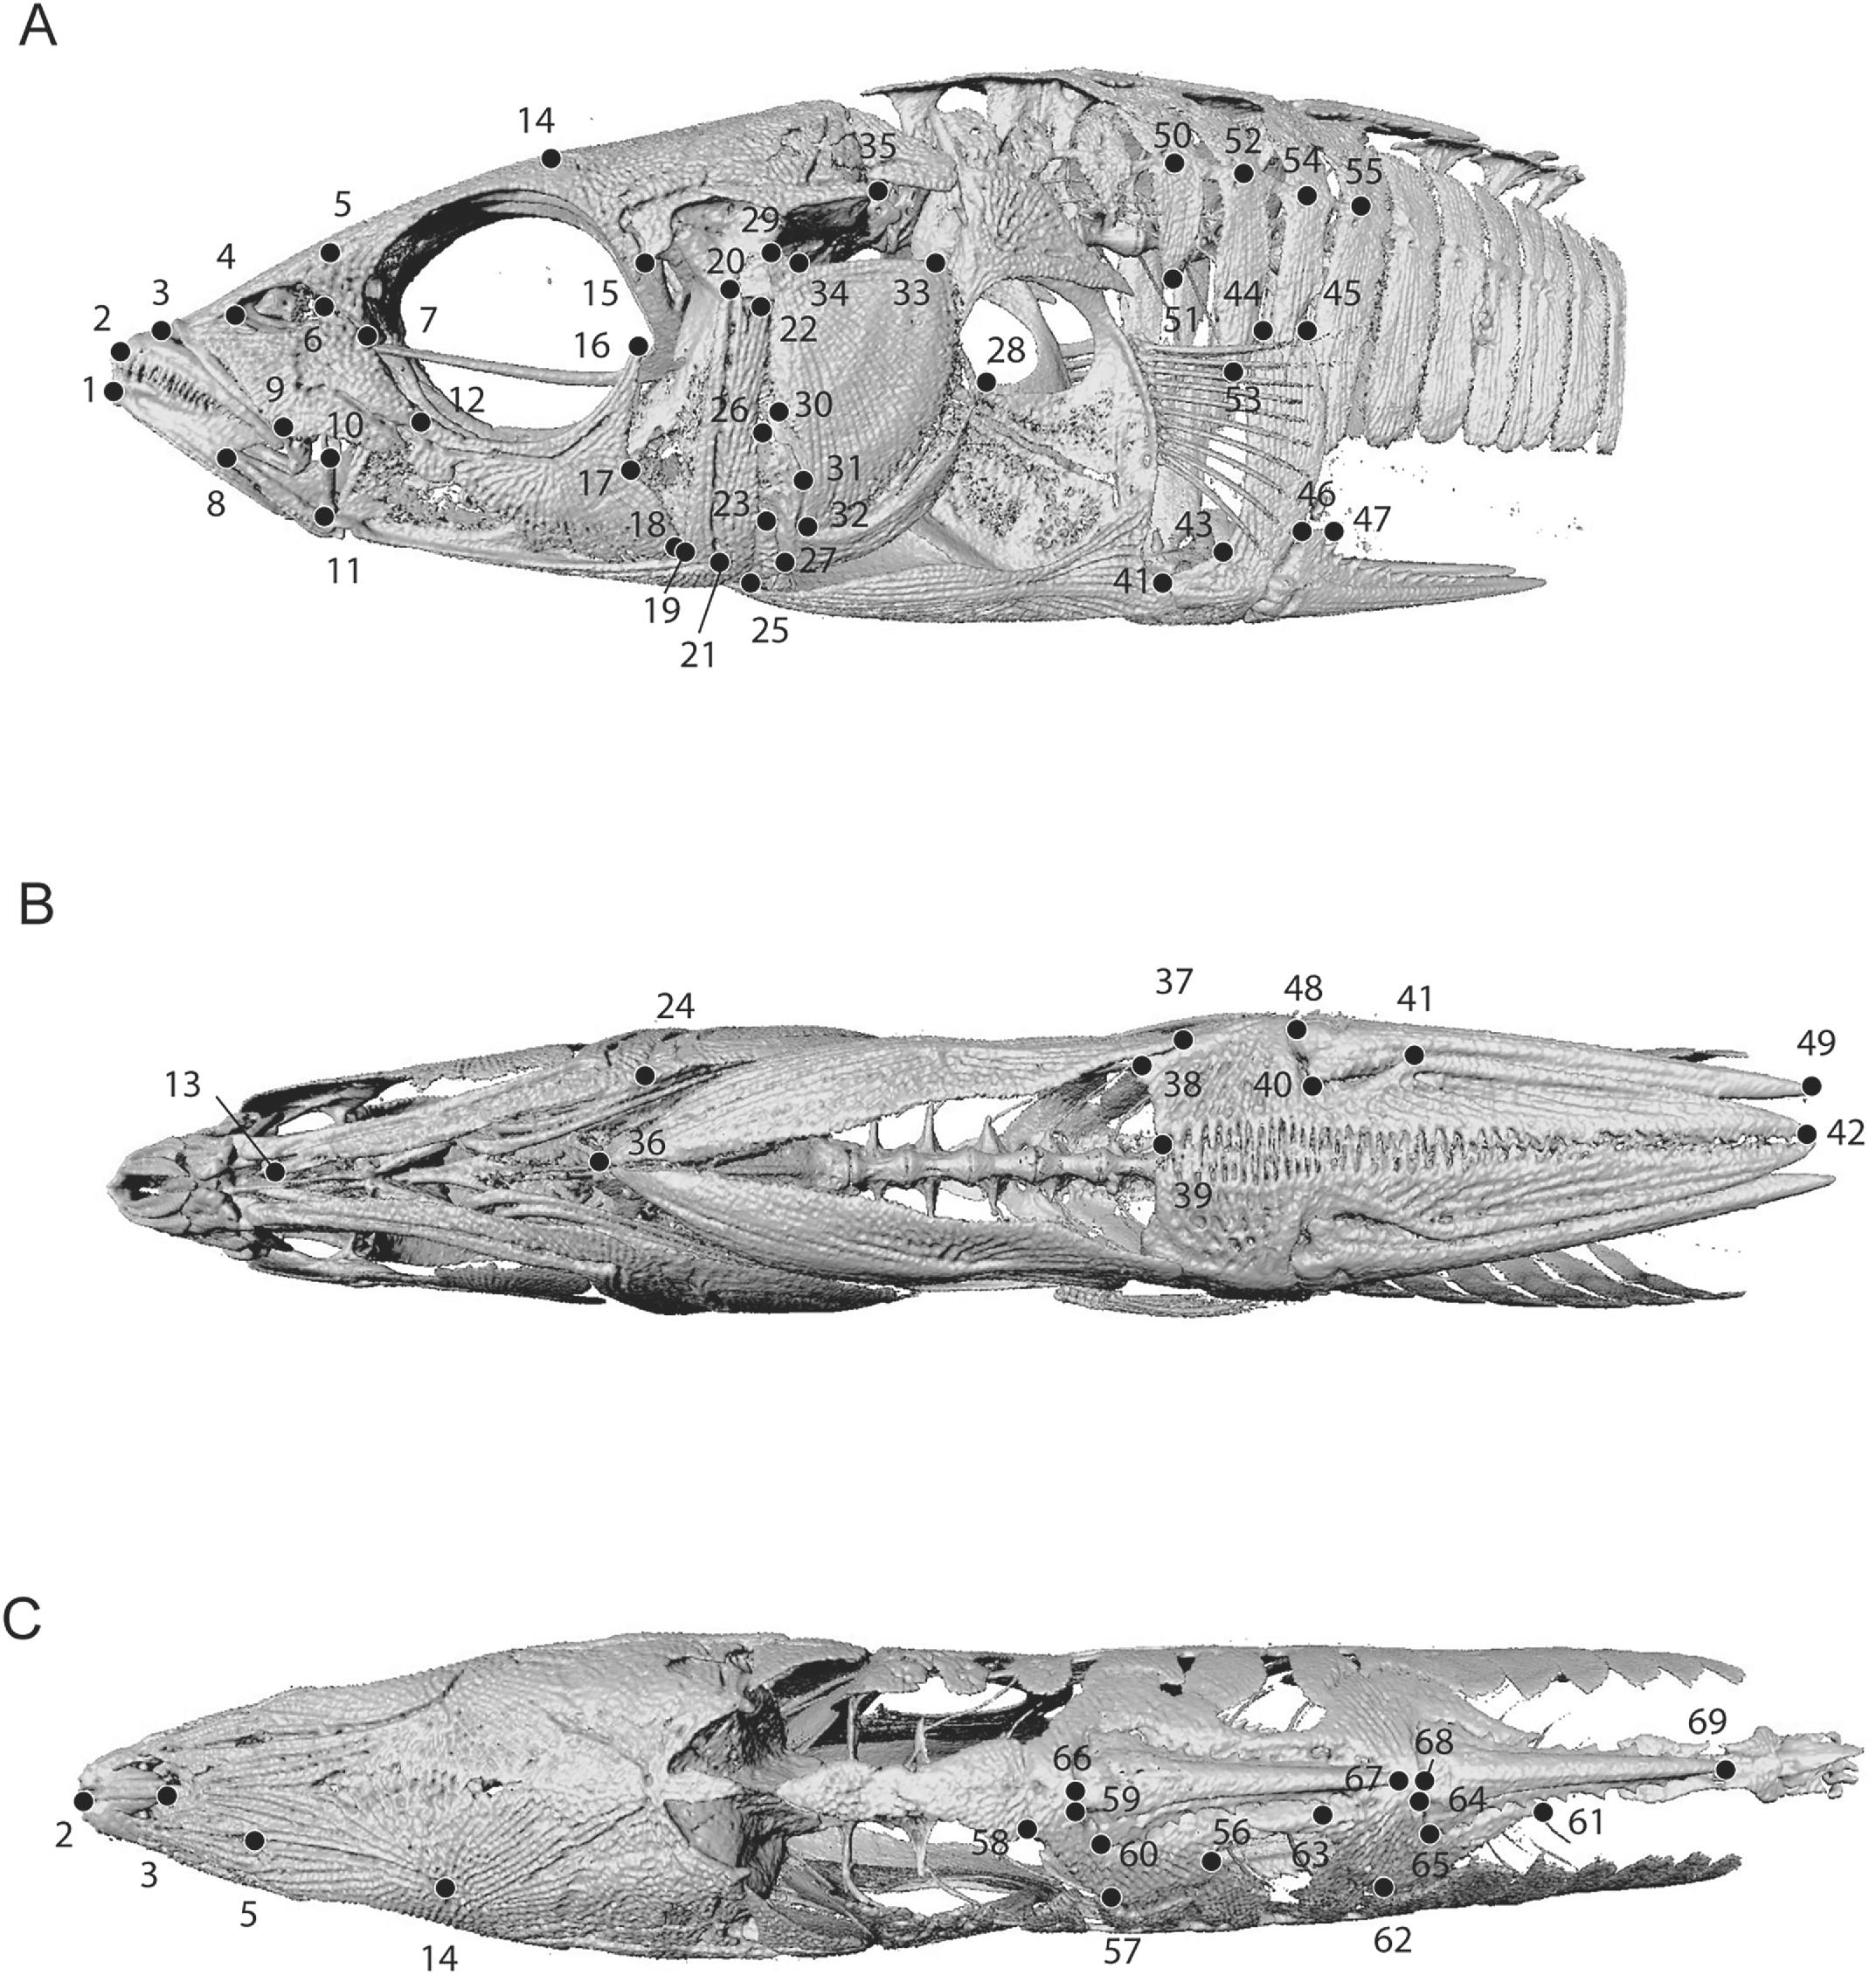
For Lost Lagoon (n = 64, F = 24/M = 40), the plate morph of each fish was scored as complete, partial, or low according to Hagen and Gilbertson's (1972) definition of lateral plate morphs, and the number of plates on each side of the fish was counted and averaged between both sides of the body. All fish from Lost Lagoon, as well as a randomly selected subset of the fish from all comparative populations (Barry 2019; Bargain Bay Lagoon: n = 25, F = 9/M = 16, Bargain Bay Narrows: n = 19, F = 1/M = 18, Hotel Lake: n = 25, F = 2/M = 23, Klein Lake: n = 25, F = 19/M = 6), were then three-dimensionally landmarked in Amira using a set of 134 landmarks placed in the cranial and postcranial regions of each fish (Fig. 1).
Fig. 1.
Fig. 1. Landmarks used to capture three-dimensional shape variation in threespine stickleback in (A) lateral, (B) ventral, and (C) dorsal views. Landmarks 1–65 were collected bilaterally but are indicated on the left side here for clarity. Landmarks 66–69 are single midline landmarks. 1, Anterior-most tip of the dentary; 2, anterior-most tip of premaxilla; 3, dorsal-most tip of maxilla; 4, anterior corner of the ventrolateral process of the nasal; 5, dorsal corner of nasal-lateral ethmoid suture; 6, dorsal maximum of lachrymal; 7, lachrymal-prefrontal suture on orbital margin; 8, anterior-most tip of articular; 9, ventral maximum of lachrymal; 10, dorsal-most tip of articular; 11, ventral-most tip of articular; 12, lachrymal-second suborbital suture; 13, anterior-most tip of preoperculum; 14, dorsal-most tip of supraorbital; 15, ventral-most tip of sphenotic; 16, dorsal-most tip of third suborbital; 17, posterior minimum of third suborbital; 18, ventral-most tip of third suborbital; 19, anterior minimum of preoperculum; 20, anterior dorsal-most tip of preoperculum; 21, posterior maximum of preoperculum along first ridge; 22, posterior dorsal-most tip of preoperculum; 23, dorsal-most tip of interoperculum; 24, ventral maximum of peroperculum along second ridge; 25, ventral-most tip of interoperculum; 26, dorsal-most tip of suboperculum; 27, ventral maximum of suboperculum; 28, posterior tip of suboperculum; 29, dorsal-most tip of the operculum; 30, anterior maximum of the operculum; 31, anterior minimum of the operculum; 32, ventral-most tip of the operculum; 33, posterodorsal tip of the operculum; 34, opercular hinge angle; 35, posterior tip of pterotic; 36, anterior tip of ectocoracoid; 37, posterior tip of ectocoracoid; 38, lateral anterior tip of pelvic plate; 39, medial anterior extent of pelvic plate at suture; 40, minimum of pelvic plate at trochlear joint; 41, maximum of pelvic process; 42, posterior tip of the pelvic process; 43, anterior minimum of the ascending process of the pelvic plate; 44, anterodorsal maximum of the ascending process of the pelvic plate; 45, posterodorsal maximum of the ascending process of the pelvic plate; 46, posteroventral maximum of the ascending process of pelvic plate at trochlear joint; 47, dorsal-most tip of pelvic spine; 48, ventral-most tip of pelvic spine; 49, posterior tip of pelvic spine; 50, midline of plate 4 at lateral pores; 51, ventral tip of plate 4; 52, midline of plate 5 at lateral pores; 53, ventral tip of plate 5; 54, midline of plate 6 at lateral pores; 55, midline of plate 7 at lateral pores; 56, posterior tip of the first basal plate; 57, ventral maximum of first basal plate; 58, anterior tip of first basal plate; 59, joint insertion of the first dorsal spine; 60, anterolateral tip of the first dorsal spine; 61, posterior tip of the second basal plate; 62, ventral maximum of the second basal plate; 63, anterior tip of the second basal plate; 64, joint insertion of the second dorsal spine; 65, anterolateral tip of the second dorsal spine; 66, midline joint insertion of the first dorsal spine; 67, posterior-most tip of the first dorsal spine; 68, midline joint insertion of the second dorsal spine; 69, posterior-most tip of the second dorsal spine.
Landmark coordinates were uploaded to RStudio, where statistical analyses were conducted and plots were produced using the packages geomorph v.4.0.3 (Baken et al. 2021; Adams et al. 2022), RRPP v.1.2.3 (Collyer and Adams 2018; Collyer and Adams 2021), and ggplot2 v. 3.3.5 (Wickham 2016). The following procedures were conducted on the Lost Lagoon sample separately and then as part of a comparative analysis including all described populations.
Landmark data were first standardized using a Procrustes transformation to translate coordinates to the origin, scale to size, and optimally rotate the landmark coordinates to control for variation arising from factors other than shape. A principal component analysis (PCA) was then conducted to visualize morphospace occupation and shapes for each population.
Procrustes-transformed coordinates were then subjected to Procrustes multivariate analysis of variance (Collyer et al. 2015). A series of linear models of increasing complexity were constructed, each including size as a covariate, represented by landmark centroid size, and assessed to determine which model best fit the data. For the Lost Lagoon sample, the best-fit model was determined to be scores ∼log centroid size + sex + eda. For the comparative analysis, the best-fit model was determined to be scores ∼log centroid size × eda + sex. We note that Eda genotype and population are co-linear, and therefore we did not include population as a factor in the comparative analysis. Further, rather than conducting a second PCA following size standardization, we elected to retain size and include it as a covariate in our linear models to better characterize its nonuniform interactions with other variables (see Results and Discussion for details).
Finally, a phenotypic trajectory analysis (Collyer and Adams 2013) was conducted using the best-fit linear model for the complete dataset to visualize the location of the Lost Lagoon sample along the evolutionary trajectory represented by the comparative groups, and p-values to determine the presence of significant differences in path length, direction, and shape were calculated using 1000 random permutations.

Pooled sequencing

The concentration of extracted DNA in each sample was quantified twice using a Qubit 2.0 Fluorometer with a Qubit dsDNA Broad Range Assay kit (Invitrogen), and the two readings were averaged. DNA pools were created, containing equal nanogram amounts of DNA from all individuals sampled in each population. Once combined, the DNA pools were quantified and subsequently diluted using extraction buffer (AE buffer) from a Qiagen DNeasy Blood and Tissue kit to 3–6 ng/µL. Pooled DNA libraries were prepared by Genome Quebec (Montreal, QC) using a TruSeq DNA LT Sample Prep kit (Illumina, San Diego, CA, USA) and sequenced on one Illumina HiSeq X Ten lane using 150 base pair paired-end reads.
Sequences were trimmed to remove Truseq adapters and low-quality reads using Trimmomatic v.036 (Bolger et al. 2014) and aligned to the unmasked 2015 threespine stickleback genome assembly (Glazer et al. 2015) using the Burrow–Wheeler Aligner v.0.7.17 bwa-mem function (Li and Durbin 2009). Samtools v1.5 (Li et al. 2009) was then used to sort the aligned reads by chromosome and remove reads where only one mate mapped, and then duplicates were identified and removed using the Picard v2.17.3 function MarkDuplicates (http://broadinstitute.github.io/picard/). Samtools v1.5 was used to filter unpaired reads and reads with low-quality mapping, and convert bam files to a mpileup where reads are organized by chromosome position. The mpileup was then rearranged into a msync file using the mpileup2sync.jar function in the Popoolation2 package (Kofler et al. 2011), as the msync file provides a summary of allele counts at each position per population that is required as input for downstream analysis.
The pairwise neutral fixation index (FST), based on nongenic single-nucleotide polymorphisms (SNPs), was calculated to provide a measure of neutral genetic divergence between each population. Although it is possible that nongenic SNPs are linked to genes under selection, they serve as a reasonable proxy of neutrality for conservative comparisons (Lind et al. 2011; Glazer et al. 2015; Morris et al. 2018; Barry 2019). Gene coding regions were identified using the gene file provided by Glazer et al. (2015) with the unmasked 2015 threespine stickleback genome assembly. These regions were subsequently removed from the msync file to generate a file including all presumed nongenic regions. The msync file containing nongenic regions was moved to RStudio v. 2022.02.01 running R 4.1. (R Team 2020; R Team 2022). The function compute.pairwiseFST in the R package Poolfstat v.2.0.0 (Hivert et al. 2018; Gautier et al. 2022) was used to call all SNPs in the non-genic regions that had at least 15 reads per pool and a minimum allele frequency of 0.05 across all pools and calculate neutral pairwise FST. Bioinformatic parameters and further details can be found in the pipeline detailed in Kozak (2021), based on that developed by Barry (2019) and Stanford (2019; https://doi.org/10.17504/protocols.io.e6nvwk372vmk/v1).

Results

Genotypes and phenotypes within Lost Lagoon

Eda genotypes, Idh genotypes, and plate phenotypes

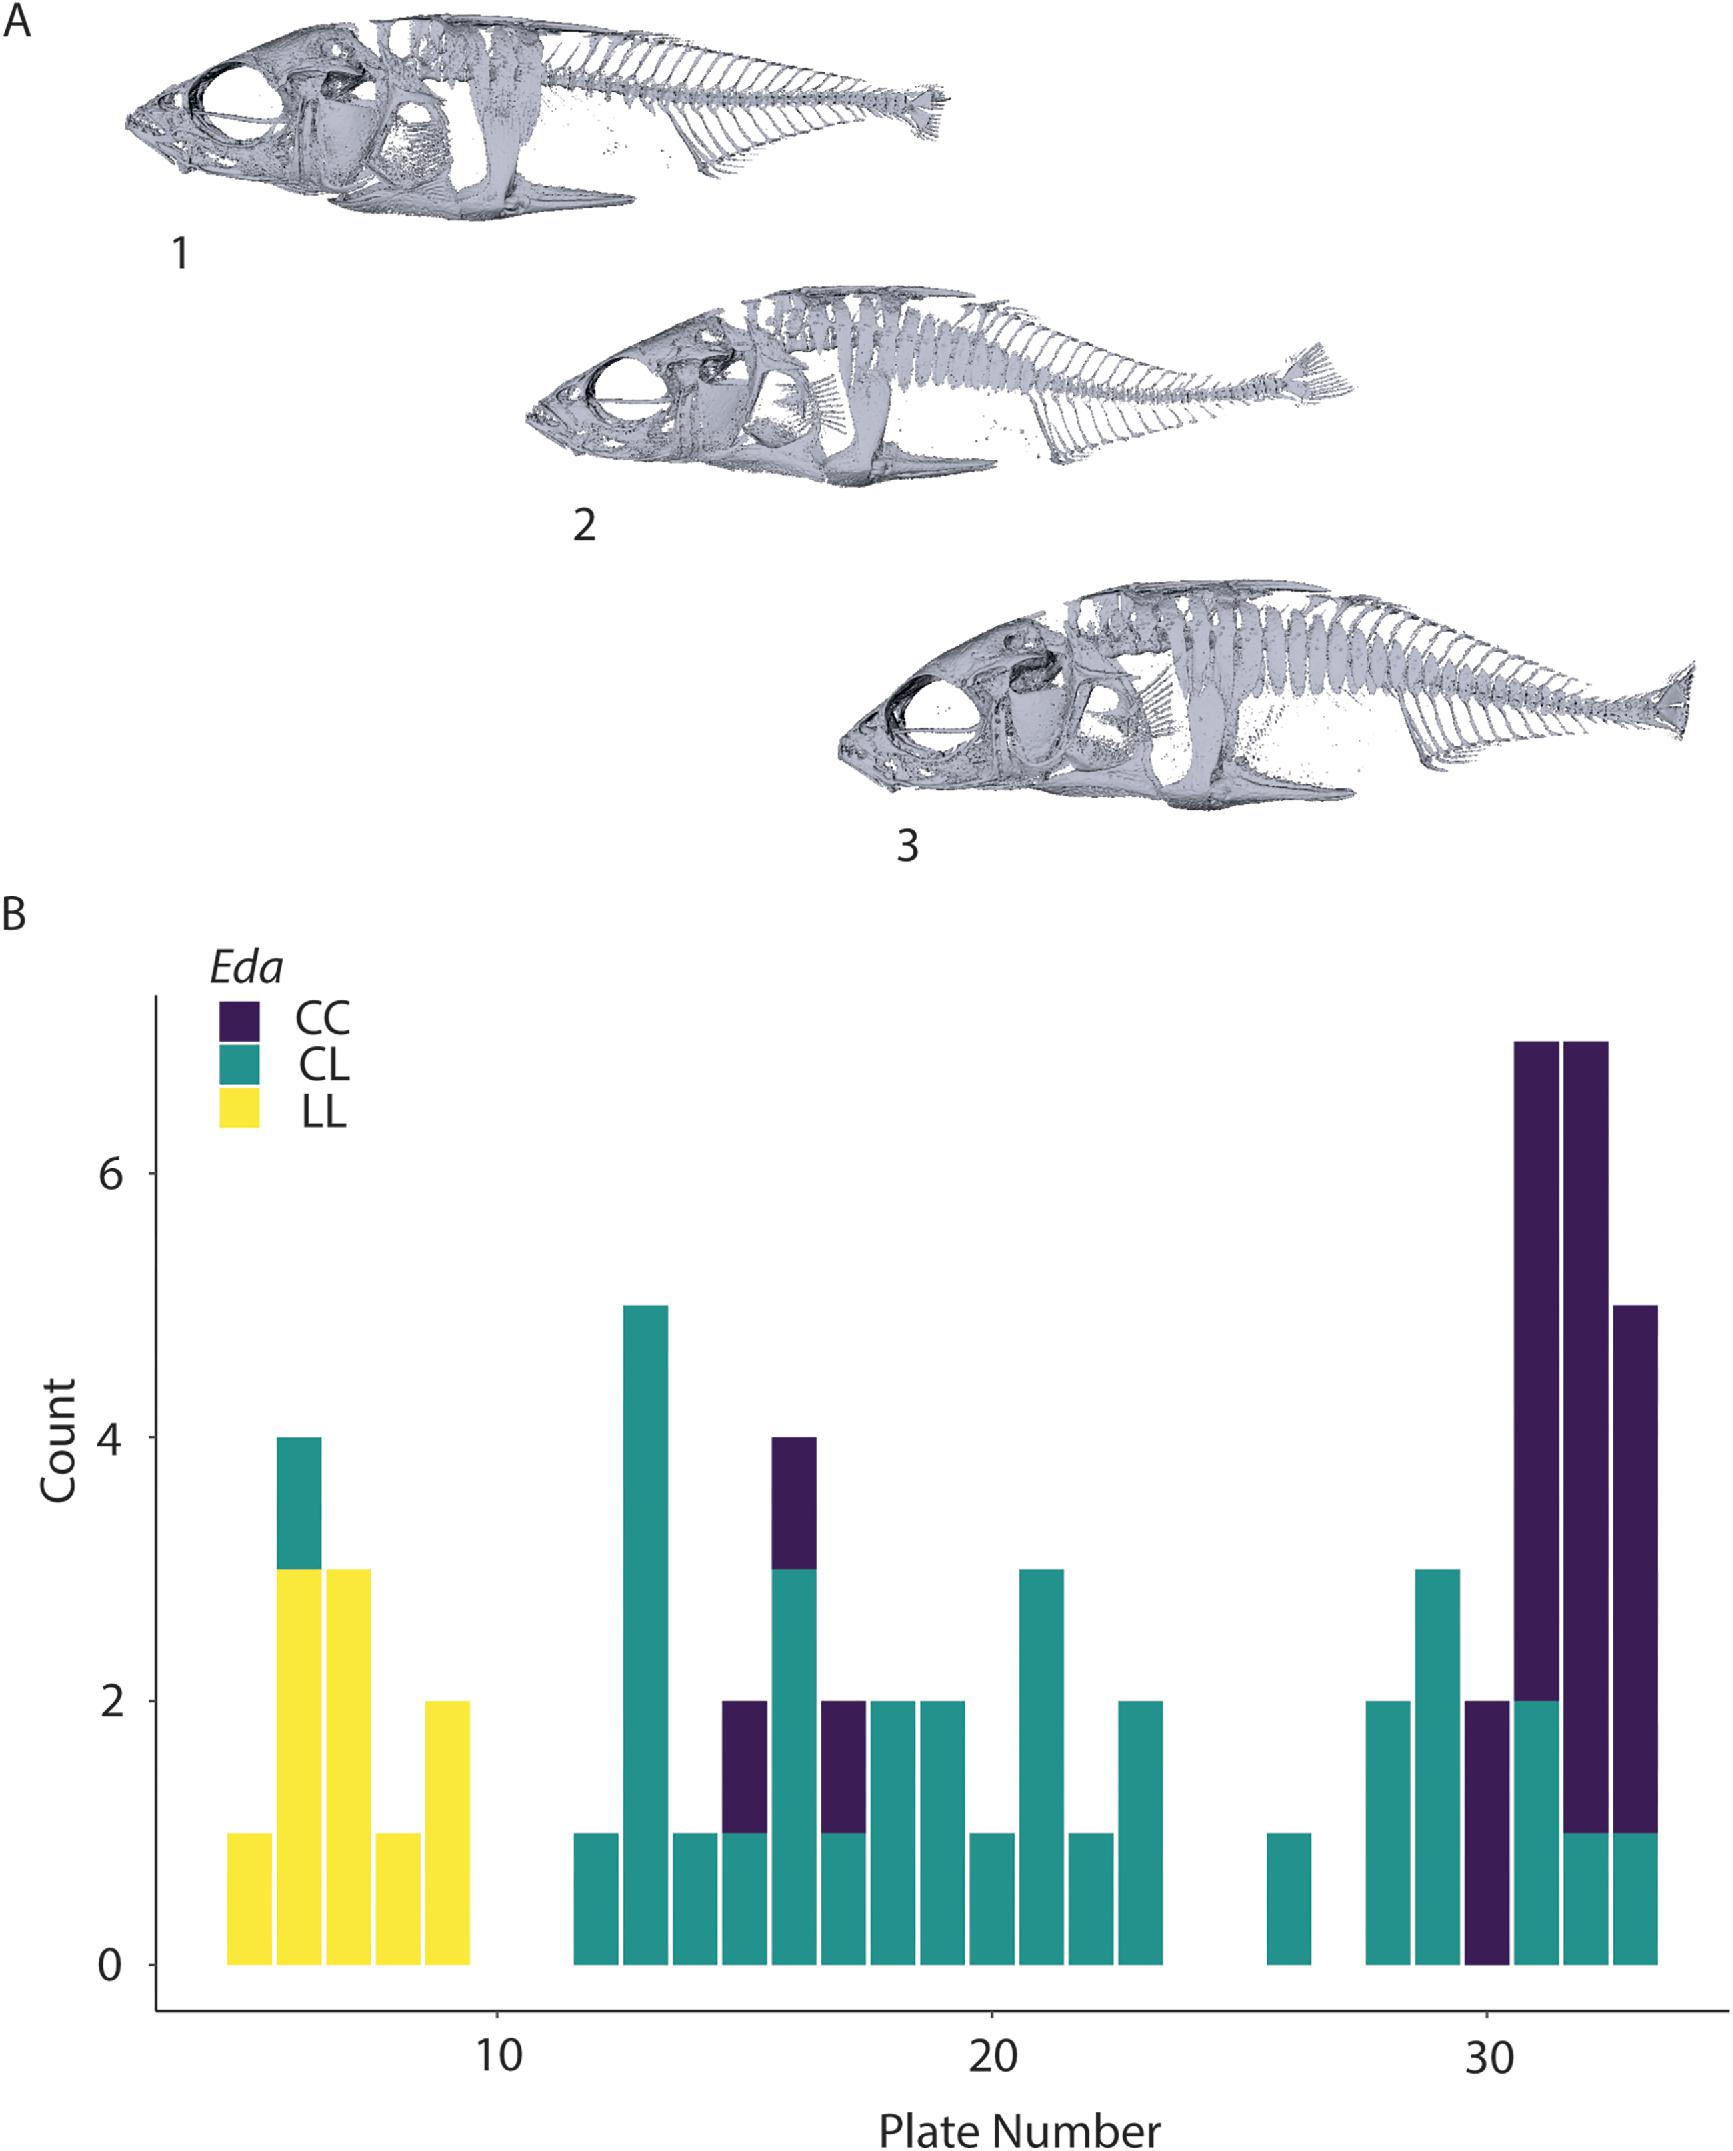
Eda genotyping indicated that of the 64 fish sampled from Lost Lagoon, 20 (31.25%) were homozygous for the complete-plated allele, 34 (53.13%) were heterozygous, and 10 (15.63%) were homozygous for the low-plated allele. The Eda genotype is typically reflected in the lateral plate morph phenotype, and all three plate morphs were present in Lost Lagoon (Fig. 2). A few exceptions to the correspondence between Eda genotype and lateral plate phenotype were found, including one individual heterozygous for Eda with a low morph phenotype and three individuals homozygous for the complete-plated allele with partial morph phenotypes. Additionally, four heterozygotes had complete morph phenotypes, which is consistent with the expectation that heterozygotes may develop into either partial morphs or complete morphs (Colosimo et al. 2004; Cresko et al. 2004).
Fig. 2.
Fig. 2. Plate counts for Lost Lagoon threespine sticklebacks. (A) Computed tomographic scans of (1) low-, (2) partial-, and (3) completely-plated individuals from Lost Lagoon, in lateral view. (B) Summary of plate count in Lost Lagoon. Plate number = average number of plates per side for each individual. Count = number of individuals exhibiting the specified number of plates. CC = homozygous for the complete-plated Eda allele; CL = heterozygous for Eda alleles; LL = homozygous for the low-plated Eda allele.
All homozygotes for the low-plated allele at Eda had 5–9 lateral plates per side with a mean of 6.80 ± 1.27 (Fig. 2). Likewise, homozygotes for the complete-plated allele showed limited variation from 30 to 33 plates per side, with the exception of three individuals. These three individuals had 15, 16, and 17 lateral plates per side and were characterized as partial morphs rather than complete morphs. The mean number of lateral plates per side in homozygotes for the complete-plated allele was 31.44 ± 1.08 when the three partial morphs were excluded and decreased to 29.07 ± 5.87 when included. Heterozygotes displayed a wider range, varying from 6 to 33 lateral plates per side, with an intermediate mean of 20.19 ± 7.01. Idh genotyping indicated that of the 64 fish sampled from Lost Lagoon, 40 (62.5%) were male and 24 (38.5%) were female. The full range of variation in plate morphs was seen in both males and females, ranging from 5 to 33 plates and 6 to 33 plates, respectively. The mean number of lateral plates per side was 21.26 ± 9.05 in males and 20.23 ± 10.26 in females.

Morphometric analysis

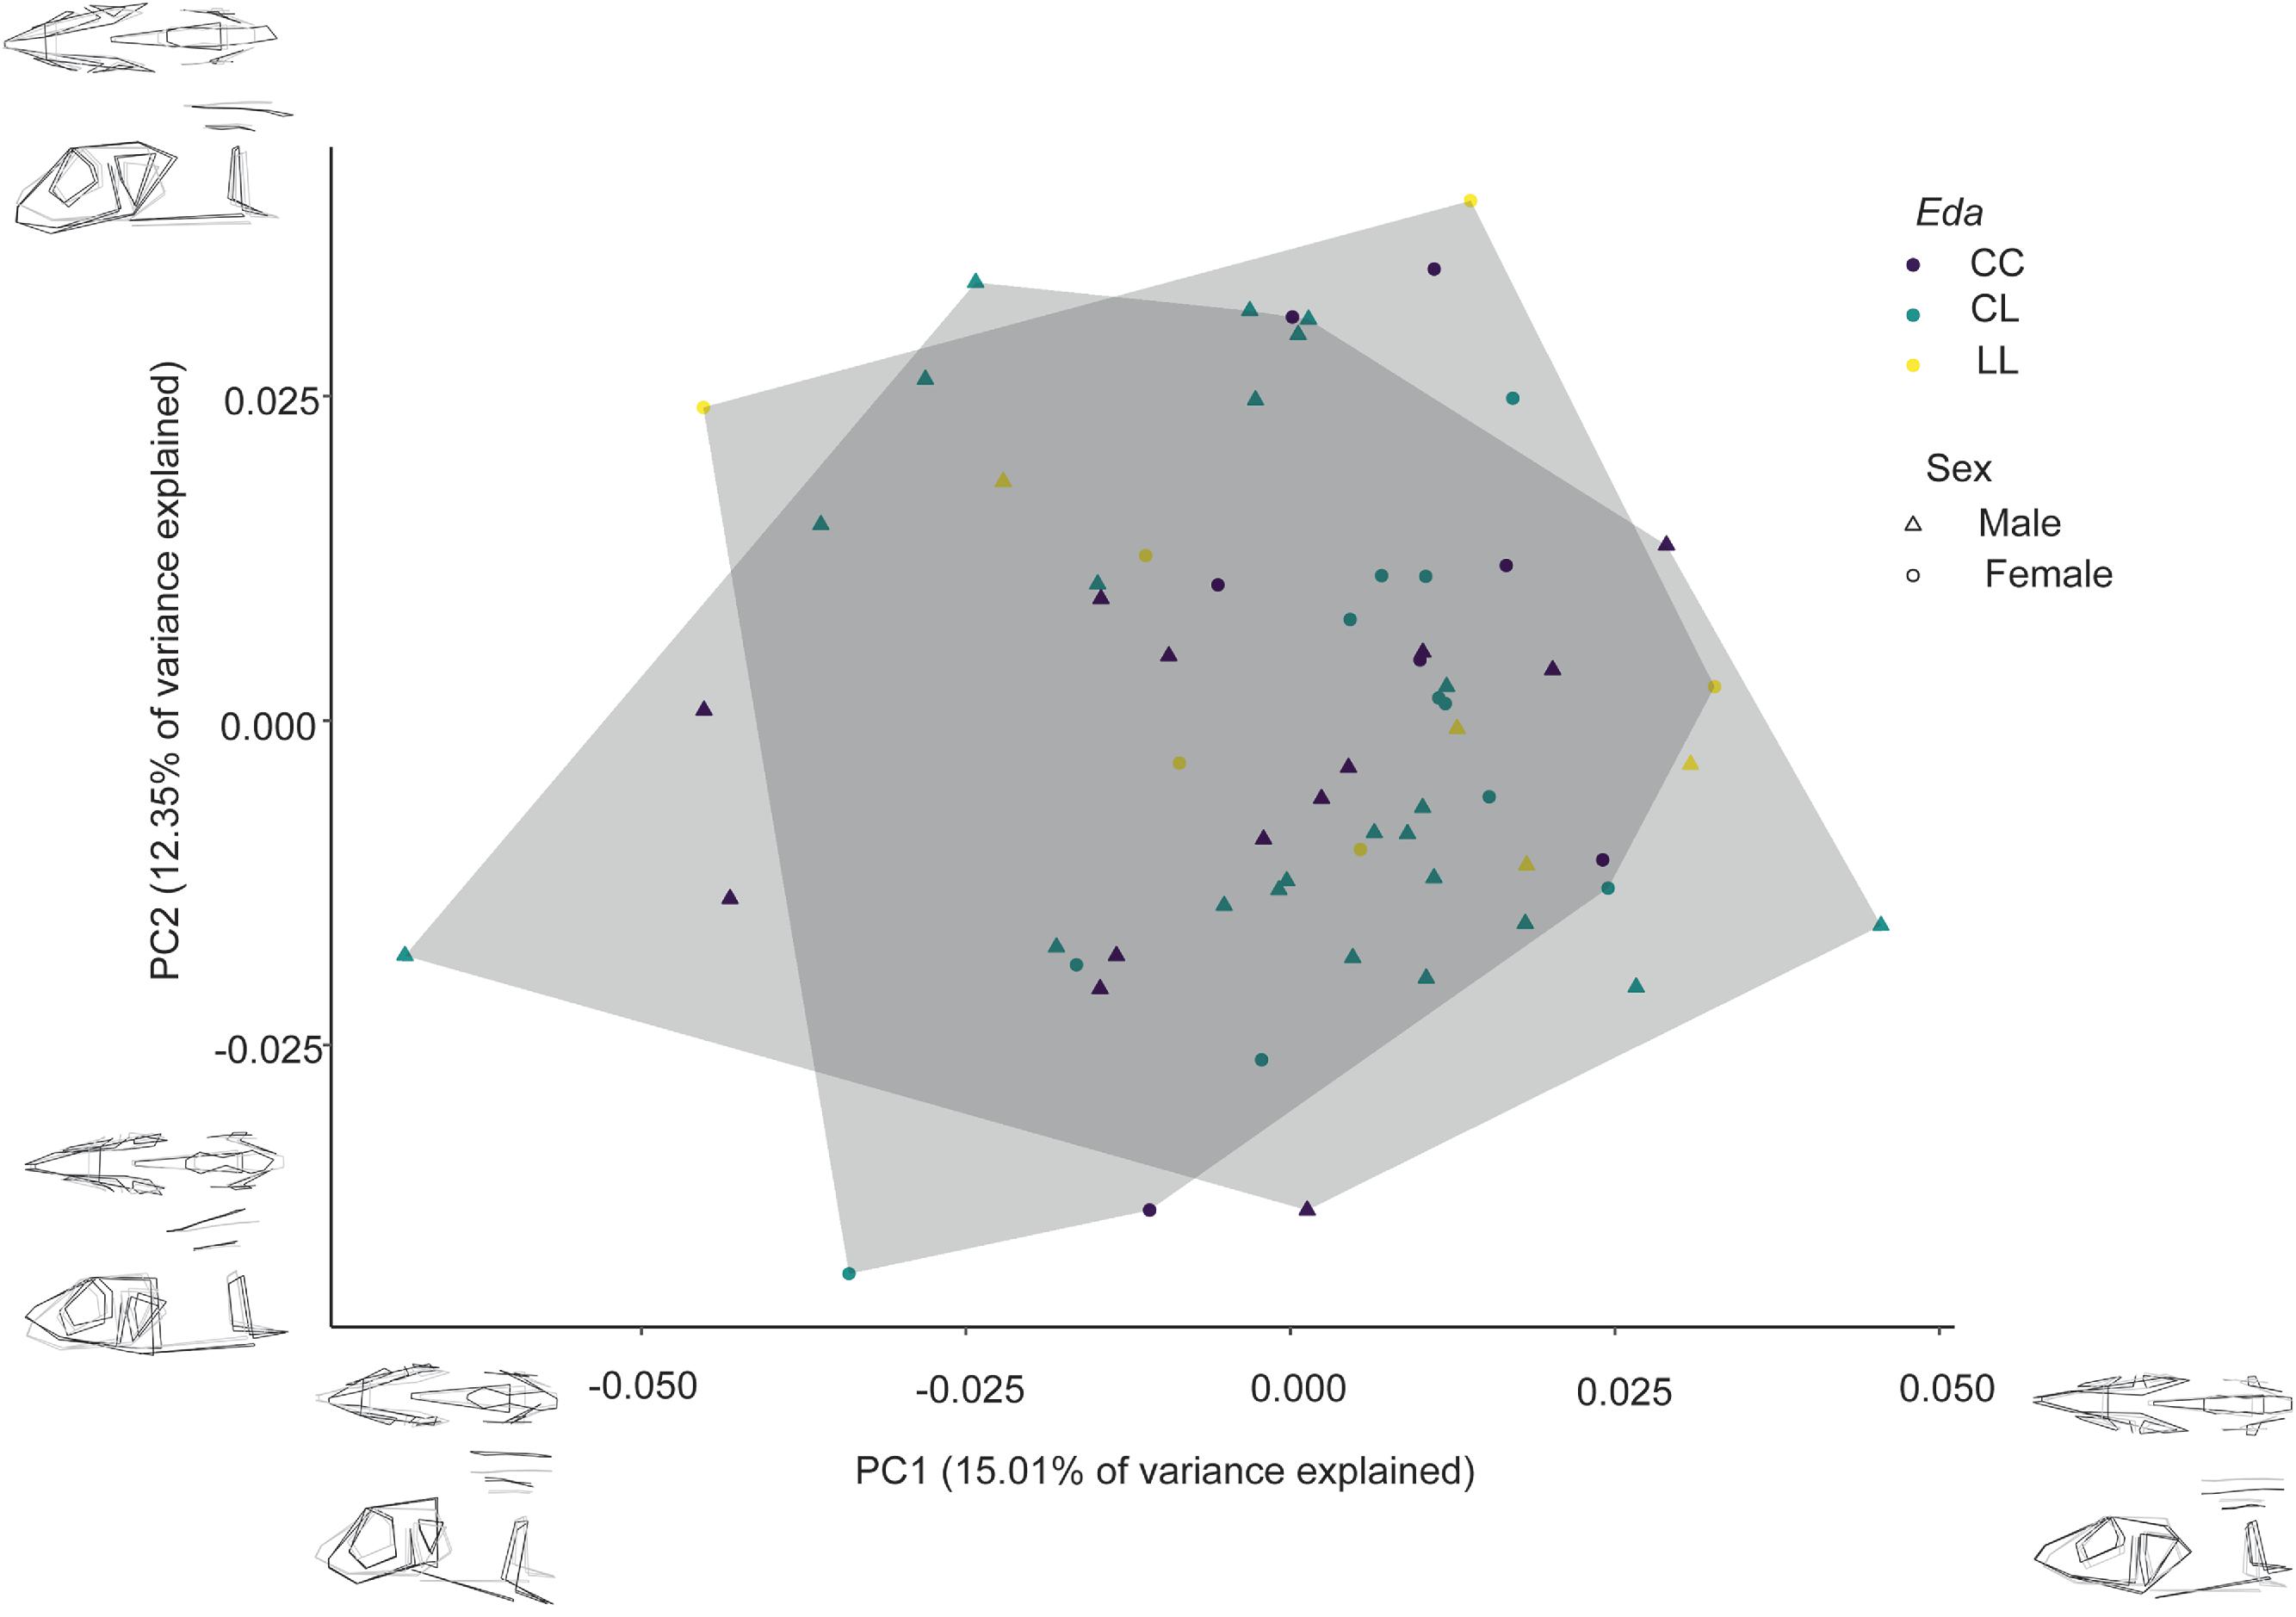
Centroid size, sex, and Eda contributed significantly to the variation in shape within Lost Lagoon (Table 1). The first principal component (PC1) explained 15.01% of the variance in shape, while the second principal component (PC2) explained 12.35% of the variance in shape observed in threespine stickleback from Lost Lagoon (Fig. 3). No clustering patterns were evident along either of these axes. Heterozygous individuals occupied the greatest area of morphospace, with the majority of homozygous individuals plotting inside the heterozygous morphospace.
Fig. 3.
Fig. 3. Principal component analysis of the Lost Lagoon threespine stickleback. Convex hulls indicate the morphospace occupied by each sex. CC = homozygous for the complete-plated Eda allele; CL = heterozygous for Eda alleles; LL = homozygous for the low-plated Eda allele; PC = principal component. Wireframe thumbnails illustrate shape deformation in superior (top) and lateral (bottom) views at the extreme ends of each axis. Black lines indicate mean shape; grey lines indicate deformation. Deformations are magnified 3× for clarity.
Table 1.
Table 1. Analysis of variance in shape for Lost Lagoon stickleback.
 DfSSMSFp
logSize10.01840.01847.19510.0001
sex10.00580.00582.26980.0030
eda20.00720.00361.40980.0493
Residuals590.15060.0026  
Total630.1822   

Note: Df, degrees of freedom; eda, Eda genotype; FF-statistic; logSize, natural log of centroid size; MS, mean square; SS, sum of squares.

Shape variation along PC1 reflected minor differences in body depth, head shape, eye size, subopercle size and shape, position of the mouth, and the shape and size of the pelvic girdle. The negative end of PC1 was associated with a deeper body and blunter snout, whereas the positive end of PC1 was associated with a shallower body and a more elongated head. Subtle variation found along PC2 included head angle, subopercle size and shape, distance between the most ventral point of the articular bone and the maxilla, and distance from the opercular region to lateral plate 4 (Fig. 3).

Genotypes and phenotypes of Lost Lagoon and comparative populations

Frequency of Eda

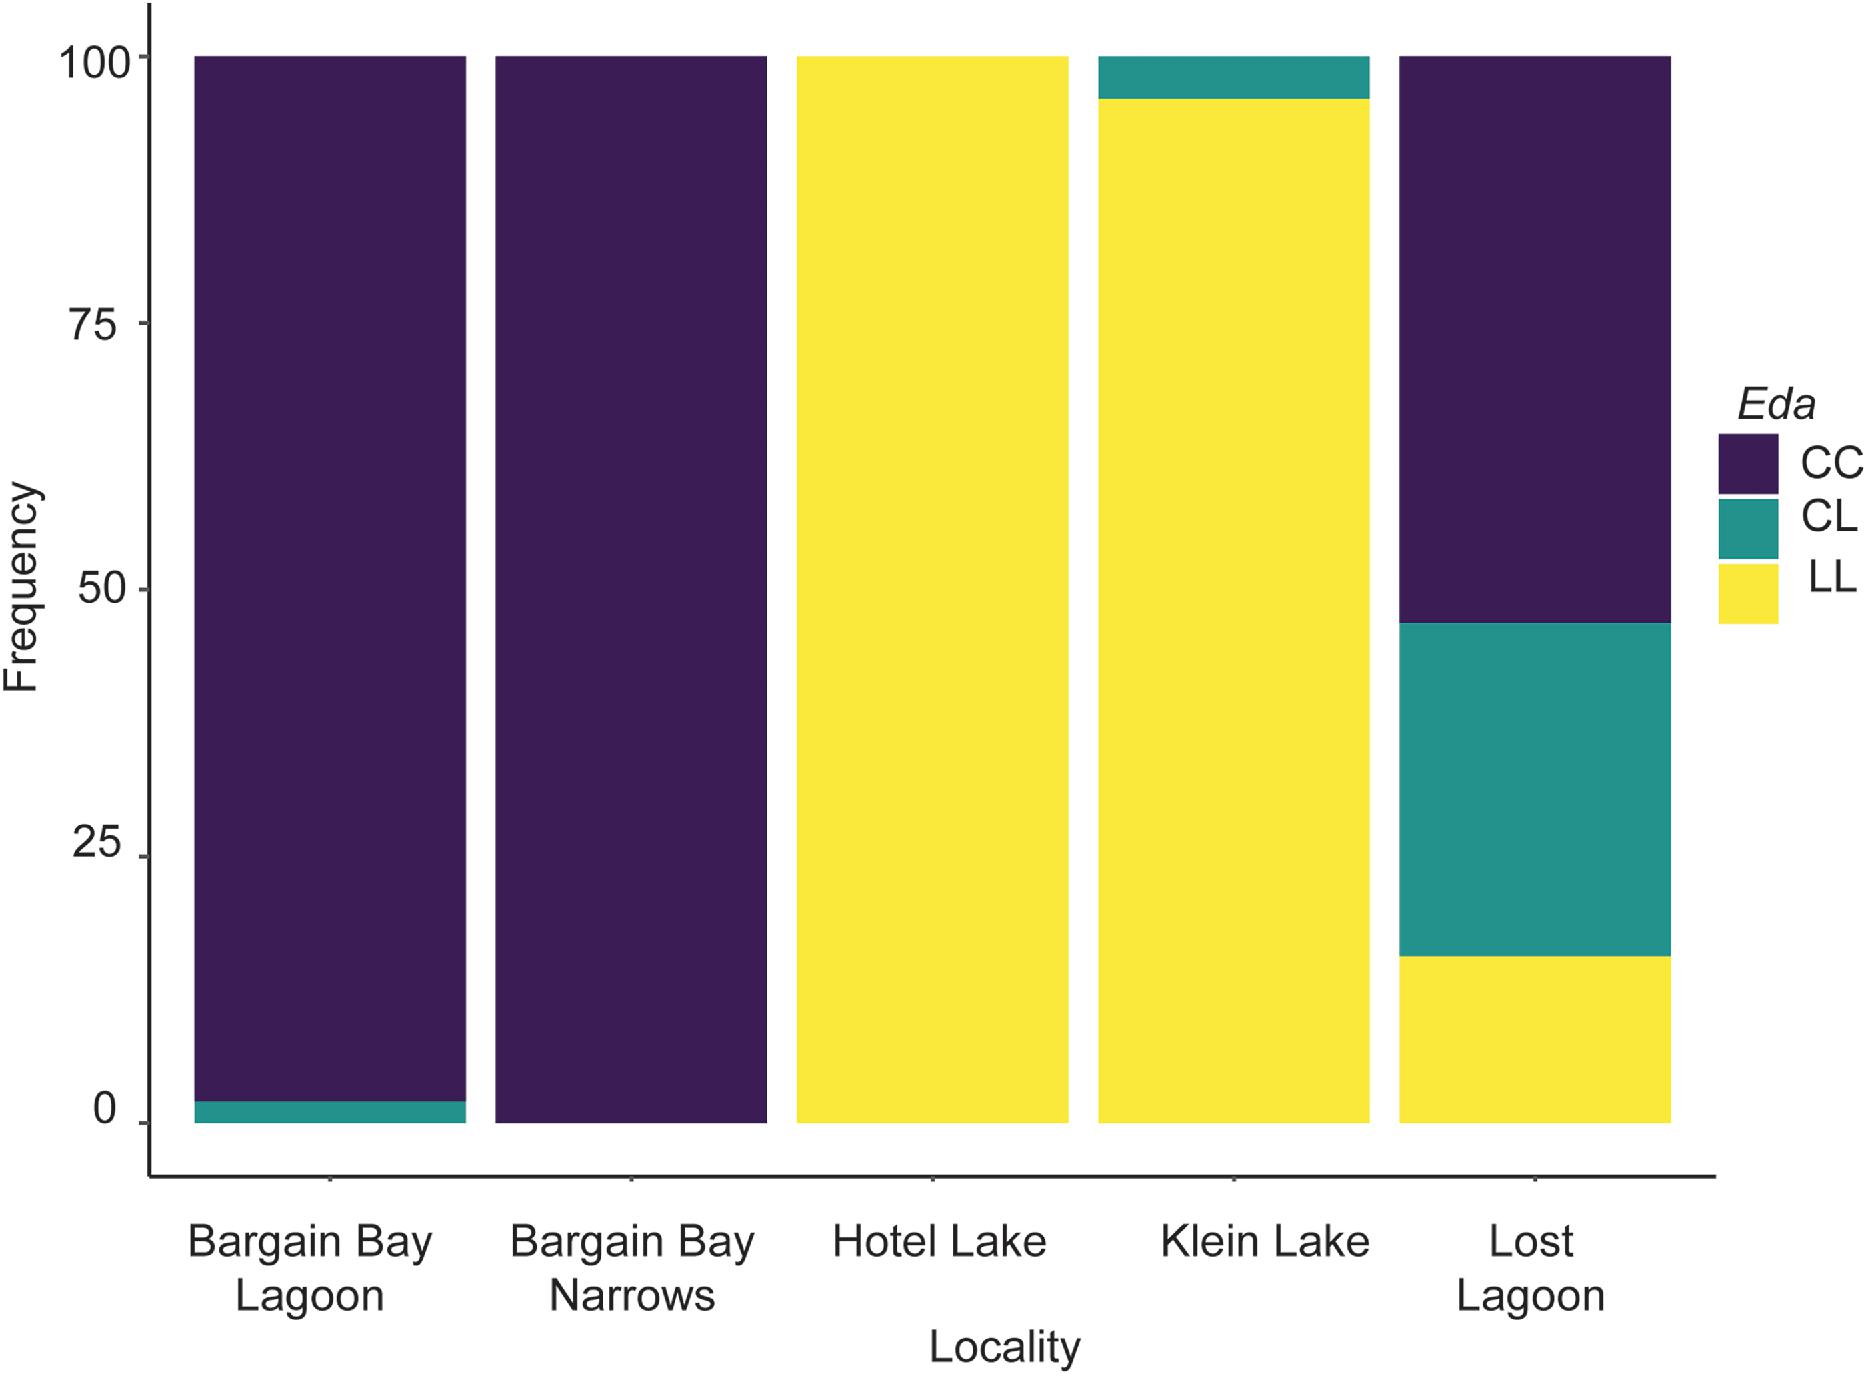
The frequency of the low-plated Eda allele was 42.19% in Lost Lagoon. This was much lower than samples from nearby freshwater populations of Hotel Lake (100%) and Klein Lake (98%) and much higher than samples from nearby marine populations Bargain Bay Lagoon (1%) and Bargain Bay Narrows (0%). Lost Lagoon was the only sample that contained all three Eda genotypes (Fig. 4).
Fig. 4.
Fig. 4. Eda genotype frequency in Lost Lagoon and comparative populations of threespine sticklebacks. CC = homozygous for the complete-plated Eda allele; CL = heterozygous for Eda alleles; LL = homozygous for the low-plated Eda allele.

Pooled sequencing

Pairwise FST (Table 2), calculated using over four million presumably non-genic SNPs to approximate neutrality, was effectively zero between the marine populations Bargain Bay Lagoon and Bargain Bay Narrows (0.0007). Pairwise FST was much higher between Lost Lagoon and both marine populations (∼0.13), Bargain Bay Lagoon and Bargain Bay Narrows. Freshwater Hotel and Klein Lake populations were even more differentiated from marine populations (0.26–0.32). These freshwater populations were also distinct from one another (0.31) and from Lost Lagoon (0.26–0.29). Overall, Lost Lagoon was more similar to the marine populations than the freshwater water populations; however, Lost Lagoon was much more differentiated from both marine populations than the marine populations were from one another (Table 2).
Table 2.
Table 2. Pairwise FST matrix for Lost Lagoon and comparative populations of threespine stickleback.
 Lost LagoonKlein LakeHotel LakeBargain Bay LagoonBargain Bay Narrows
Lost Lagoon00.29340.25520.12550.1325
Klein Lake 00.30940.31200.3202
Hotel Lake  00.26340.2663
Bargain Bay Lagoon   00.0007
Bargain Bay Narrows    0

Morphometric analysis

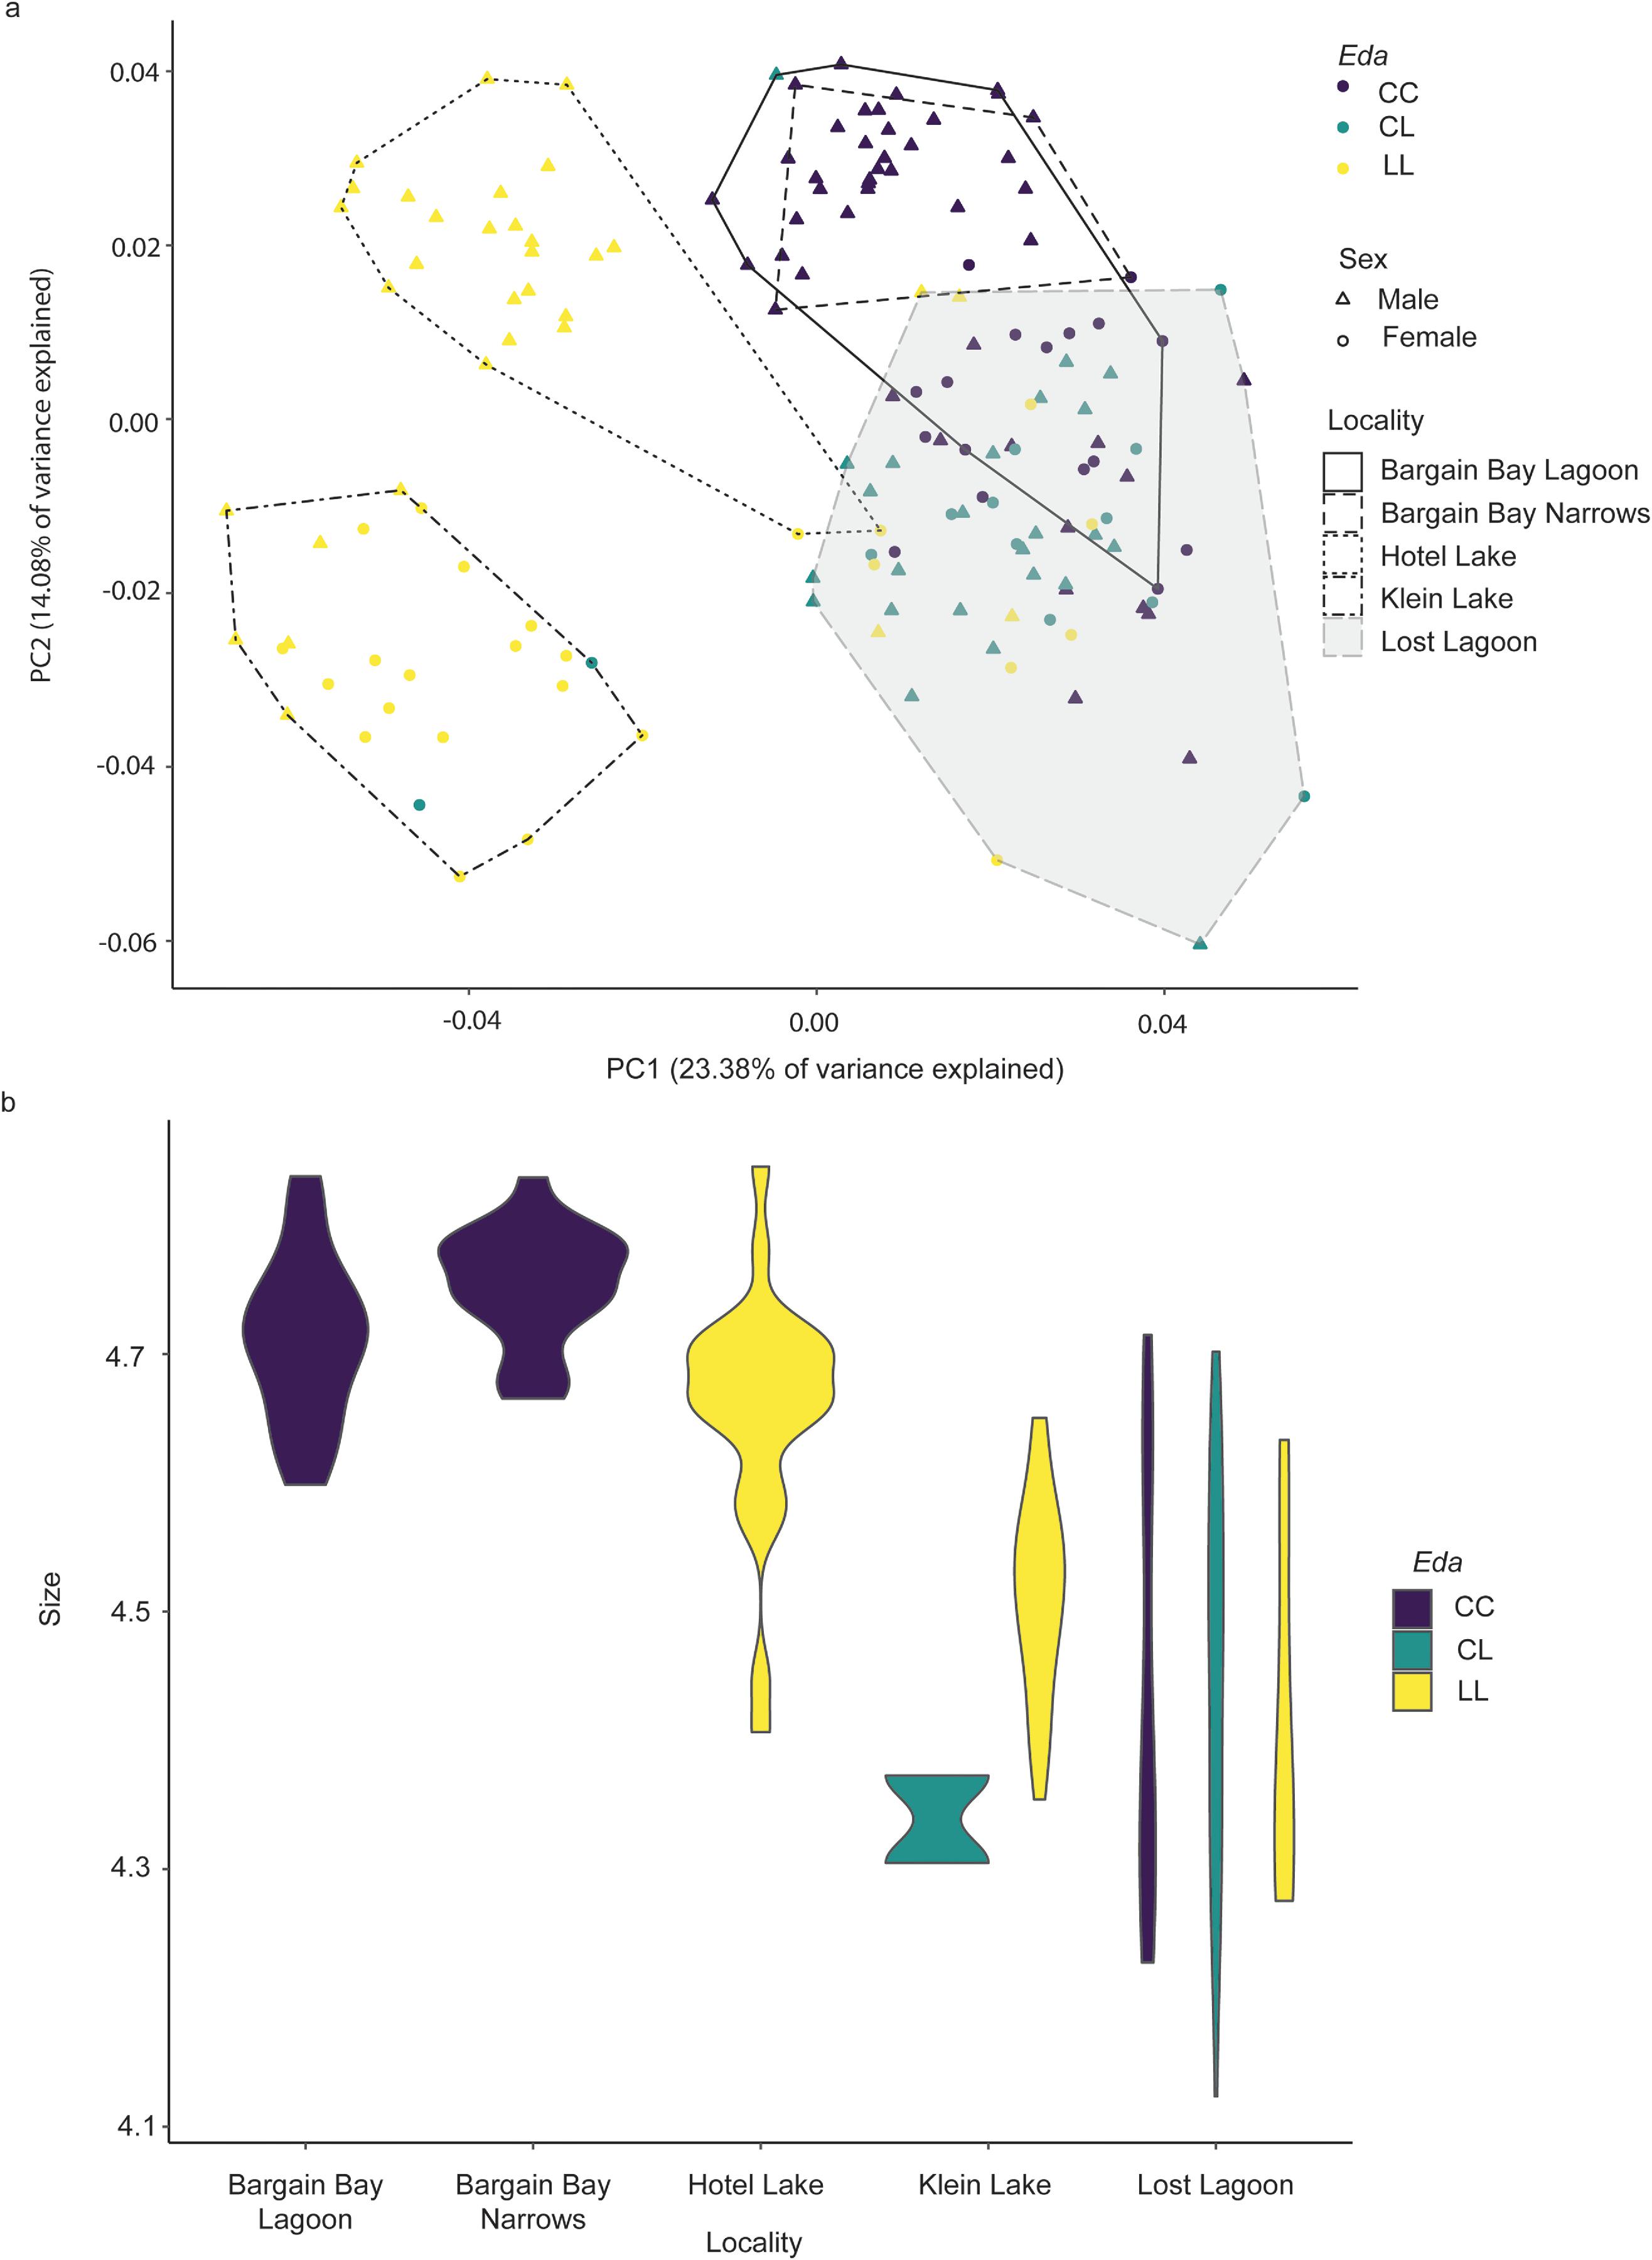
Centroid size, Eda, and sex all contributed significantly to differences in shape in the comparative sample containing individuals from Bargain Bay Lagoon, Bargain Bay Narrows, Hotel and Klein Lakes, and Lost Lagoon (Table 3). Additionally, there was a significant interaction between size and Eda. PCA conducted on Procrustes transformed landmark coordinates from individuals from Bargain Bay Lagoon, Bargain Bay Narrows, Hotel and Klein Lakes, and Lost Lagoon revealed that PC1 explained 23.38% of the variance in shape and PC2 explained 14.08% of the variance in shape (Fig. 5a). Overall, Lost Lagoon individuals clustered with marine individuals from Bargain Bay Lagoon and Bargain Bay Narrows (samples where the full plated allele was present with a frequency of 99%–100%) rather than with freshwater individuals from Hotel and Klein Lakes (samples where the low plated allele was present with a frequency of 98%–100%) despite the presence of all three genotypes in Lost Lagoon and the locality's confirmed freshwater status. Individuals from the two freshwater localities were highly differentiated in shape, while individuals from the two marine localities occupied the same region of morphospace, which overlapped with that occupied by Lost Lagoon individuals.
Fig. 5.
Fig. 5. (a) Principal components analysis of Lost Lagoon and comparative populations of marine (Bargain Bay Lagoon and Narrows) and freshwater (Hotel and Klein Lakes) threespine stickleback. Convex hulls indicate morphospace occupied by each locality. (b) Violin plot depicting the range of centroid sizes (natural log) found at each locality. CC = homozygous for complete-plated Eda allele; CL = heterozygous for Eda alleles; LL = homozygous for low-plated Eda allele; PC = principal component.
Table 3.
Table 3. Analysis of variance in shape for Lost Lagoon and comparative populations of threespine stickleback.
 DfSSMSFp
logSize10.02860.02869.80800.0001
eda20.010770.00541.84570.0026
Sex10.02120.02127.24570.0001
logSize:eda20.01160.00581.98790.0007
Residuals1510.44040.0029  
Total1570.6432   

Note: Df = degrees of freedom; eda = Eda genotype; F = F-statistic; logSize = natural log of centroid size; MS = mean square; SS = sum of squares.

PC1 separated freshwater individuals from both Hotel and Klein Lakes localities from Lost Lagoon and marine individuals (Fig. 5a). The negative end of PC1, where the freshwater individuals cluster, was associated with a shallower body, smaller pelvic girdle, a thinner pelvic plate that extends further anteriorly, shorter pelvic spines, an elongated head with a greater distance from the buccal region to the opercular region, bigger eyes, larger articular bone, deeper mouth, smaller basal plates, and a long and thin subopercle bone, whereas the positive end of PC1 where the marine individuals along with Lost Lagoon cluster was associated with a deeper body, larger pelvic girdle, longer pelvic spines, blunter snout with smaller distance from the buccal region to the opercular region, smaller eyes, smaller articular bone, shallower mouth, larger basal plates, and a shorter, thicker subopercle bone. Of note, individuals from Lost Lagoon displayed a range of body sizes that most closely resembled the range found in the freshwater localities used here for comparison (Fig. 5b), but Lost Lagoon individuals clustered with the considerably larger marine individuals along this axis, indicating that PC1, while likely containing elements of size, was not strictly a “size axis” and was heavily influenced by genotype. This is discussed further below.
The freshwater localities diverged substantially from each other along PC2, as did the two marine localities from Lost Lagoon, although the latter distinction was less clear (Fig. 5a). Variation along this axis was associated with differences in size and shape of the pelvic girdle, angle of the head in comparison to the body, basal plate and dorsal spine size, lateral plate size, and opercle and preopercle height. The negative end of PC2, where Klein Lake and Lost Lagoon clustered, was associated with a narrower and shorter pelvic girdle, thinner and shorter pelvic spines, more pointed anterior tips on the pelvic plate, a downturned head with less distance from the buccal region to the opercle region, smaller basal plates and dorsal spines, shorter lateral plates, a short and thick subopercle, and shorter opercle and preopercle bones. The positive end of PC2, where Hotel Lake, Bargain Bay Lagoon, and Bargain Bay Narrows clustered, was associated with a wider and taller pelvic girdle, wider and longer pelvic spines, a pelvic plate that ends bluntly, a slightly upturned and elongated head with more distance from the buccal region to the opercular region, larger basal plates and dorsal spines, longer lateral plates, a long and thin subopercle, and taller opercle and preopercle bones.
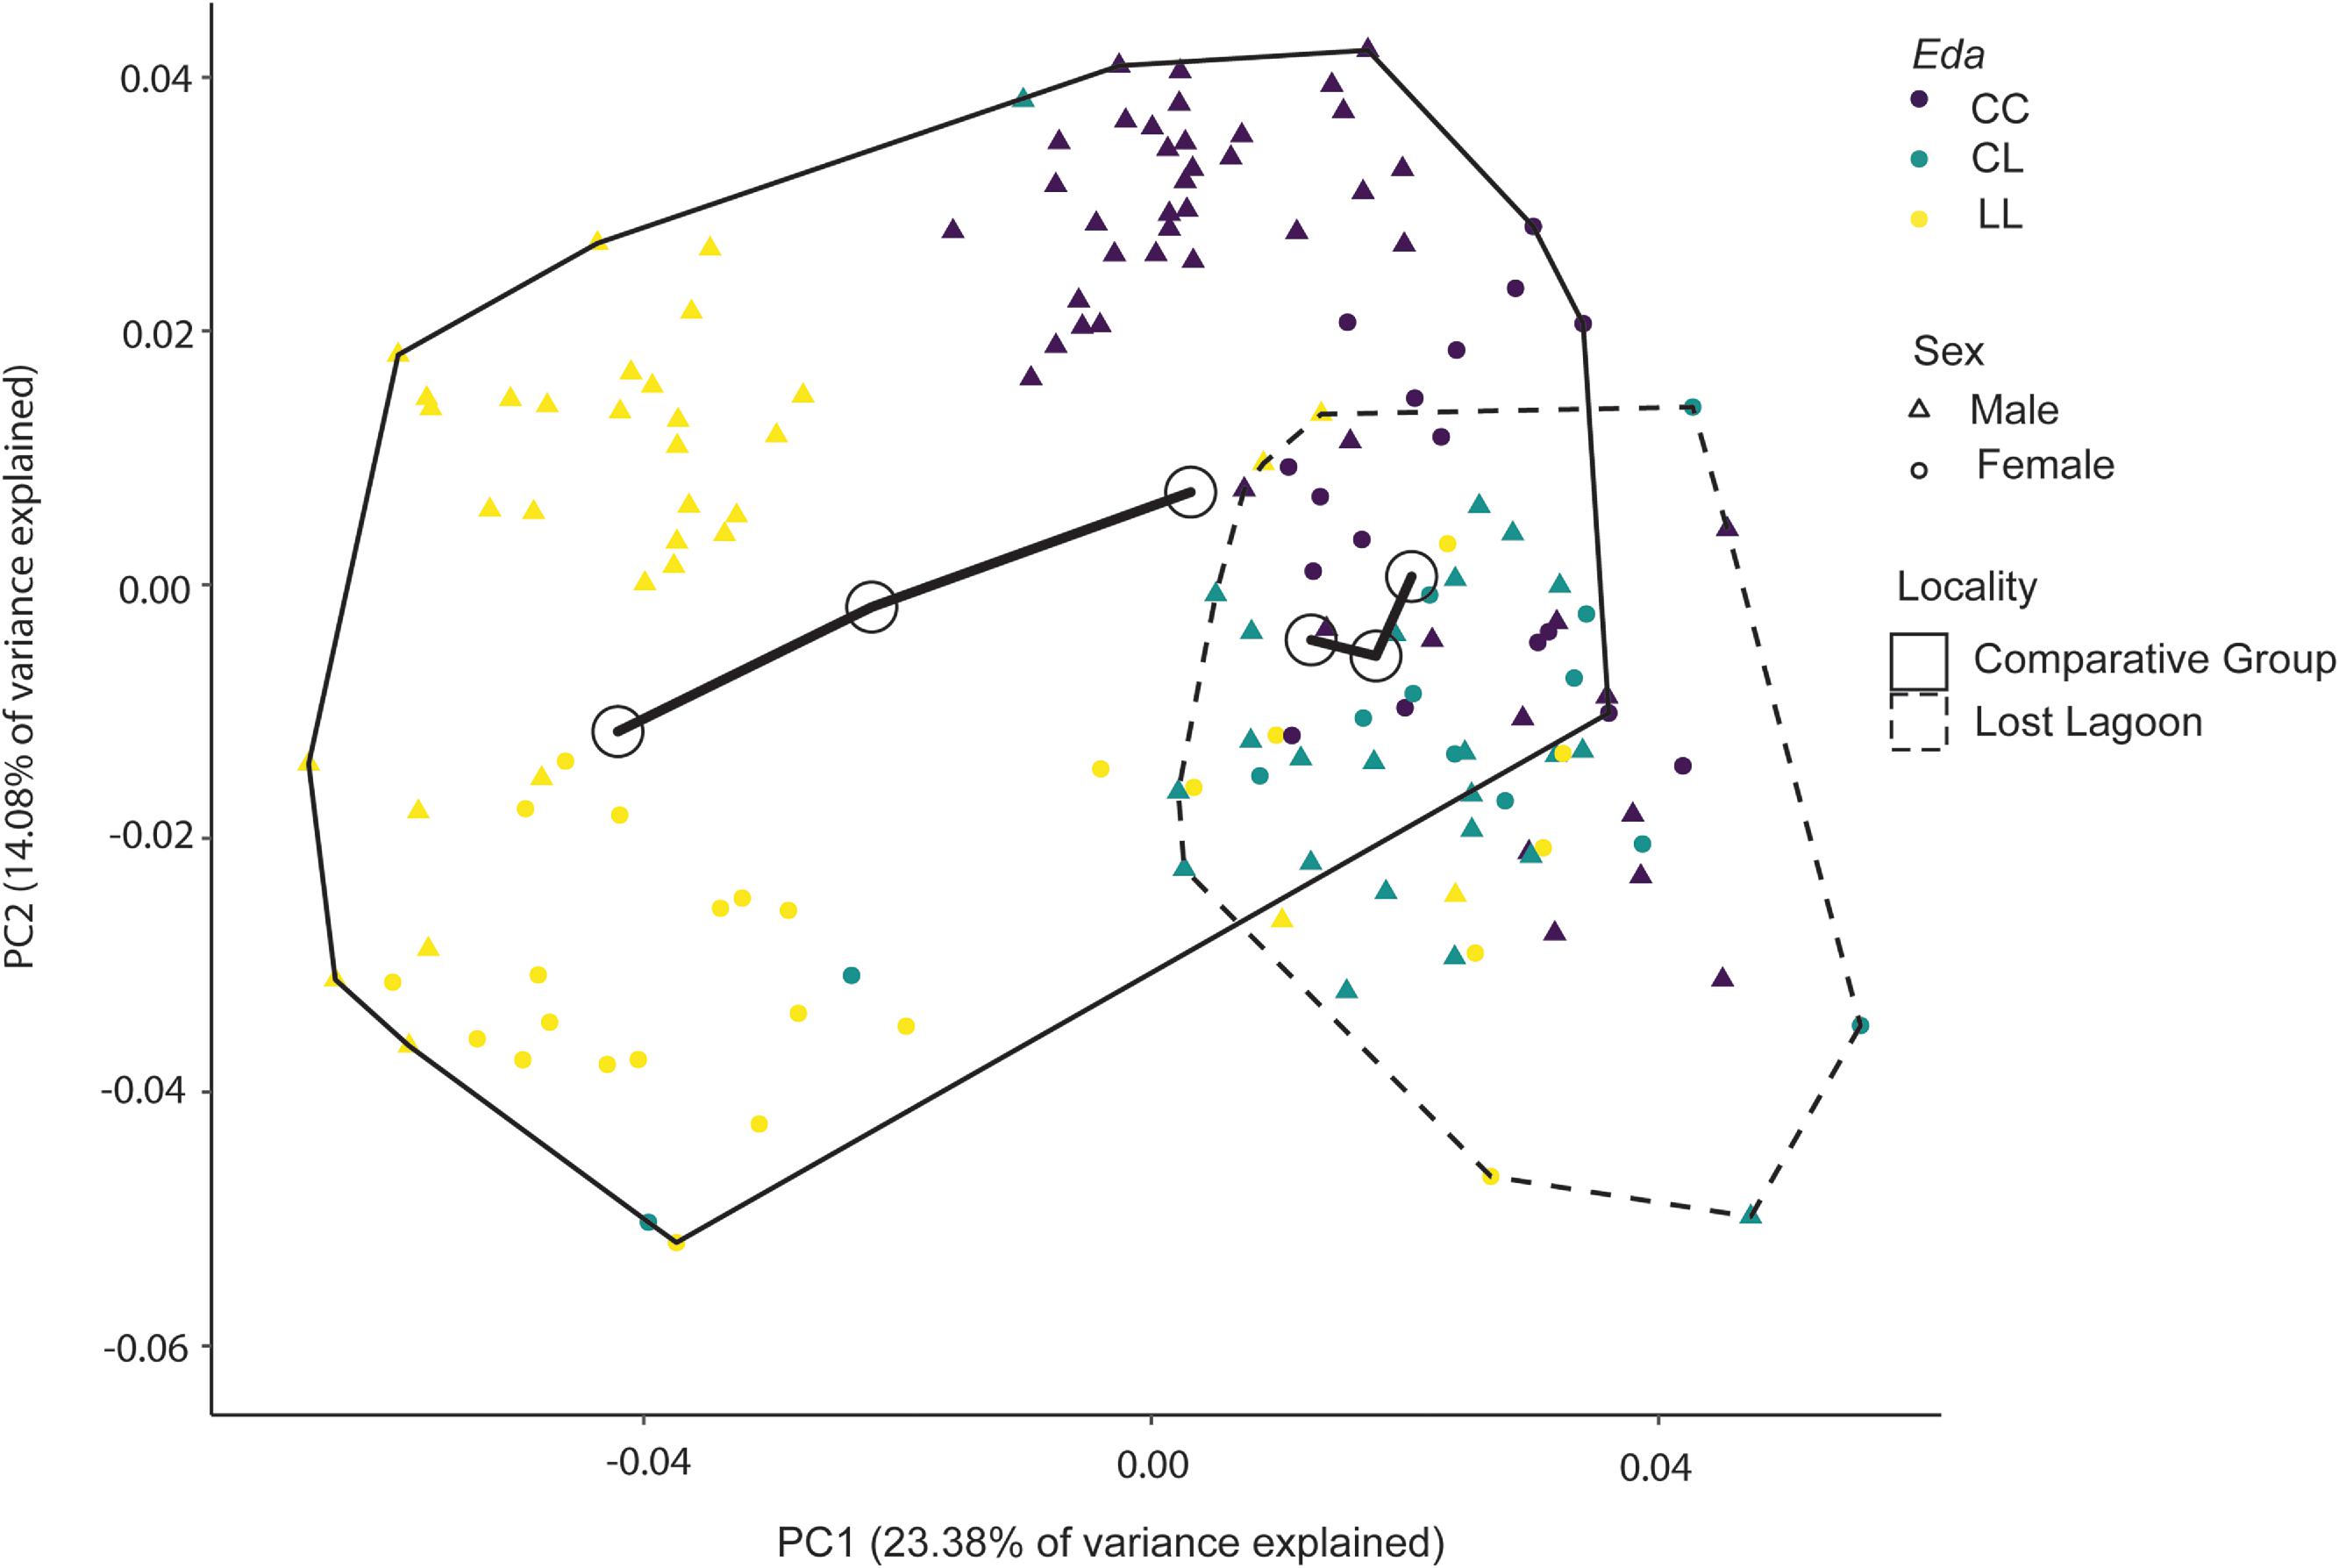
Phenotypic trajectory analysis indicated a clear, near-linear path between marine and freshwater genotypes in the comparative group, whereas the path inferred for Lost Lagoon genotypes indicates a deviation from this comparative trajectory (Fig. 6). Heterozygotes within the Lost Lagoon population do not fall on the line between marine and freshwater trajectory, indicating the presence of a phenotype in this sample that does not clearly represent an intermediate position along the evolutionary pathway from a marine to a freshwater phenotype. Despite appearing to be quite different when depicted graphically, the two trajectories calculated did not differ in length (p = 0.0839), direction (p = 0.6106), or shape (0.991), and we interpret these results with caution.
Fig. 6.
Fig. 6. Phenotypic trajectory analysis of Lost Lagoon and comparative populations of marine (Bargain Bay Lagoon and Narrows) and freshwater (Hotel and Klein Lakes) threespine stickleback. Compared to Fig. 5a for population groupings, convex hulls indicate morphospace occupied by the complete comparative group and Lost Lagoon. Open circles connected by paths indicate trajectories within each cluster. CC = homozygous for complete-plated Eda allele; CL = heterozygous for Eda alleles; LL = homozygous for low-plated Eda allele; PC = principal component.

Discussion

Results of this study support the hypothesis that threespine stickleback in Lost Lagoon have begun to undergo both genetic and phenotypic changes characteristic of adaptation to freshwater in the nearly 100 years since the population was isolated. Our results support our prediction that Lost Lagoon stickleback are genetically and phenotypically intermediate but are following a parallel trajectory to that described by the shape differences between marine and established freshwater groups. While our data do not allow us to exclude the possible confounding effects of environmental effects or genetic drift on the phenotypes we observe, our results suggest that the Lost Lagoon population has been captured in the midst of this evolutionary transition.
All three Eda genotypes are present within the Lost Lagoon threespine stickleback population, and these genotypes are reflected in lateral plate morph as expected (Fig. 2; Colosimo et al. 2004; Cresko et al. 2004; O'Brown et al. 2015; Peichel and Marques 2017). The tight match between Eda genotypes and lateral plate morphs provides further support for the well-established claim that Eda acts as a large effect gene and explains greater than 75% of the variation in the number of lateral plates (Colosimo et al. 2004). O'Brown et al. (2015) found that low-plated Eda alleles induce cis-acting regulatory changes, resulting in lower levels of expression in developing skeletal features such as lateral plates and spines compared to the complete plated Eda allele. The difference in expression proposed by O'Brown et al. (2015) provides a molecular mechanism that links Eda genotype and lateral plate morphs consistent with what is observed across the Holarctic (Colosimo et al. 2004; Cresko et al. 2004; Peichel and Marques 2017) and mirrored in Lost Lagoon.
Previous studies have linked Eda to variation in body shape, beyond lateral plate phenotype, through quantitative trait locus analysis (Albert et al. 2008; Rogers et al. 2012). Our results support this link in Lost Lagoon (Table 1). Although Aguirre and Bell (2012) observed a significant association between body shape and lateral plate morph, they noted that the mean variation in body shape between morphs was small and mostly associated with the size of bones. The divergence of homozygous low-plated individuals along PC2 in this study (Fig. 3) provides support for previous studies that suggest Eda has pleiotropic effects on shape (Albert et al. 2008; Barrett et al. 2009; Rogers et al. 2012) and is consistent with the observation that the number of lateral plates and shape vary in the same direction during freshwater adaptation (Klepaker 1993; Bell and Foster 1994; Schluter et al. 2004; Bjærke et al. 2010; Aguirre and Bell 2012). Eda heterozygotes and complete-plated homozygotes diverge very slightly in shape in the Lost Lagoon sample, and unsurprisingly, heterozygotes occupy more morphospace, indicating greater within-group variation.
When compared to nearby marine populations in Madeira Park, threespine stickleback in Lost Lagoon appear to have begun to adapt to freshwater conditions, supporting the main hypothesis for this study. The first and most obvious indication of adaptation is that the frequency of the low-plated Eda allele, and corresponding lateral plate phenotype, is much higher in Lost Lagoon at 42.19% than in the neighbouring marine populations of Bargain Bay Lagoon and Bargain Bay Narrows (Fig. 4). The low-plated Eda allele is absent in the sample from Bargain Bay Narrows and present at a frequency of 1% in Bargain Bay Lagoon (Morris et al. 2018), confirming that the complete-plated allele dominates marine environments off the coast of British Columbia, Canada. The presence of the low-plated allele in Bargain Bay Lagoon supports previous findings that the low-plated allele is present in marine populations as standing genetic variation (Colosimo et al. 2005; Barrett and Schluter 2008; Morris et al. 2018). The lack of low-plated Eda alleles in Bargain Bay Narrows is likely an artifact of the relatively small sample size (n = 50). Although the frequency of the low-plated Eda allele in Lost Lagoon is decidedly elevated compared to nearby marine populations, it is not nearly as high as in nearby freshwater populations in Madeira Park, Hotel and Klein Lakes, which were presumably colonized following deglaciation thousands of years ago (Fig. 4).
Pairwise FST, calculated using nongenic SNPs, provides further support for the hypothesis that Lost Lagoon is in a transitional state, beginning to diverge from marine populations but not yet as divergent as well-established freshwater populations. Results indicate Lost Lagoon is much more genetically differentiated from nearby marine populations than marine populations are from one another, indicating Lost Lagoon has genetically diverged from its presumably ancestral condition over the last ∼100 years (Table 2). However, Lost Lagoon remains more genetically similar to marine populations than the established freshwater populations to which it was compared (Table 2). Freshwater populations are as differentiated from one another as they are from marine populations at neutral loci due to isolation. While these results do not rule out the possibility that genetic differentiation in Lost Lagoon is the result of gene flow between marine and freshwater populations, this is unlikely based on the geography of the area. There are two potential seasonal inflows into Lost Lagoon: Ceperley Creek, which does not connect to a natural water reservoir but rather pumps municipal water into Lost Lagoon; and Beaver Lake, which may occasionally overflow in times of very high water levels. We have recently (2023) confirmed the presence of G. aculeatus in Beaver Lake. Passive dispersal caused by human activities, either intentionally or unintentionally, is also possible, especially in such an urban setting. Additionally, birds are commonly believed to be capable of moving fish eggs, although the empirical evidence for this phenomenon in stickleback is scant (Hirsch et al. 2018). Nonetheless, freshwater stickleback may contribute to the Lost Lagoon population.
Working with pooled data raises concerns about adequate sample size for accurate FST estimates, as large sample sizes have previously been viewed as essential. However, Willing et al. (2012) found that very small sample sizes can obtain accurate FST estimates when the number of genetic markers is large in simulated data, and this result has since been replicated in sequenced data (Nazareno et al. 2017). Using pooled sequencing results and an appropriate FST estimator that considers differences between pooled data and individual data produces accurate results when compared to individual sequencing results (Gautier et al. 2013; Hivert et al. 2018). The FST estimator in Poolfstat based on the analysis of variance that was developed and tested by Hivert et al. (2018) is unbiased and measures FST with accuracy when compared to results from individual sequencing as well as previous estimators for pooled sequencing. Pairwise FST values calculated in this study using Poolfstat with over four million SNPs can be reasonably interpreted as accurate based on these findings. Further analysis can be conducted to determine specific components of the population structure.
The results of morphometric analyses comparing shape among all individuals from all localities revealed significant effects of size, sex, and Eda on body shape as well as an interaction between size and Eda (Table 3), confirming the presence of nonuniform effects of size on shape in these samples. In particular, individuals from Lost Lagoon display a range of body sizes that most closely resemble those found in the freshwater localities, but rather than clustering with those localities as one would expect if PC1 were a “size component”, instead Lost Lagoon individuals cluster with the considerably larger marine individuals along this axis. This indicates that PC1 is relatively more heavily influenced by Eda genotype than size (Fig. 5). Divergence of marine and freshwater body shape in individuals from Madeira Park supports many previous studies that found parallel evolution in body shape varies in the same direction as lateral plate phenotype (Klepaker 1993; Bell and Foster 1994; Bell 2001; Schluter et al. 2004; Bjærke et al. 2010; Aguirre and Bell 2012).
Interestingly, Lost Lagoon stickleback resemble marine individuals in overall body shape, regardless of Eda genotype and corresponding lateral plate phenotype, despite their relatively smaller size. This suggests that Lost Lagoon stickleback are more similar in shape to marine populations characterized by a deeper body, a larger pelvic girdle, larger dorsal plates, a shorter head and blunter snout, and larger eyes (Fig. 5). Lost Lagoon stickleback diverge at least partially from marine populations genetically and in lateral plate phenotype, yet they cluster with marine populations along the main axis of variation in shape. Interestingly, phenotypic trajectory analysis does not indicate that the shape trajectory calculated for Lost Lagoon differs from that calculated for the comparison group, despite the presence of a relatively highly variable intermediate phenotype that clusters separately from most other individuals in the comparison group (Fig. 6). One possible explanation for this discrepancy is that the pace of adaptation differs between different phenotypic characteristics. Schluter et al. (2004) proposed that parallel evolution of the lateral plate phenotype relies on only a few genes with large effects, namely Eda, whereas parallel evolution of body shape relies on many genes with smaller effects. The results we report here support this hypothesis, although we note that our failure to observe significant differences in trajectory features is not a direct test of the similarity of these trajectories.
Lost Lagoon individuals cluster apart from marine individuals slightly along the second principal component. Individuals at either end of this axis vary in bone size, with Lost Lagoon stickleback trending towards exhibiting a smaller pelvic girdle and smaller dorsal plates (Fig. 5). However, this axis of variation may also be associated with sex. Male-dominated samples from Bargain Bay Narrows, Hotel Lake, and, to some extent, Bargain Bay Lagoon cluster at the positive end, while our female-dominated Klein Lake sample clusters near the negative end of the axis. Divergence of males towards the positive end and females towards the negative end of this axis also occurs within groups, except for Lost Lagoon, where males and females are interspersed. The most striking occurrence is in Hotel Lake, where the only two females present greatly diverge from the rest of the population. This divergence suggests that this axis of variation may be capturing variation that is partly driven by sex. Several previous studies have observed sexually mediated variation in morphological traits in stickleback (e.g., Aguirre et al. 2008; Aguirre and Akinpelu 2010; Leinonen et al. 2011a; Kitano et al. 2012), including between individuals from the comparative localities described here (Schutz et al. 2022). Interestingly, while there is a significant effect of sex on shape in Lost Lagoon (Table 1), the nature of this variation is not clearly captured along either of the two largest principal components of variation within this group (Fig. 3). Sexually mediated variation in stickleback is known to vary in expression across habitats (Spoljaric and Reimchen 2008) and may be obscured by habitat-associated differences in body shape (Schutz et al. 2022). In the Lost Lagoon population documented here, which is in the process of adapting to fresh water, changing Eda allele frequencies are likely driving gradual body shape change that is obscuring the nature of any sexually mediated variation in body shape within the Lost Lagoon sample. We also note that single-locus sex determination may be less reliable than a multi-locus approach (Toli et al. 2016), and while sexual dimorphism is not a central focus of this work, determining the relationship between sex and Eda may require a more complex consideration of sex determination.
Our results provide an interesting comparison to the three other well-documented examples of contemporary evolution in stickleback described above (Klepaker 1993; Kristjánsson et al. 2002; Bell et al. 2004). The time scale in these three cases is much shorter than in the present case, ranging from a maximum of ∼40 years in the Norwegian example (Klepaker 1993) to ∼12 years in the Icelandic example (Kristjánsson et al. 2002) to less than ten years in the Alaskan example (Bell et al. 2004). However, in all of these cases, the decline in low-plated morphs was much more pronounced than what we report here, indicating that the pace of evolution in different genetic and environmental contexts may be quite different. While we do not have the data to test the hypothesis about pace in the present study, this discrepancy suggests that further characterization of the evolutionary context will be important as we seek to further understand adaptive change in sticklebacks. We also note that these differences reinforce the caveat we raised earlier in the Discussion, namely that our data do not allow us to exclude the influence of either drift or environmental effects on the phenotypes we observe.
Taken together, the results of this study indicate that Lost Lagoon stickleback appear to be in the process of adapting both genetically and phenotypically to a freshwater environment, likely following the same parallel evolutionary trajectory that is understood to be common among transitioning stickleback in Eastern Pacific habitats, and our data reflect a snapshot of this transition at an intermediate point. We demonstrate, for the first time, the direct effects of changing Eda frequency on the lateral plate phenotype, providing an example of the genetic basis for parallel evolution on a contemporary timescale. In this example, the frequency of Eda genotypes and lateral plate phenotypes is not consistent with those that are characteristic of either marine or fully freshwater populations. Further, although Lost Lagoon is genetically distinct from nearby marine populations, these fish still more closely resemble those marine populations in overall body shape relative to either freshwater comparator, despite occupying a unique area of morphospace relative to the comparative populations studied here, suggesting an intermediate phenotype along this evolutionary trajectory. Eda frequency and lateral plate phenotype, as assessed in this study, seem to be changing faster than body shape in response to freshwater conditions, suggesting that future work might consider that the pace of adaptation differs across traits in response to the same environmental conditions in this system. Few stickleback populations have been identified in nature where all three Eda genotypes and corresponding lateral plate morphs are present at reasonably high frequencies. In those that have been identified, polymorphism is typically maintained by a balance between selection and gene flow (Raeymaekers et al. 2014) or disruptive natural selection (Marchinko et al. 2014). While these populations may be useful in testing for differences between Eda genotypes in a specific habitat, gene flow complicates the interpretation of results because individuals with different Eda genotypes do not necessarily have a shared genetic background, as some may be recent migrants. The presence of all three Eda genotypes in an isolated population in Lost Lagoon makes it an ideal population to test hypotheses for adaptation because of the natural presence of variation in Eda on a shared genetic background without gene flow. The results presented in this study support the findings of previous studies demonstrating contemporary evolution in stickleback (Klepaker 1993; Kristjánsson et al. 2002; Bell et al. 2004), and our results further bolster the case for G. aculeatus as a key model to investigate the strength and temporal dynamics of selection (Kingsolver et al. 2001; Siepielski et al. 2009). Future studies of this population should include repeated sampling over multiple years to determine the rate of evolutionary change in this population (Lande and Arnold 1983; Hendry and Kinnison 1999; Sanderson et al. 2022) to better compare with other known examples of contemporary evolution, including such systems as the Lake Malawi cichlids (Streelman et al. 2004), saltmarsh beetles (Van Belleghem et al. 2018), Heliconius butterflies (Reed et al. 2011), and others, which are powerful models to understand such evolutionary processes in detail.
Acknowledgements

The Universities of Calgary and Lethbridge are situated within the traditional territories of the people of the Treaty 7 region in Southern Alberta, which includes the Blackfoot Confederacy (comprising the Siksika, Piikani, and Kainai First Nations), as well as the Tsuut'ina First Nation, and the Stoney Nakoda (including the Chiniki, Bearspaw, and Goodstoney First Nations). The City of Calgary is also home to Métis Nation of Alberta, Districts 5 and 6. We acknowledge and respect the traditional caretakers of the lands in which we collected samples and performed this work, including the Musqueam, Squamish, and Tsleil Waututh nations. This study was supported by the Natural Sciences and Engineering Research Council of Canada through Discovery Grants to SMR and HAJ, and graduate awards to AMK, TNB, and BCMS. We are grateful to the members of the Rogers and Jamniczky labs and the staff of the Bamfield Marine Sciences Centre, whose support was critical to the completion of this project.

References

Adams D., Collyer M.L., Kaliontzopoulou A., Baken E. 2022. Geomorph: software for geometric morphometric analyses. R package version 4.0.4.
Aguirre W.E., Ellis K.E., Kusenda M., Bell MA. 2008. Phenotypic variation and sexual dimorphism in anadromous threespine stickleback: implications for postglacial adaptive radiation. Biological Journal of the Linnean Society, 95(3): 465–478.
Aguirre W.E., Akinpelu O. 2010. Sexual dimorphism of head morphology in three-spined stickleback Gasterosteus aculeatus. Journal of Fish Biology, 77(4): 802–821.
Aguirre W.E., Bell MA. 2012. Twenty years of body shape evolution in a threespine stickleback population adapting to a lake environment. Biological Journal of the Linnean Society, 105(4): 817–831.
Albert A.Y.K., Sawaya S., Vines T.H., Knecht A.K., Miller C.T., Summers B.R., et al. 2008. The genetics of adaptive shape shift in stickleback: pleiotropy and effect size. Evolution: International Journal of Organic Evolution, 62(1): 76–85. Available from http://onlinelibrary.wiley.com/doi/10.1111/j.1558-5646.2007.00259.x/full.
Baken E., Collyer M.L., Kaliontzopoulou A., Adams D. 2021. geomorph v4.0 and gmShiny: enhanced analytics and a new graphical interface for a comprehensive morphometric experience.
Barrett R.D.H., Schluter D. 2008. Adaptation from standing genetic variation. Trends in Ecology & Evolution, 23(1): 38–44. Available from http://linkinghub.elsevier.com/retrieve/pii/S0169534707002868.
Barrett R.D.H., Rogers S.M., Schluter D. 2008. Natural selection on a major armor gene in threespine stickleback. Science, 322(5899): 255–257.
Barrett R.D.H., Rogers S.M., Schluter D. 2009. Environment specific pleiotropy facilitates divergence at the ectodysplasin locus in threespine stickleback. Evolution: International Journal of Organic Evolution, 63(11): 2831–2837.
Barrett R.D.H., Paccard A., Healy T.M., Bergek S., Schulte P.M., Schluter D., et al. 2010. Rapid evolution of cold tolerance in stickleback. Proceedings of the Royal Society B: Biological Sciences, 278(1703): 233–238.
Barry TN. 2019. Ecology and genetics of phenotypic integration and the role for adaptation in Threespine Stickleback. Ph.D.thesis, University of Calgary.
Bell M.A., Foster SA. 1994. The evolutionary biology of the threespine stickleback. Oxford University Press, New York. pp.1–584.
Bell MA. 2001. Lateral plate evolution in the threespine stickleback: getting nowhere fast. Genetica, 112/113: 445–461.
Bell M.A., Aguirre W.E., Buck NJ. 2004. Twelve years of contemporary armor evolution in a threespine stickleback population. Evolution: International Journal of Organic Evolution, 58(4): 814–824. Available from http://doi.wiley.com/10.1111/j.0014-3820.2004.tb00414.x.
Bergstrom CA. 2002. Fast-start swimming performance and reduction in lateral plate number in threespine stickleback. Canadian Journal of Zoology, 80(2): 207–213.
Bjærke O., Østbye K., Lampe H.M., Vøllestad LA. 2010. Covariation in shape and foraging behaviour in lateral plate morphs in the three-spined stickleback. Ecology of Freshwater Fish, 19(2): 249–256.
Bolger A.M., Lohse M., Usadel B. 2014. Trimmomatic: a flexible trimmer for Illumina sequence data. Bioinformatics, 30(15): 2114–2120.
Bolnick D.I., Barrett R.D.H., Oke K.B., Rennison D.J., Stuart YE. 2018. (Non)Parallel evolution. Annual Review of Ecology, Evolution, and Systematics, 49: 303–330.
Carl C.G. 1932. A biological survey of Lost Lagoon. M.Sc. thesis, The University of British Columbia.
Collyer M.L., Adams DC. 2013. Phenotypic trajectory analysis: comparison of shape change patterns in evolution and ecology. Hystrix, the Italian Journal of Mammalogy, 24(1): 75–83. Available from http://www.italian-journal-of-mammalogy.it/article/view/6298.
Collyer M.L., Sekora D.J., Adams DC. 2015. A method for analysis of phenotypic change for phenotypes described by high-dimensional data. Heredity, 115: 357–365.
Collyer M.L., Adams D. 2018. RRPP: an R package for fitting linear models to high-dimensional data using residual randomization.
Collyer M.L., Adams D. 2021. RRPP: linear model evaluation with randomized residuals in a permutation procedure. R package version 1.1.2.
Colosimo P.F., Peichel C.L., Nereng K., Blackman B.K., Shapiro M.D., Schluter D., et al. 2004. The genetic architecture of parallel armor plate reduction in threespine sticklebacks. PLoS Biology, 2(5): e109.
Colosimo P.F., Hosemann K.E., Balabhadra S., Villareal Jr G., Dickson M., Grimwood J., et al. 2005. Widespread parallel evolution in sticklebacks by repeated fixation of ectodysplasin alleles. Science, 307(5717): 1928–1933.
Cresko W.A., Amores A., Wilson C., Murphy J., Currey M., Phillips P., et al. 2004. Parallel genetic basis for repeated evolution of armor loss in Alaskan threespine stickleback populations. Proceedings of the National Academy of Sciences of the United States of America, 101(16): 6050–6055.
DeFaveri J., Merilä J. 2013. Evidence for adaptive phenotypic differentiation in Baltic Sea sticklebacks. Journal of Evolutionary Biology, 26(8): 1700–1715.
Endler JA. 1986. Natural selection in the wild. Princeton University Press, Princeton, NJ. 336p.
Gautier M., Foucaud J., Gharbi K., Cezard T., Galan M., Loiseau A., et al. 2013. Estimation of population allele frequencies from next-generation sequencing data: pool-versus individual-based genotyping. Molecular Ecology, 22(14): 3766–3779.
Gautier M., Vitalis R., Flori L., Estoup A. 2022. f-Statistics estimation and admixture graph construction with Pool-Seq or allele count data using the R package poolfstat. Molecular Ecology Resources, 22(4): 1394–1416.
Giles N. 1983. The possible role of environmental calcum levels during the evolution of phenotypic diversity in Outer Hebridean populations of the three-spined stickleback, Gasterosteus aculeatus. Journal of Zoology, 199(4): 535–544.
Glazer A.M., Killingbeck E.E., Mitros T., Rokhsar D.S., Miller CT. 2015. Genome assembly improvement and mapping convergently evolved skeletal traits in sticklebacks with genotyping-by-sequencing. G3 Genes|Genomes|Genetics, 5(7): 1463–1472.
Hagen D.W., Gilbertson LG. 1972. Geographic variation and environmental selection in Gasterosteus aculeatus L. in the Pacific Northwest, America. Evolution; International Journal of Organic Evolution, 26(1): 32–51.
Hagen D.W., Gilbertson LG. 1973. The genetics of plate morphs in freshwater threespine sticklebacks. Heredity, 31(1): 75–84.
Hairston N.G. Jr., Ellner S.P., Geber M.A., Yoshida T., Fox JA. 2005. Rapid evolution and the convergence of ecological and evolutionary time. Ecology Letters, 8(10): 1114.
Hendry A.P., Kinnison MT. 1999. The pace of modern life: measuring rates of contemporary microevolution. Evolution: International Journal of Organic Evolution, 53(6): 1637–1653.
Heuts M.J. 1947. Experimental studies on adaptive evolution in Gasterosteus aculeatus L. Evolution: International Journal of Organic Evolution, 1: 89–102.
Hirsch P.E., N'Guyen A., Muller R., Adrian-Kalchhauser I., Burkhardt-Holm P. 2018. Colonizing islands of water on dry land—on the passive dispersal of fish eggs by birds. Fish and Fisheries, 19(3): 502–510.
Hivert V., Leblois R., Petit E.J., Gautier M., Vitalis R. 2018. Measuring genetic differentiation from Pool-seq data. Genetics, 210(1): 315–330.
Jones F.C., Grabherr M.G., Chan Y.F., Russell P., Mauceli E., Johnson J., et al. 2012. The genomic basis of adaptive evolution in threespine sticklebacks. Nature, 484(7392): 55–61.
Kingsolver J.G., Hoekstra H.E., Hoekstra J.M., Berrigan D., Vignieri S.N., Hill C.E., et al. 2001. The strength of phentoypic selection in natural populations. The American Naturalist, 157(3): 245–261.
Kitano J., Mori S., Peichel C. 2012. Reduction of sexual dimorphism in stream-resident forms of three-spined stickleback Gasterosteus aculeatus. Journal of Fish Biology, 80(1): 131–146.
Klepaker T. 1993. Morphological changes in a marine population of threespined stickleback, Gasterosteus aculeatus, recently isolated in fresh water. Canadian Journal of Zoology, 71: 1251.
Kofler R., Orozco-terWengel P., De Maio N., Pandey R.V., Nolte V., Futschik A., et al. 2011. PoPoolation: a toolbox for population genetic analysis of next generation sequencing data from pooled individuals. PLoS One, 6(1): e15925.
Kozak AM. 2021. Investigating adaptation in marine threespine stickleback (Gasterosteus aculeatus) recently isolated to lost Lagoon, British Columbia. M.Sc. thesis, University of Calgary.
Kristjánsson B.K., Skúlason S., Noakes DLG. 2002. Rapid divergence in a recently isolated population of threespine stickleback (Gasterosteus aculeatus L.). Evoluionary Ecology Research, 4: 659–672.
Lande R., Arnold S.J. 1983. The measurement of selection on correlated characters. Evolution: International Journal of Organic Evolution, 37(6): 1210–1226.
Laurentino T.G., Boileau N., Ronco F., Berner D. 2022. The ectodysplasin–a receptor is a candidate gene for lateral plate number variation in stickleback fish. G3 Genes|Genomes|Genetics, 12(6). Available from https://www.ncbi.nlm.nih.gov/pubmed/35377433.
Leinonen T., Cano J.M., Merilä J. 2011a. Genetic basis of sexual dimorphism in the threespine stickleback Gasterosteus aculeatus. Heredity, 106(2): 218–227.
Leinonen T., Herczeg G., Cano J.M., Merilä J. 2011b. Predation-imposed selection on threespine stickleback (Gasterosteus aculeatus) moprhology: a test of the refuge use hypothesis. Evolution: International Journal of Organic Evolution, 65(10): 2916–2926.
Le Rouzic A., Østbye K., Klepaker T., Hansen T.F., Bernatchez L., Schluter D., et al. 2011. Strong and consistent natural selection associated with armour reduction in sticklebacks. Molecular Ecology, 20(12): 2483–2493.
Li H., Durbin R. 2009. Fast and accurate short read alignment with Burrows–Wheeler transform. Bioinformatics, 25(14): 1754–1760.
Li H., Handsaker B., Wysoker A., Fennell T., Ruan J., Homer N., et al. 2009. The sequence alignment/map format and SAMtools. Bioinformatics, 25(16): 2078–2079.
Lind M.I., Ingvarsson P.K., Johansson H., Hall D., Johansson F. 2011. Gene flow and selection on phenotypic plasticity in an island system of Rana temporaria. Evolution: International Journal of Organic Evolution, 65(3): 684–697.
Linnen C.R., Hoekstra HE. 2009. Measuring natural selection on genotypes and phenotypes in the wild. Cold Spring Harbor Symposia on Quantitative Biology, 74: 155–168.
Lucek K., Roy D., Bezault E., Sivasundar A., Seehausen O. 2010. Hybridization between distinct lineages increases adaptive variation during a biological invasion: stickleback in Switzerland. Molecular Ecology, 19(18): 3995–4011.
Mäkinen H.S., Cano J.M., Merilä J. 2006. Genetic relationships among marine and freshwater populations of the European three-spined stickleback (Gasterosteus aculeatus) revealed by microsatellites. Molecular Ecology, 15(6): 1519–1534.
Marchinko K.B., Schluter D. 2007. Parallel evolution by correlated response: lateral plate reduction in threespine stickleback. Evolution: International Journal of Organic Evolution, 61(5): 1084–1090.
Marchinko K.B., Matthews B., Arnegard M.E., Rogers S.M., Schluter D. 2014. Maintenance of a genetic polymorphism with disruptive natural selection in stickleback. Current Biology, 24(11): 1289–1292.
McKinnon JS. 2002. Speciation in nature: the threespine stickleback model systems. Trends in Ecology & Evolution. Available from http://www.sciencedirect.com/science/article/pii/S016953470202579X.
Morris M.R.J., Bowles E., Allen B.E., Jamniczky H.A., Rogers S.M. 2018. Contemporary ancestor? Adaptive divergence from standing genetic variation in Pacific marine threespine stickleback. BMC Evolutionary Biology, 18(1): 113.
Nazareno A.G., Bemmels J.B., Dick C.W., Lohmann LG. 2017. Minimum sample sizes for population genomics: an empirical study from an Amazonian plant species. Molecular Ecology Resources, 17(6): 1136–1147.
O'Brown N., Summers B.R., Jones F.C., Brady S.D., Kingsley D.M. 2015. A recurrent regulatory change underlying altered expression and Wnt response of the stickleback armor plates gene EDA. Elife, 4: e05290.
Peichel C.L., Marques DA. 2017. The genetic and molecular architecture of phenotypic diversity in sticklebacks. Philosophical Transactions of the Royal Society of London B Biological Sciences, 372(1713). Available from https://www.ncbi.nlm.nih.gov/pubmed/27994127.
Peichel C.L., Ross J.A., Matson C.K., Dickson M., Grimwood J., Schmutz J., et al. 2004. The master sex-determination locus in threespine sticklebacks is on a nascent Y chromosome. Current Biology, 14(16): 1416–1424.
Peichel C.L., Sullivan S.T., Liachko I., White MA. 2017. Improvement of the threespine stickleback genome sing a Hi-C-based proximity-guided assembly. Journal of Heredity, 108(6): 693–700.
R Team 2020. RStudio: integrated development for R. RStudio, Inc., Boston, MA.
R Team 2022. R: a language and environment for statistical computing. R Foundation for Statistical Computing, Vienna, Austria.
Raeymaekers J.A., Konijnendijk N., Larmuseau M.H., Hellemans B., De Meester L., Volckaert FA. 2014. A gene with major phenotypic effects as a target for selection vs. homogenizing gene flow. Molecular Ecology, 23(1): 162–181.
Reed R.D., Papa R., Martin A., Hines H.M., Counterman B.A., Pardo-Diaz C., et al. 2011. optix drives the repeated convergent evolution of butterfly wing pattern mimicry. Science, 333: 1137–1141.
Reimchen TE. 1983. Structural relationships between spines and lateral plates in threespine stickleback (Gasterosteus aculeatus). Evolution: International Journal of Organic Evolution, 37(5):931–946.
Reimchen TE. 1992. Injuries on stickleback from attacks by a toothed predator (Oncorhyncus) and implications for the evolution of lateral plates. Evolution; International Journal of Organic Evolution, 46(4): 1224–1230.
Reimchen TE. 1994. Predators and morphological evoltuion in threespine stickleback. In The evolutionary biology of the threespine stickleback. Edited by M.A. Bell, S.A. Foster. Oxford University Press, Oxford. pp. 240–273.
Reimchen TE. 2000. Predator handling failures of lateral plate morphs in Gasterosteus aculeatus: functional implications for the ancestral plate condition. Behavior, 137(7/8): 1081–1096.
Roesti M., Kueng B., Moser D., Berner D. 2015. The genomics of ecological vicariance in threespine stickleback fish. Nature Communications, 6: 8767.
Rogers S.M., Tamkee P., Summers B., Balabahadra S., Marks M., Kingsley D.M., et al. 2012. Genetic signature of adaptive peak shift in threespine stickleback. Evolution: International Journal of Organic Evolution, 66(8): 2439–2450.
Sanderson S., Beausoleil M.O., O'Dea R.E., Wood Z.T., Correa C., Frankel V., et al. 2022. The pace of modern life, revisited. Molecular Ecology, 31(4): 1028–1043.
Schluter D., Nagel LM. 1995. Parallel speciation by natural selection. The American Naturalist, 146(2): 292–301.
Schluter D., Clifford E.A., Nemethy M., McKinnon JS. 2004. Parallel evolution and inheritance of quantitative traits. The American Naturalist, 163(6): 809–822.
Schutz H., Anderson R.J., Warwick E.G., Barry T.N., Jamniczky HA. 2022. Sexually mediated phenotypic variation within and between sexes as a continuum structured by ecology: the mosaic nature of skeletal variation across body regions in threespine stickleback (Gasterosteus aculeatus L.). Ecology and Evolution, 12(10):e9367.
Siepielski A.M., DiBattista J.D., Carlson S.M. 2009. It's about time: the temporal dynamics of phenotypic selection in the wild. Ecology Letters, 12: 1261–1276.
Simpson GG. 1953. The major features of evolution. Columbia University Press, New York.
Spoljaric M.A., Reimchen TE. 2008. Habitat-dependent reduction of sexual dimorphism in geometric body shape of Haida Gwaii threespine stickleback. Biological Journal of the Linnean Society, 95: 505–516.
Stanford BCM. 2019. Conservation genomics of the endangered Banff Springs snail (Physella johnsoni) using Pool-seq. M.Sc. thesis, University of Calgary.
Stockwell C.A., Hendry A.P., Kinnison MT. 2003. Contemporary evolution meets conservation biology. Trends in Ecology & Evolution, 18(2): 94–101.
Streelman J.T., Gmyrek S.L., Kidd M.R., Kidd C., Robinson R.L., Hert E., et al. 2004. Hybridization and contemporary evolution in an introduced cichlid fish from Lake Malawi National Park. Molecular Ecology, 13(8): 2471–2479.
Toli E.A., Calboli F.C., Shikano T., Merila J. 2016. A universal and reliable assay for molecular sex identification of three-spined sticklebacks (Gasterosteus aculeatus). Molecular Ecology Resources, 16(6): 1389–1400.
Van Belleghem S.M., Vangestel C., De Wolf K., De Corte Z., Most M., Rastas P., et al. 2018. Evolution at two time frames: polymorphisms from an ancient singular divergence event fuel contemporary parallel evolution. PLos Genetics, 14(11): e1007796.
Wake D.B., Wake M.H., Specht C. 2011. Homoplasy: from detecting pattern to determining process and mechanism of evolution. Science, 331: 1032–1035.
Wickham H. 2016. ggplot2: elegant graphics for data analysis. Springer Verlag, New York.
Willing E.M., Dreyer C., van Oosterhout C. 2012. Estimates of genetic differentiation measured by F(ST) do not necessarily require large sample sizes when using many SNP markers. PLoS One, 7(8): e42649.

Supplementary material

Supplementary Material 1 (TIF / 100 MB).
Supplementary Material 2 (DOCX / 15.1 KB).

Information & Authors

Information

Published In

cover image FACETS
FACETS
Volume 9January 2024
Pages: 1 - 16
Editor: David Lesbarrères

History

Received: 24 March 2023
Accepted: 28 November 2023
Version of record online: 18 April 2024

Data Availability Statement

Raw data and code will be archived with Dryad upon acceptance.

Key Words

  1. threespine stickleback
  2. Ectodysplasin
  3. contemporary evolution
  4. lateral plates
  5. geometric morphometrics

Sections

Subjects

Plain Language Summary

Evolution in real-time — the case of threespine stickleback fish in Stanley Park, British Columbia

Authors

Affiliations

Aspen M. Kozak
McCaig Institute for Bone & Joint Health and Department of Cell Biology & Anatomy, University of Calgary, Calgary, AB, Canada
Author Contributions: Conceptualization, Formal analysis, Writing – original draft, and Writing – review & editing.
Department of Biological Sciences, University of Lethbridge, Lethbridge, AB, Canada
Author Contributions: Formal analysis and Writing – review & editing.
Department of Biological Sciences, University of Calgary, Calgary, AB, Canada
Author Contributions: Formal analysis and Writing – review & editing.
Department of Biological Sciences, University of Calgary, Calgary, AB, Canada
Author Contributions: Conceptualization, Funding acquisition, Supervision, and Writing – review & editing.
McCaig Institute for Bone & Joint Health and Department of Cell Biology & Anatomy, University of Calgary, Calgary, AB, Canada
Author Contributions: Conceptualization, Formal analysis, Funding acquisition, Supervision, Writing – original draft, and Writing – review & editing.
Heather Jamniczky served as Subject Editor at the time of manuscript review and acceptance and did not handle peer review and editorial decisions regarding this manuscript.

Author Contributions

Conceptualization: AMK, SMR, HAJ
Formal analysis: AMK, TNB, BCMS, HAJ
Funding acquisition: SMR, HAJ
Supervision: SMR, HAJ
Writing – original draft: AMK, HAJ
Writing – review & editing: AMK, TNB, BCMS, SMR, HAJ

Competing Interests

The authors declare no conflicts of interest.

Funding Information

Metrics & Citations

Metrics

Other Metrics

Citations

Cite As

Export Citations

If you have the appropriate software installed, you can download article citation data to the citation manager of your choice. Simply select your manager software from the list below and click Download.

There are no citations for this item

View Options

View options

PDF

View PDF

Get Access

Media

Media

Other

Tables

Share Options

Share

Share the article link

Share on social media