Unraveling the link between birth order and blood pressure: insights from a comprehensive systematic review and meta-analysis
Publication: FACETS
27 March 2025
Abstract
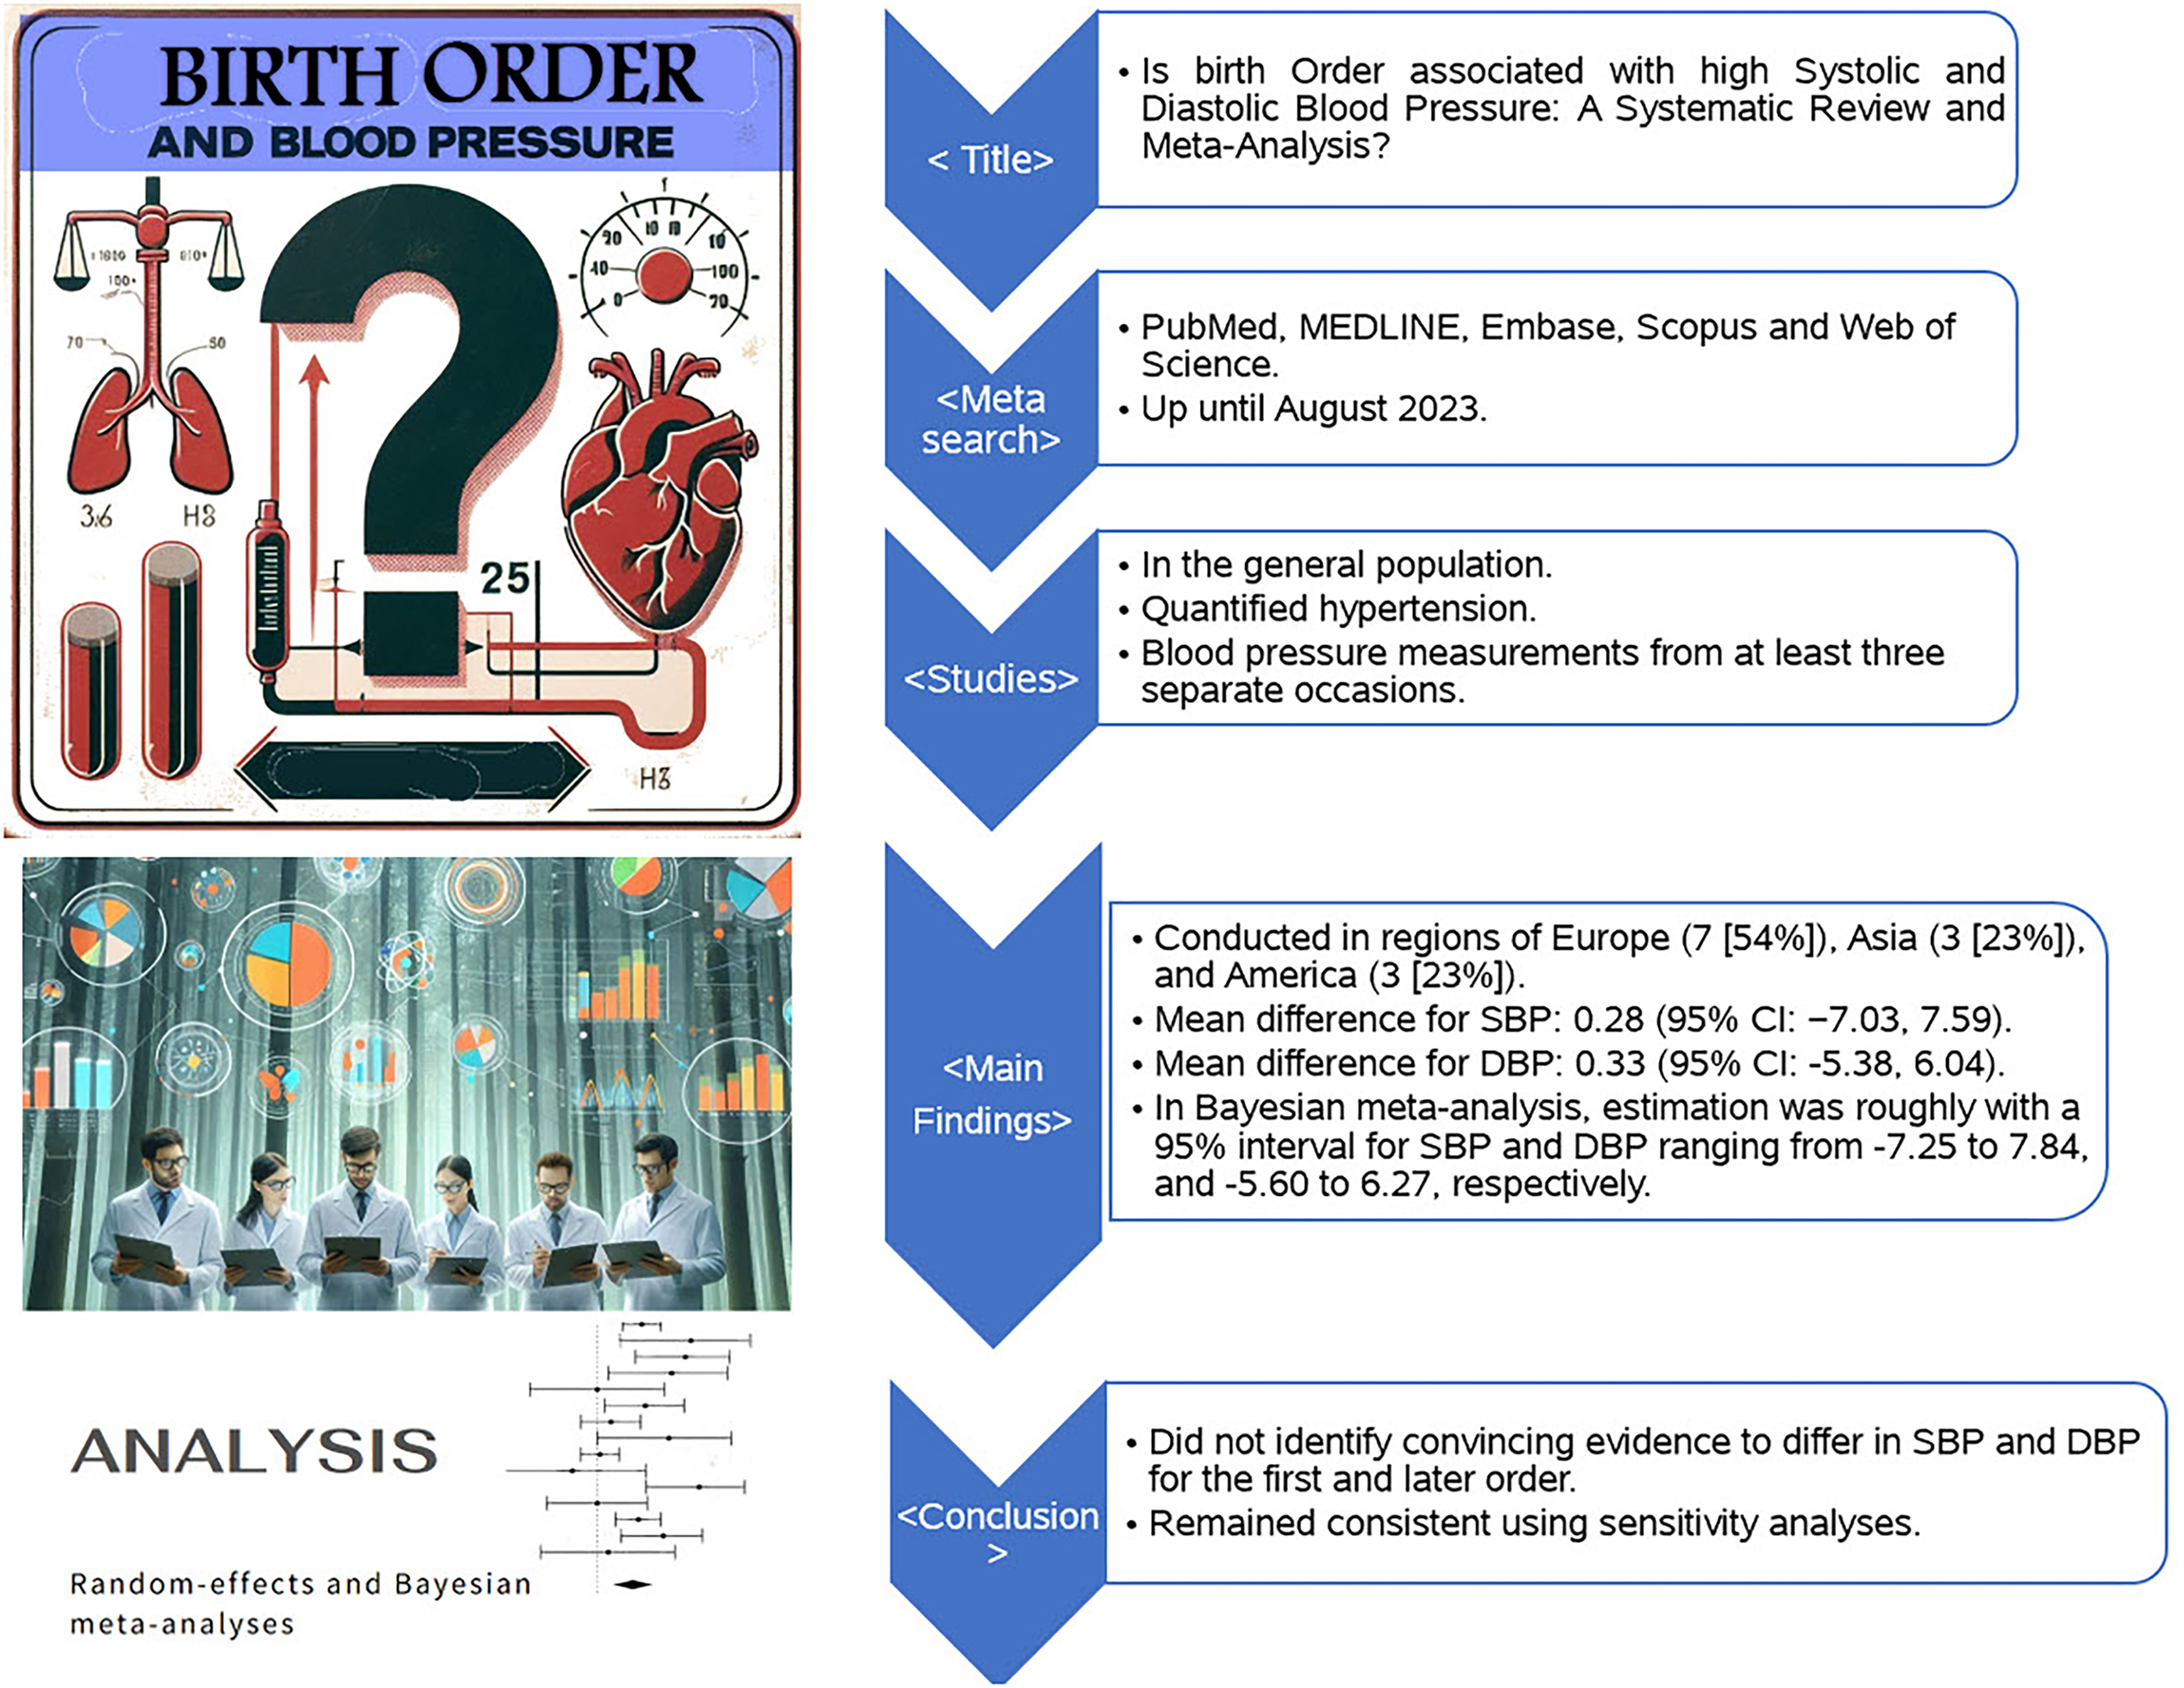
The objective of the present systematic review was to incorporate previous studies investigating the association of birth order with the risk of systolic and diastolic blood pressure (DBP). We employed random-effects and Bayesian meta-analyses, complemented by subgroup and sensitivity analyses, including funnel plots, Begg's rank correlation test, Egger's linear regression test, Galbraith plots, and leave-one-out meta-analysis. Of the 13 articles analyzed, 92% (12 articles) were published from 2010 onwards. The aggregate sample comprised 466 853 firstborns and 646 786 later-born individuals. Geographically, the studies were primarily conducted in Europe (54%), followed by Asia (23%), and America (23%). The pooled mean difference for systolic blood pressure (SBP) under a random-effects model was 0.28 mm Hg (95% CI: −7.03 to 7.59), and for DBP was 0.33 mm Hg (95% CI: −5.38 to 6.04), neither of which reached statistical significance (SBP: Z = 0.08, P = 0.939; DBP: Z = 0.11, P = 0.910). Sensitivity analyses supported these findings. Bayesian meta-analysis presented a 95% credible interval for SBP and DBP ranging from −7.25 to 7.84 and −5.60 to 6.27, respectively. The investigation found no substantial evidence of a significant difference in SBP and DBP between firstborns and later-born individuals, challenging the hypothesis that birth order significantly impacts blood pressure levels. ID registration number: 567971.
Graphical Abstract
1. Introduction
Hypertension is the leading cause of premature mortality worldwide, with an estimated prevalence of 20%–30% among adults with essential hypertension (Mills et al. 2020; Sabri et al. 2021; Zhou et al. 2021). The prevalence varies significantly across regions, with high-income countries demonstrating modest declines in hypertension rates while marked increases are observed in low- and middle-income countries (Mills et al. 2016; Zhou et al. 2017). In pediatric populations, hypertension predominantly presents as secondary hypertension, often a result of inadequate weight management and metabolic syndrome, while essential hypertension prevalence ranges from 4.7% to 19.4% (Kliegman et al. 2007; Sabri et al. 2021).
The last two decades have seen a pronounced rise in the prevalence of pediatric hypertension, driven by a complex interplay of physiological and environmental factors. Changes in family structure, such as the rise in single-child households, have been suggested as contributing factors to this trend (Zeng et al. 2013; Song et al. 2019). Pediatric hypertension, defined as blood pressure exceeding the 95th percentile for a child's height or weight, has been closely linked with the development of essential hypertension later in life and an increased risk of lifelong cardiovascular complications (Raitakari et al. 2003; Falkner and Daniels 2004; Kliegman et al. 2007; Sabri et al. 2021). Due to the significant associated risk for various cardiometabolic diseases—including heart failure, myocardial infarction, sudden cardiac death, cerebrovascular accidents, and chronic kidney disease—early detection through routine blood pressure screening from the age of three is advocated to improve management and outcomes (Kliegman et al. 2007).
In the ongoing exploration to unravel the etiologies and contributing factors of hypertension, considerable research has focused on environmental determinants. Among these, the impact of birth order on systolic and diastolic blood pressure (DBP) has been investigated; however, studies yield inconsistent outcomes. While Wells and Lawlor identified a propensity for firstborns to develop hypertension during childhood and early adolescence (Lawlor et al. 2004; Wells et al. 2011), other studies found no significant association between birth order and blood pressure levels (Jelenkovic et al. 2013; Howe et al. 2014).
Understanding the role of birth order, as a non-modifiable risk factor, is crucial for the precise evaluation of modifiable risk factors, through better recognition and estimation of risk factors effect sizes and subsequently, designing targeted interventions as necessary (Siervo et al. 2010). Despite many individual studies addressing this topic, systematic reviews and meta-analyses synthesizing the evidence base are lacking. This study aims to fully evaluate the relationship between birth order and blood pressure, to enhance our understanding of its significance, strength, and quality. Furthermore, identifying risk factors for adverse cardiovascular outcomes could provide hints toward early preventive strategies to slow disease progression. Thus, our research seeks to clarify the association between birth order and the risk of systolic and diastolic high blood pressure.
2. Materials and methods
2.1. Search strategy and selection criteria
This systematic review and meta-analysis was conducted in accordance with the Preferred Reporting Items for Systematic Reviews and Meta-Analyses (PRISMA) guidelines (Moher et al. 2009). The study protocol was not preregistered. We included all relevant research published up to December 2023. Two researchers (DH and AHK) independently performed a comprehensive literature search across PubMed, MEDLINE, Embase, Scopus, and Web of Science, employing a mix of search terms related to hypertension (e.g., “hypertension”, “high blood pressure”, “elevated blood pressure”) and “birth order”, prioritizing MeSH terms. Additionally, reference lists from identified articles were reviewed to capture further studies. There were no restrictions on language or publication date.
Inclusion criteria mandated that studies report on hypertension or its phenotypes (e.g., systolic, diastolic, isolated systolic, isolated diastolic, or systolic-diastolic hypertension) with clear definitions and methods for measuring blood pressure. Only research with blood pressure measurements taken on at least three separate occasions were considered to minimize overestimation. Duplicate studies were assessed, retaining those with either the most comprehensive results or the largest sample size. Titles and abstracts were initially screened by DH and AHK, followed by full-text reviews of selected articles. Discrepancies were resolved through discussion.
2.2. Data extraction and quality assessment
Data extraction was independently conducted by DH and AHK, gathering information on the title, authors, publication year, year of study (with imputed dates where necessary), location, study design, and sample size. The Strengthening the Reporting of Observational Studies in Epidemiology statement was utilized for quality assessment (INITIATIVE 2007).
2.3. Statistical analysis
Key characteristics of the included studies were summarized in a descriptive table. Quantitative synthesis was performed using STATA V.17 and the meta package in R 4.3.1, considering studies with comparable and homogenous data. Heterogeneity was assessed using the Q test, I2 statistic, and tau-squared statistic, with a random-effects model applied due to expected study differences (Borenstein 2023). This approach, recommended for its conservative nature, was particularly suited for analyses drawing solely from published literature.
We also executed a Bayesian approach for continuous outcome via bayesmeta package in R4.3.1 software due to small number of studies (Reis et al. 2023). For this purpose, bayesian method applied by half-cauchy prior (scale 10 for the heterogeneity), and let us assume a normal prior for centered around a mean of 0, with a standard deviation of 50 for the score differences in bayesmeta package (Röver 2020).
2.4. Subgroup meta-analysis
For study design, study location, and study population, we conducted subgroup meta-analyses to determine the potential sources of heterogeneity (Richardson et al. 2019). For this purpose, there should be at least three studies in each subgroup.
2.5. Sensitivity analysis
The potential publication bias was evaluated with a Funnel plot, Begg's rank test, and Egger's regression test, with p < 0.05 being represented as statistically significant (Lin and Chu 2018). Galbraith plot was used to detect the potential outliers, which lie farther away from the shaded regions (Anzures‐Cabrera and Higgins 2010). Moreover, a leave-one-out meta-analysis was performed to assess the influence of each study on the overall effect-size estimate and to specify influential studies (Hysong 2009).
3. Result
3.1. Study selection and characteristics
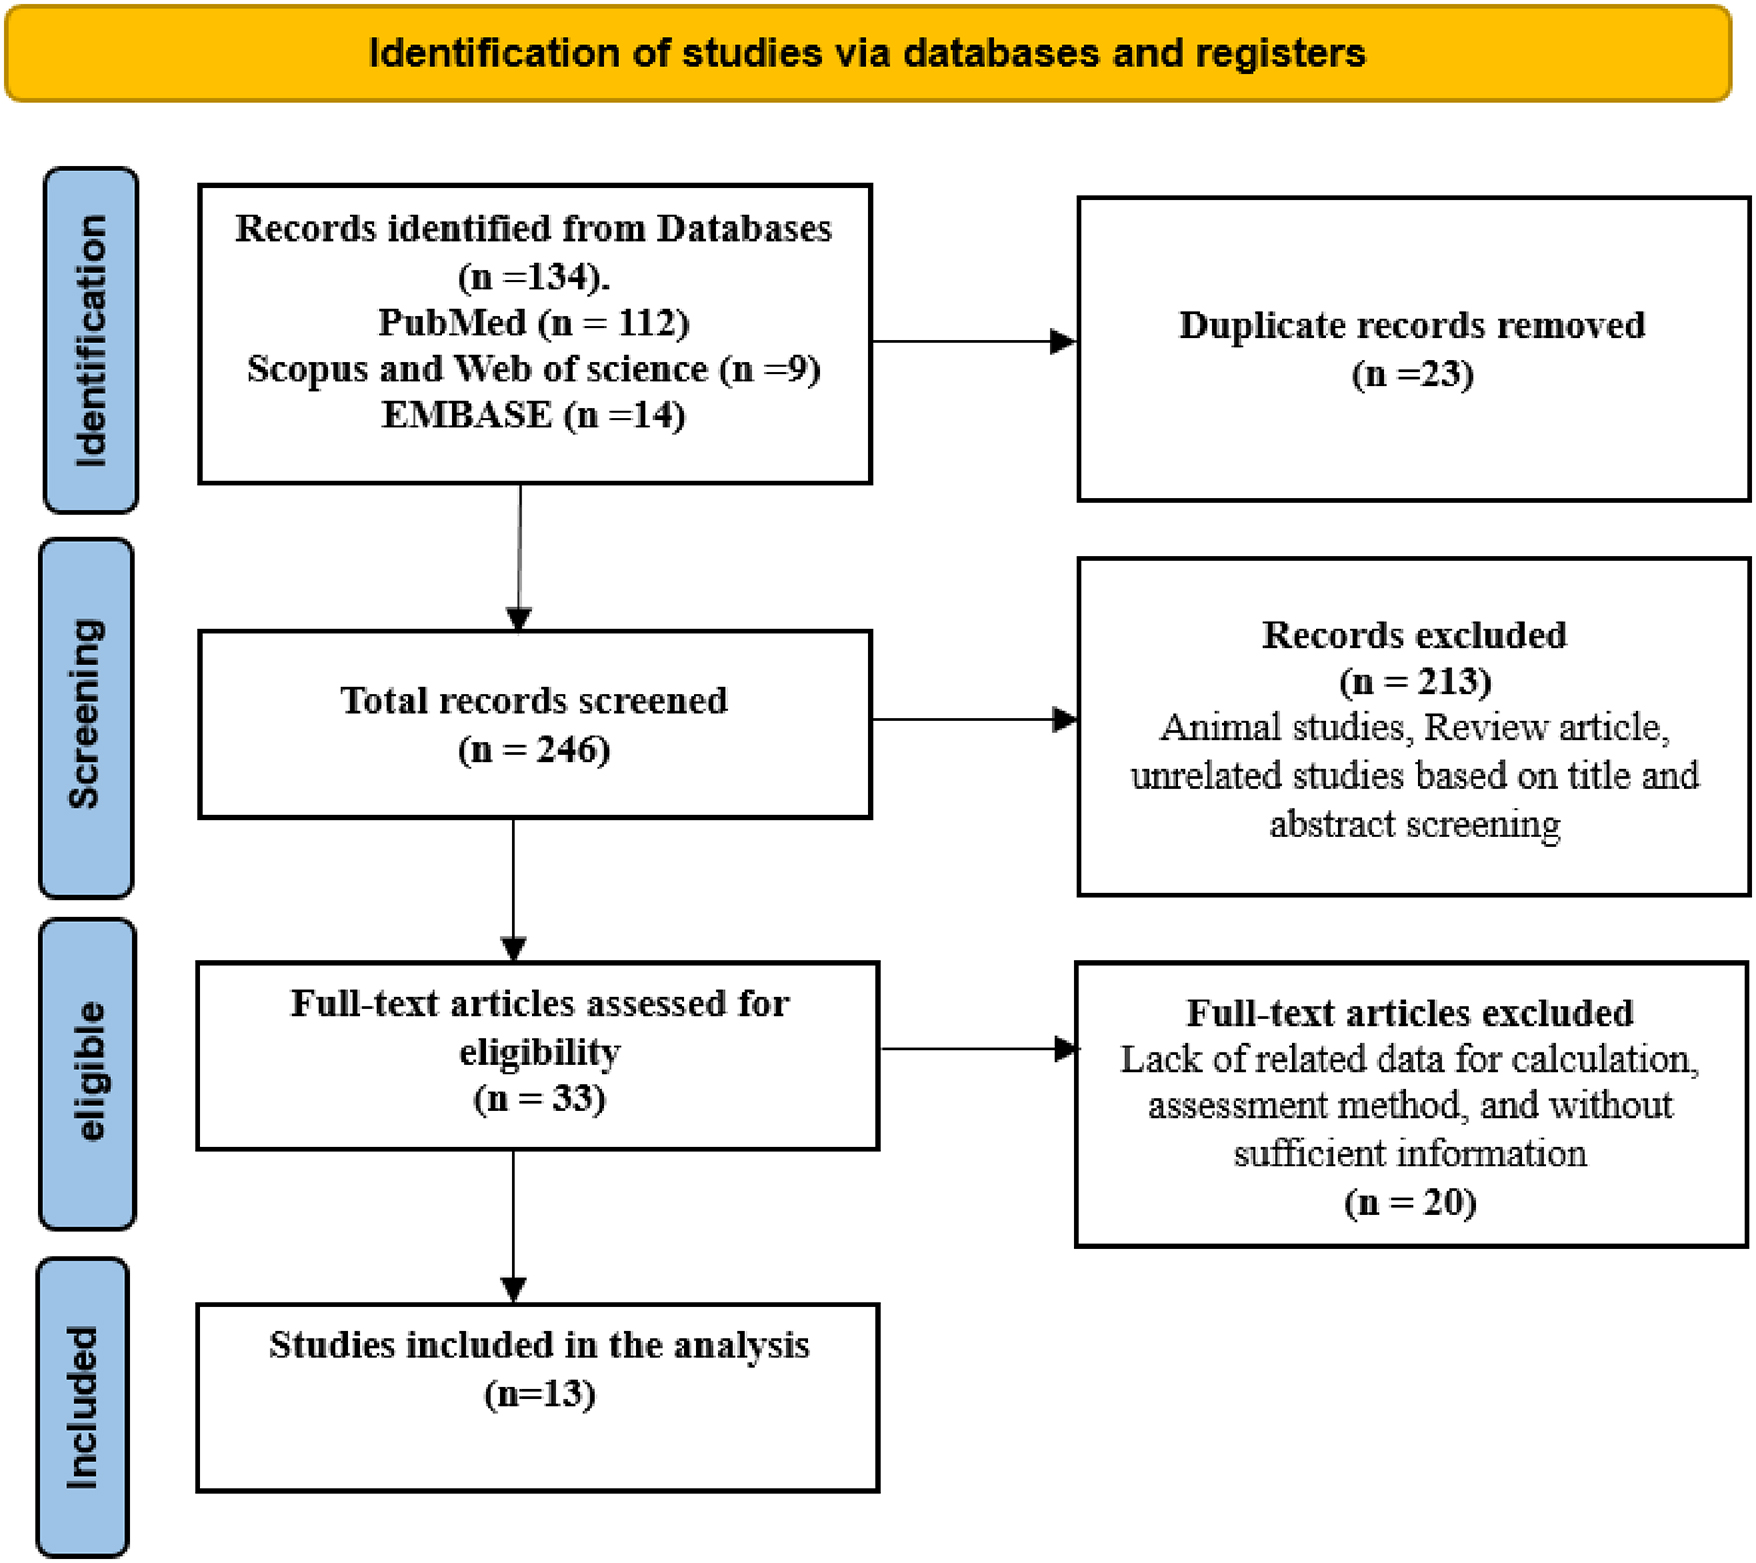
Our comprehensive literature search yielded 134 records. Inter-rater reliability for determining study relevance was assessed using Cohen's kappa statistic. The level of agreement between reviewers was substantial, with a kappa value of 0.86. After rigorous screening and application of eligibility criteria, 13 articles were selected for inclusion (Fig. 1), which provided data on systolic and diastolic blood pressure (Whincup et al. 1989; Siervo et al. 2010; Wells et al. 2011; Ayyavoo et al. 2013; Jelenkovic et al. 2013; Albert et al. 2014; Howe et al. 2014; Scheers Andersson et al. 2015; Kwok et al. 2016; Kelishadi et al. 2018; Aurpibul et al. 2021; Pihlman et al. 2021; Pantke et al. 2023). These studies, predominantly published from 2010 onwards, encompassed a combined sample size of 466 853 for firstborns and 646 786 for later-borns. Geographically, the studies were distributed across Europe (54%), Asia (23%), and America (23%). All included studies achieved a quality score of 6 or higher, indicating robust research methodologies (Supplementary Table S1).
Fig. 1.
3.2. Changes in systolic and diastolic blood pressure
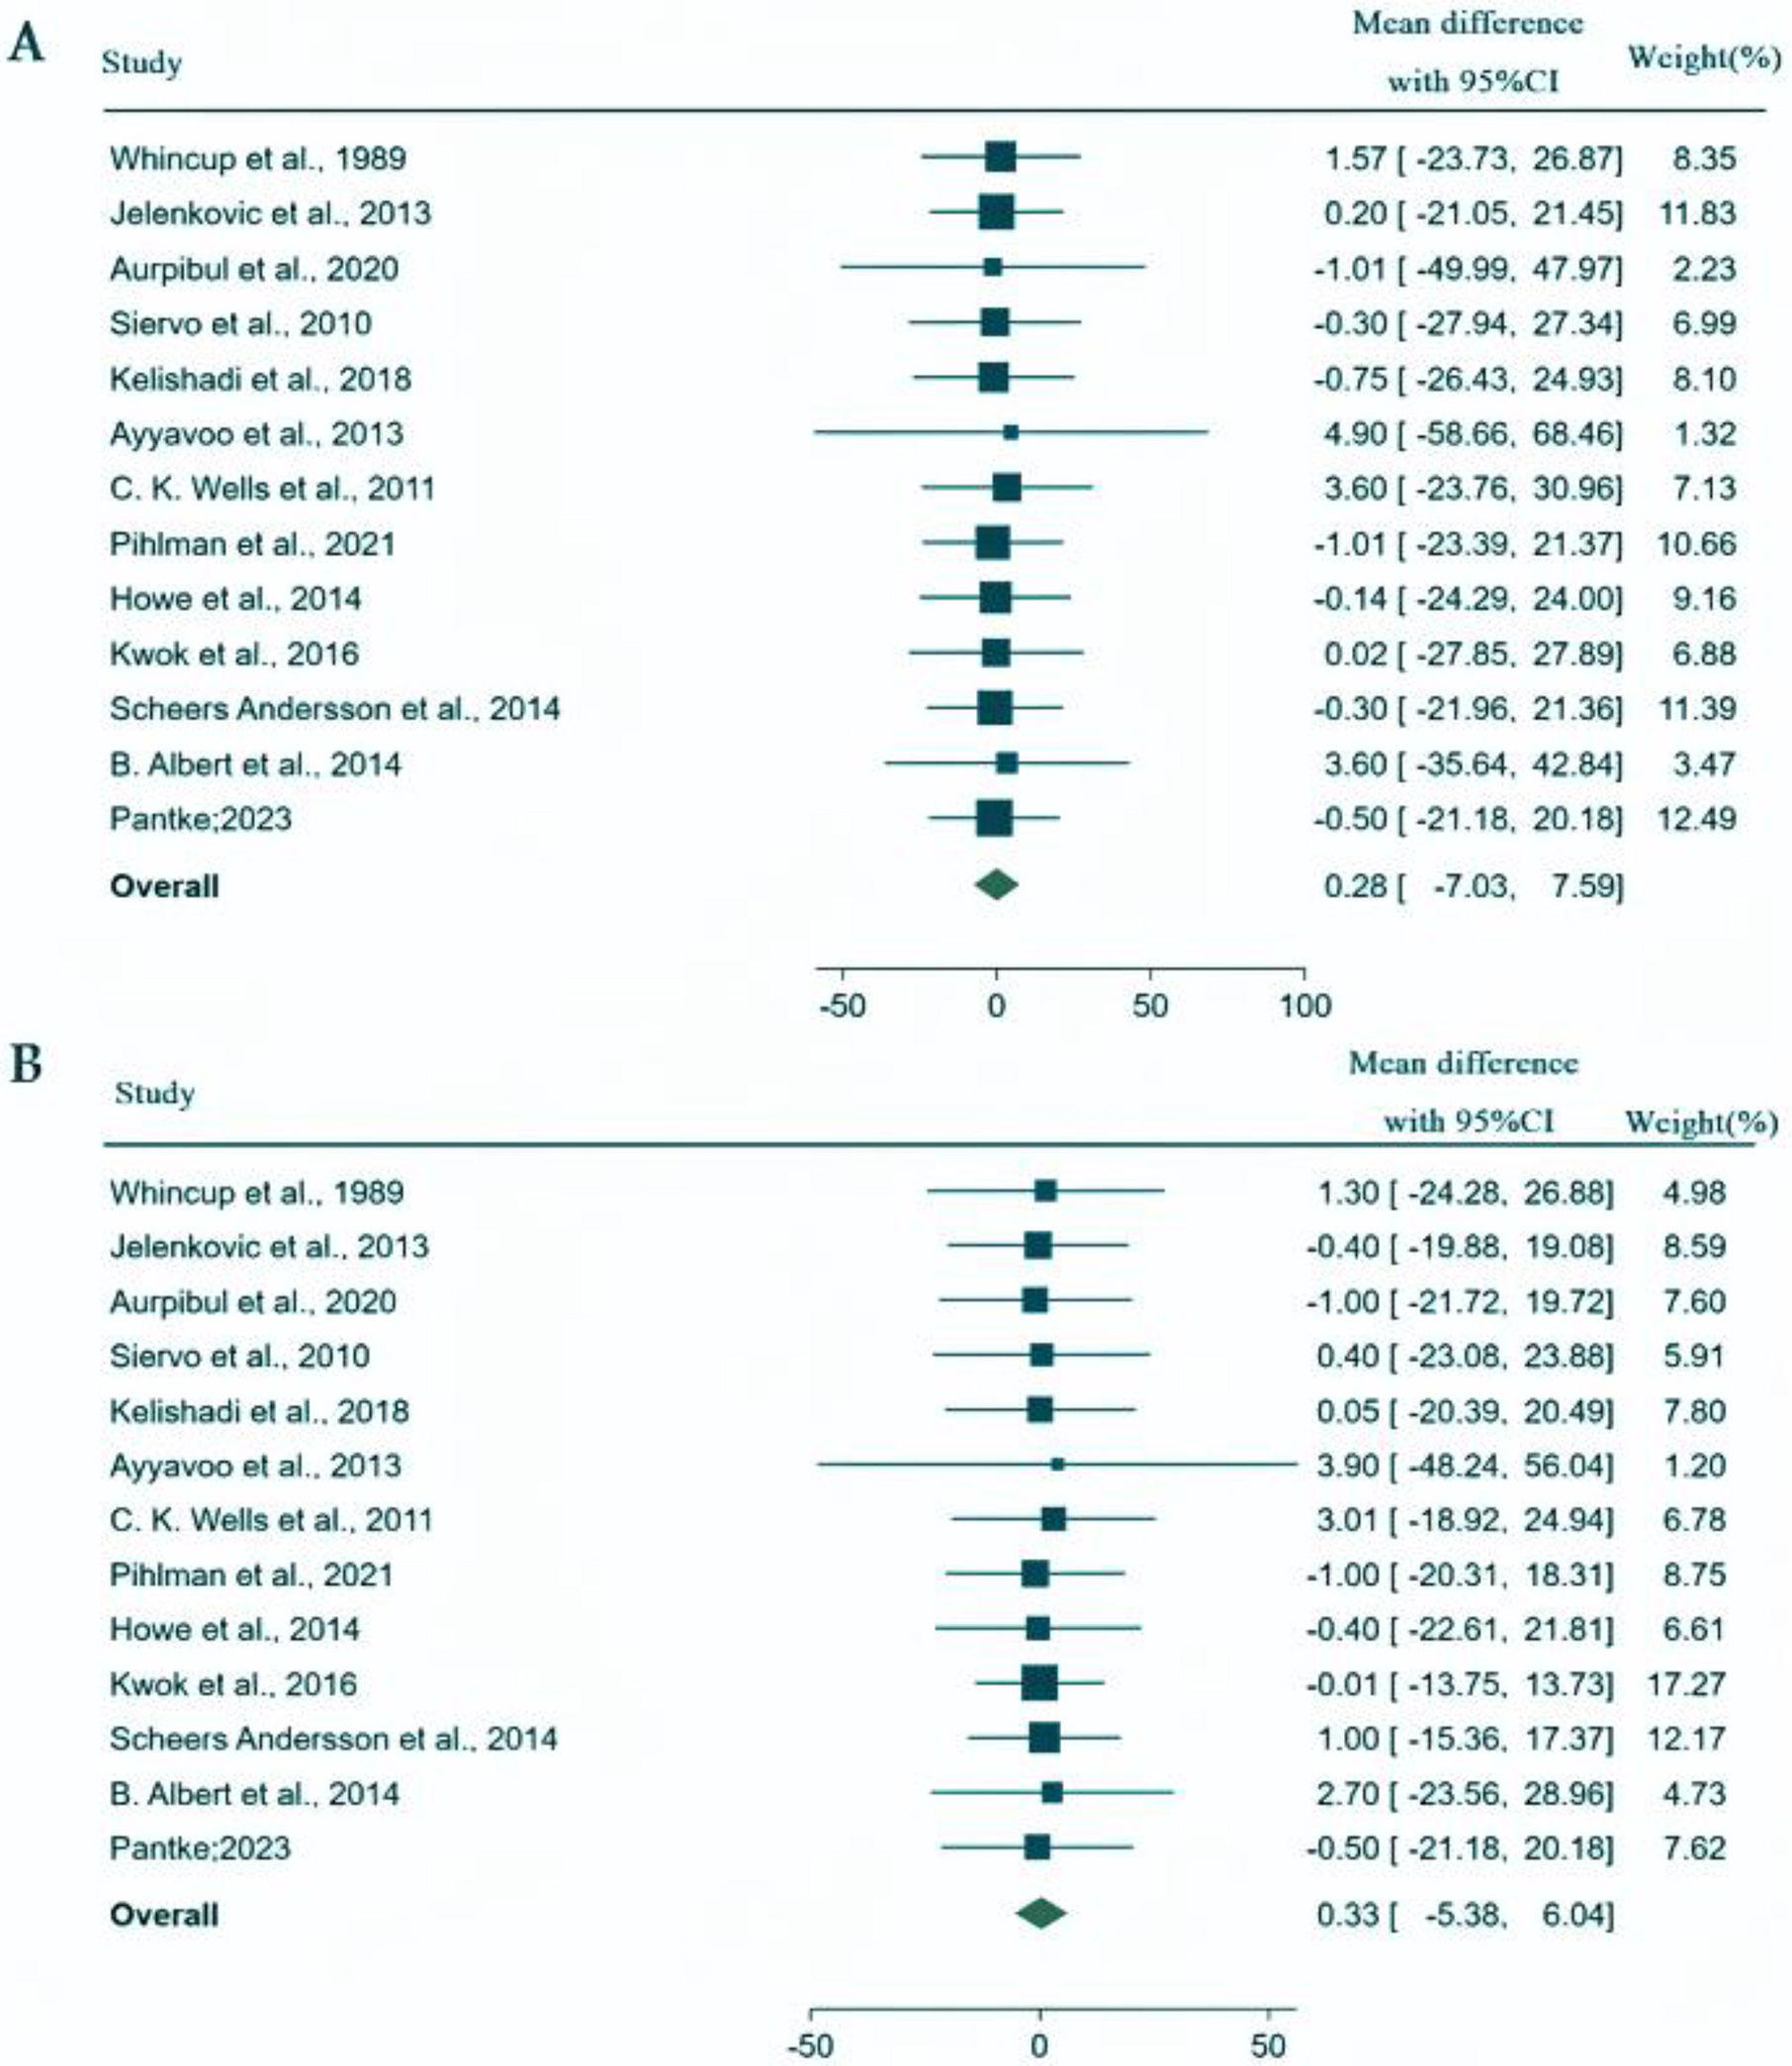
The range of sample sizes varied significantly across studies, with Albert et al. (Pihlman et al. 2021) reporting the smallest cohort and Jelenkovic et al. (2013) the largest. Heterogeneity tests revealed substantial variability for both systolic blood pressure (SBP) (Q = 66.42, P < 0.001; I2 = 96.34, 95% CI: 92.19, 99.24) and DBP (Q = 234.13, P < 0.001; I2 = 95.53, 95% CI: 90.65, 99.14). The pooled mean difference for SBP, calculated using a random-effects model, was 0.28 mm Hg (95% CI: −7.03 to 7.59), with no statistical significance (Z = 0.08, P = 0.939). Similarly, the pooled mean difference for DBP was 0.33 mm Hg (95% CI: −5.38 to 6.04), also lacking statistical significance (Z = 0.11, P = 0.910), suggesting no substantial evidence of difference in SBP and DBP between firstborns and later-borns (Fig. 2).
Fig. 2.
The Bayesian meta-analysis (Fig. 3) further supported these findings, displaying a 95% interval for SBP and DBP that ranged from −7.25 to 7.84 and −5.60 to 6.27, respectively, indicating considerable uncertainty around the effect sizes (Supplementary Figs. S13 and S14). The plot displays individual study estimates and their 95% confidence intervals. The effect sizes vary widely among studies, with some studies reporting high positive estimates while others show negative estimates. Notably, several studies have wide confidence intervals indicating a lack of precision due to small sample sizes or substantial variability within the data. The shrinkage estimates, indicated by diamonds, represent a Bayesian adjustment that shrinks individual study estimates toward the overall mean.
Fig. 3.
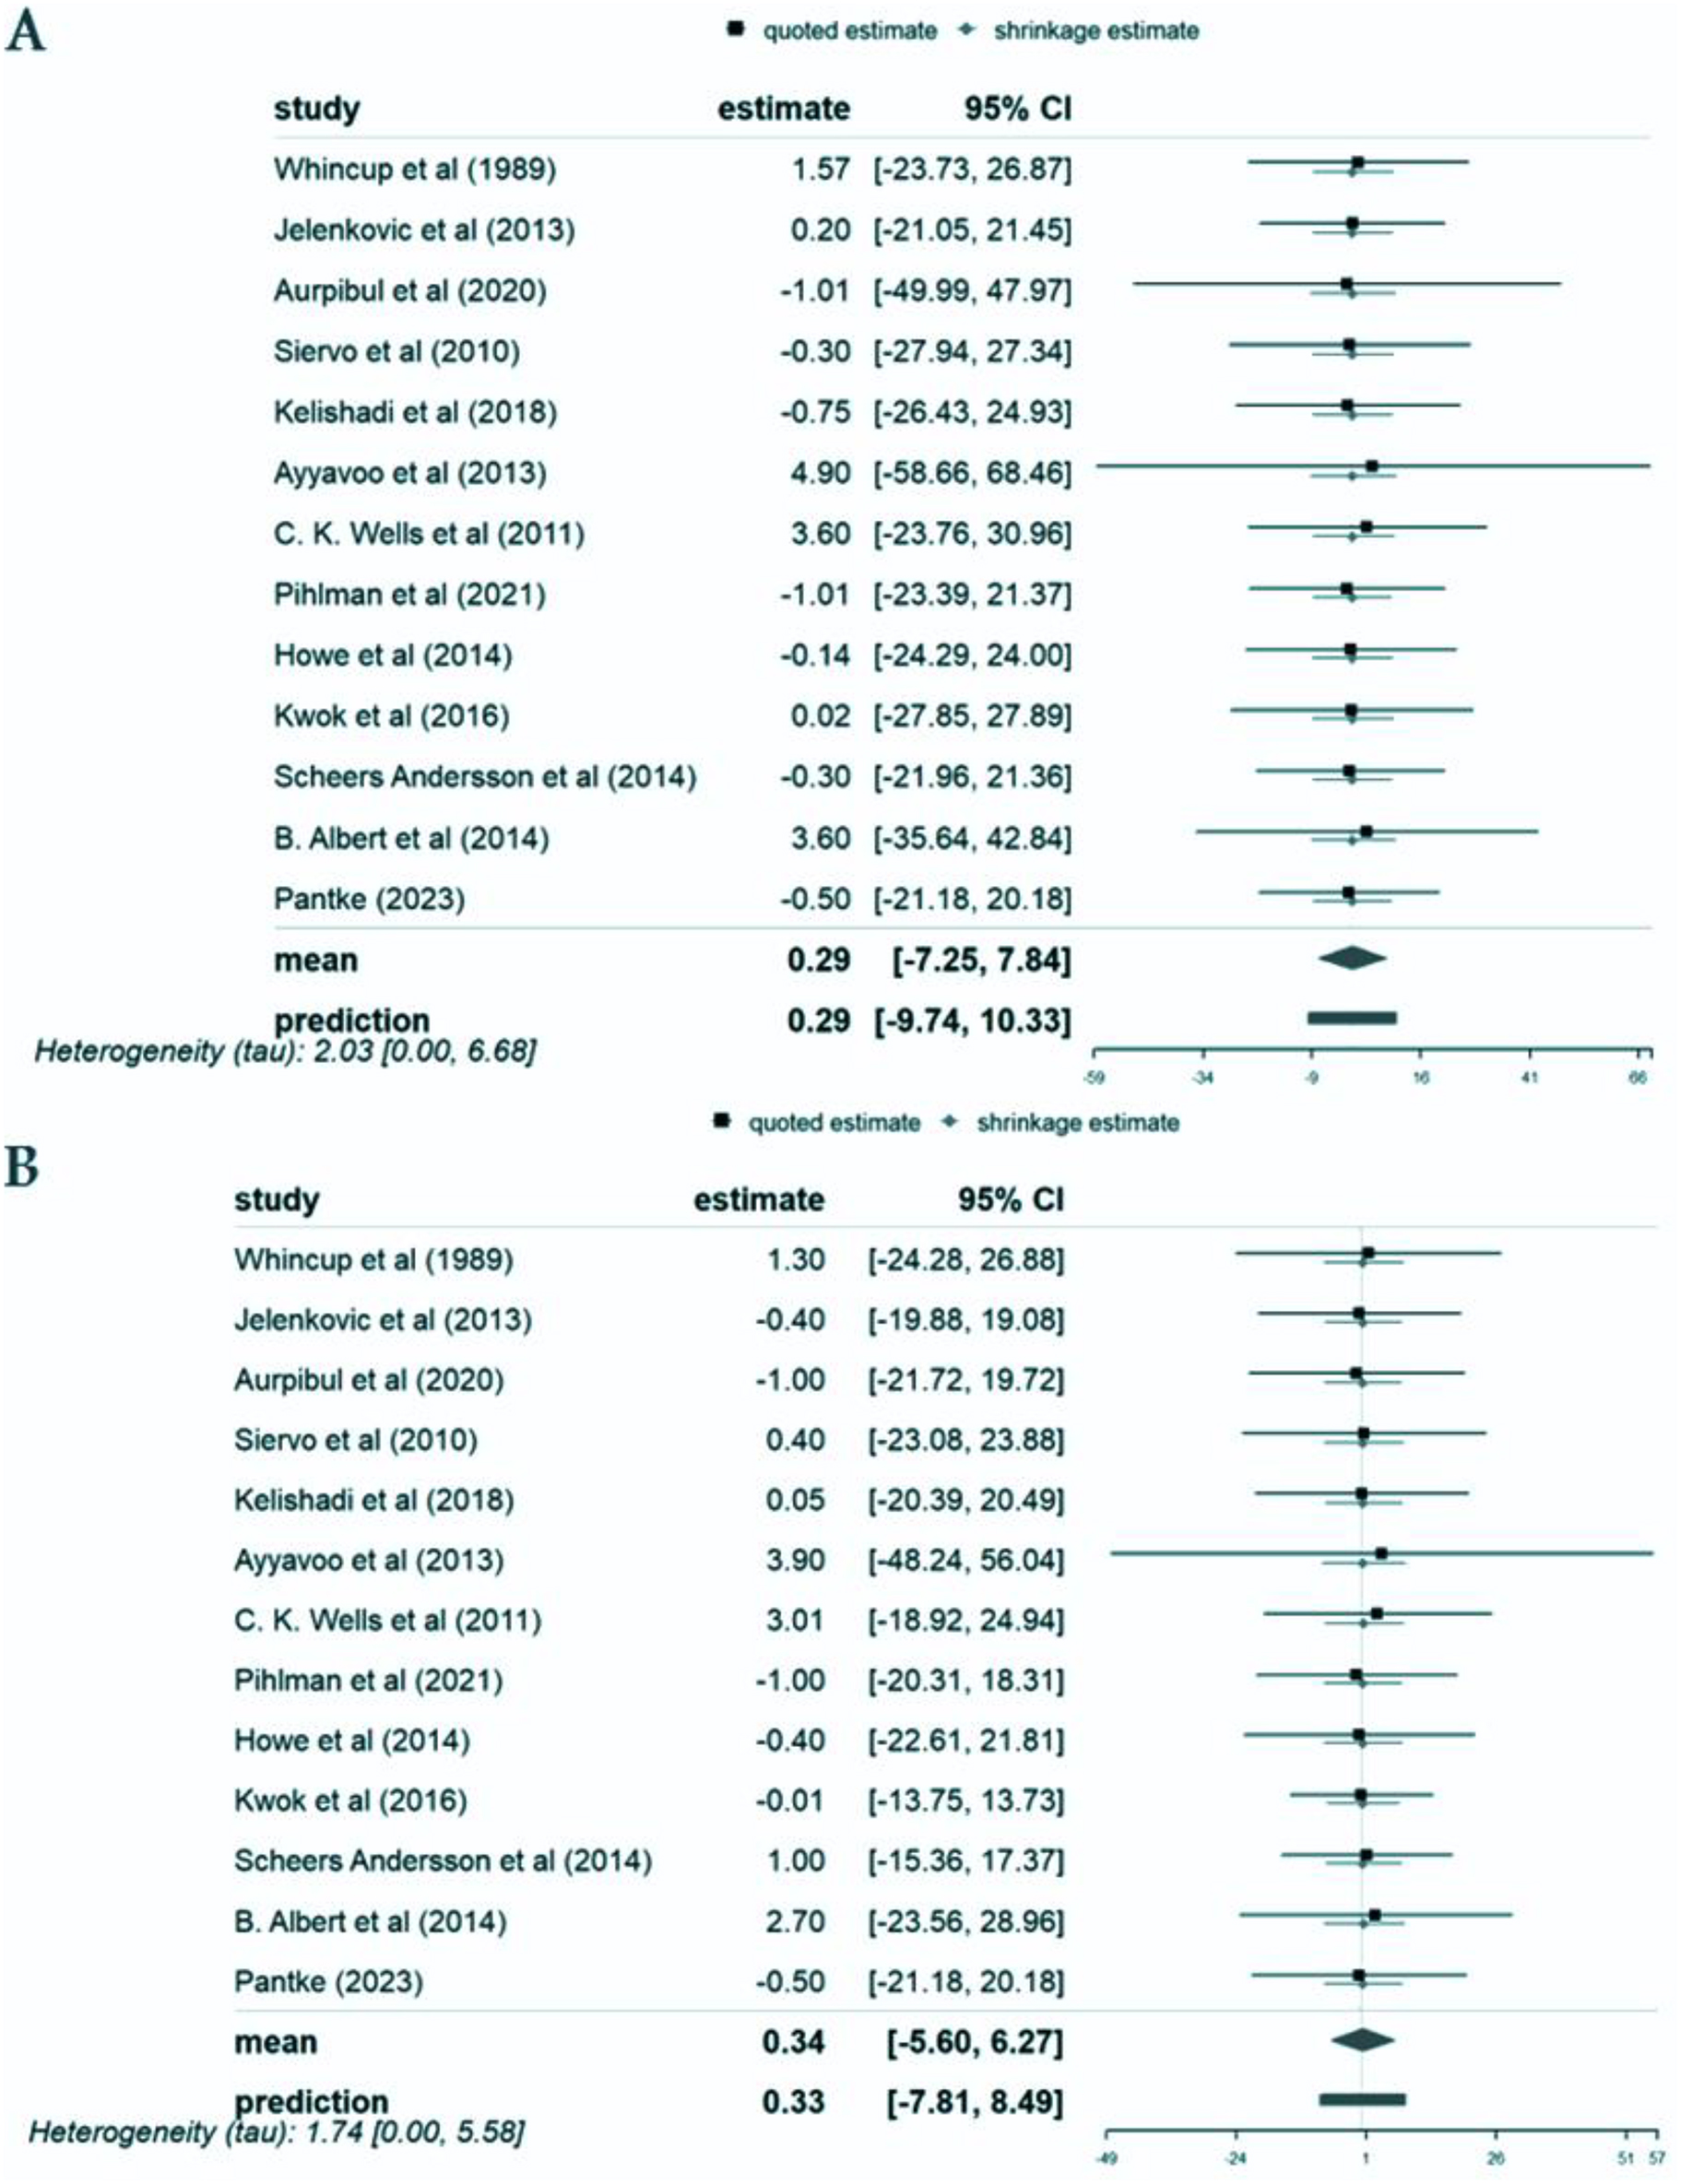
The mean effect size is represented by the diamond at the bottom of the plot. Importantly, the interval includes zero, indicating that the overall effect is not statistically significant. The wide credible interval reflects the uncertainty and variability across studies, making it challenging to draw a definitive conclusion about the true effect. The prediction interval provides an estimate of where the effect size of a future study might lie.
3.3. Subgroup analysis
Subgroup analyses were performed to explore potential sources of heterogeneity based on study design, location, and population. These analyses revealed no significant differences in SBP and DBP across different age groups (children, children + youth, youth) and geographic regions (America, Asia, Europe), as well as between cross-sectional and cohort studies. The effect sizes remained non-significant across these subgroups (Supplementary Figs. S1–S6).
3.4. Sensitivity analysis
The Galbraith plot did not identify any potential outliers for SBP and DBP (Supplementary Figs. S7 and S8). Leave-one-out analyses for SBP and DBP further confirmed the stability of our findings, with no single study unduly influencing the overall effect size estimates (Supplementary Figs. S9 and S10). Publication bias tests for SBP (Begg's test: P = 0.304, Egger's test: P = 0.864) and DBP (Begg's test: P = 0.09, Egger's test: P = 0.854) indicated no significant bias in the published literature (Supplementary Figs. S11 and S12).
4. Discussion
We conducted our analysis using data from these 13 studies carried out in Europe, Asia, and the Americas involving a total of 1113 639 participants, of which the populations were 1078 834 youth, 15 915 from pediatric populations and 18 890 participants from combined youth and pediatric populations. We found that the mean SBP and DBP mean differences between first-born and later-born individuals were 0.28 mm Hg (95% CI: −7.03, 7.59) and 0.33 mm Hg (95% CI: −5.38, 6.04), respectively. These mean differences did not represent a statistically significant effect. Similarly, analyses by patient populations, geographical locations, and study types showed no statistically significant differences in blood pressure about birth order.
To our knowledge, this study represents the first systematic review and meta-analysis examining the association between birth order and both systolic and diastolic blood pressure. Given the global rise in hypertension and obesity among young populations (Helen et al. 2013), understanding these associations is crucial for identifying early-life risk factors for cardiovascular diseases, major causes of mortality in industrialized nations (Gaziano 2007).
The relationship between birth order and cardiometabolic risk factors has been a subject of extensive investigation in recent years. Numerous meta-analyses and systematic reviews support the notion that birth order significantly influences risk factors such as obesity, dyslipidemia, diabetes (types 1 and 2), cardiovascular disease, and insulin resistance. Prior meta-analyses have identified a notable correlation between lower birth order and an increased risk of obesity, and suggested a protective effect of higher birth order against childhood-onset type 1 diabetes, especially in children under 5 years of age (Meller et al. 2018). Schooling CM et al.’s findings further indicate that birth order may influence developmental patterns with lasting health implications (Meller et al. 2018).
Contrary to expectations and existing hypotheses, our findings do not support a significant impact of birth order on systolic and diastolic blood pressure. This aligns with the work of Jonathan C. K. Wells et al. (Gaziano 2007), which, despite initial observations of higher systolic blood pressure in firstborns among adolescents, found no statistically significant association after adjusting for relevant maternal and child factors. Conversely, studies by (Ayyavoo et al. 2013) and others have reported associations between birth order and increased blood pressure, suggesting a potential risk of hypertension and cardiovascular diseases later in life.
Laura D. Howe and colleagues' exploration of birth order and cardiometabolic risk factors revealed weak and inconsistent associations, further complicating the narrative. Their research speculates on the influence of prenatal and postnatal environmental differences between first-born and later-born children, which could affect cardiovascular and metabolic system development, thus influencing blood pressure and body composition in later life (Howe et al. 2014).
First-born children's exposure to a restricted nutrient supply during intrauterine growth due to the structural properties of the uterine spiral arteries is hypothesized to contribute to lower birth weights and, consequently, a higher risk of hypertension (Valdés-Ramos et al. 2002; Ayyavoo et al. 2013; Kwok et al. 2016; Pantke et al. 2023). This phenomenon, coupled with impaired glucose metabolism and reduced insulin sensitivity known as the thrifty phenotype hypothesis, underscores the complex interplay of physiological and environmental factors in the development of hypertension (Siervo et al. 2010; Pihlman et al. 2021).
The association between birth order and various cardiometabolic risk factors has been a point of controversy. Differences have been reported in outcomes like weight, obesity, and hypertension between first-born opposed to later-born offspring. Hypertension is a well-established cardiometabolic risk factor, establishing that essential hypertension accounts for nearly 95% of adult populations (Carretero and Oparil 2000). Therefore, a better understanding of the factors contributing to the development of hypertension or influencing blood pressure is fundamental in enhancing the effectiveness of prevention and treatment strategies. Among these factors, the role of birth order as a non-modifiable risk factor has been an issue of great interest (Ghandi et al. 2018). A better understanding of how birth order contributes to blood pressure could go a long way in unraveling the tangled threads between modifiable risk factors and hypertension, sharpening our capacity to prevent and manage this rampant condition and enabling us to provide more individualized recommendations in clinical settings.
For clinicians, these findings provide reassurance that birth order should not be considered a significant risk factor for hypertension or blood pressure abnormalities. Other established risk factors, such as age, obesity, physical activity, smoking, diet, and genetic predispositions, should remain the primary focus in assessing and managing blood pressure. Clinicians can be confident that while birth order might influence other developmental aspects (e.g., academic achievement, personality), it does not play a major role in determining blood pressure levels. This allows for more targeted interventions focusing on modifiable lifestyle factors, rather than unnecessary concern about birth order in cardiovascular health assessments. The clinical takeaway from this study is that birth order does not appear to influence systolic or diastolic blood pressure in a clinically significant manner. Clinicians should not consider birth order as an important factor when assessing a patient's risk for high blood pressure or cardiovascular disease. Instead, emphasis should remain on well-established risk factors that have a clear and substantial impact on blood pressure regulation.
Several limitations need to be addressed when interpreting this study's results. First, we could not measure family size or age gaps between siblings, which might impact the relationship between birth order and cardiometabolic risk factors. Secondly, parenting styles and children's use of technology have changed considerably over the past two decades, and these changes may alter the dynamics between parents and children and the potential impact of birth order on those dynamics. These factors may not be sufficiently captured in the present study. Another important factor known to contribute to the cardiometabolic risk profile is prematurity. Unfortunately, none of the studies included had data available on the prematurity status of participants. Sex is a well-known determinant of cardiometabolic risk profile; unfortunately, none of the studies reported results by gender. Therefore, this important variable could not be included in our analysis.
Although observational studies generally provide less convincing evidence than randomized controlled trials, we evaluated the methodological quality of the studies included in this meta-analysis. However, the fact that our study is based on thirteen published studies limits its external validity and generalizability. In addition, it was not stated whether the included studies distinguished between essential (primary) and secondary hypertension: this may affect the accuracy or the interpretation of outcomes.
Considering the gaps within the current literature, future studies should focus on a comprehensive evaluation of the differences between the cardiometabolic profiles associated with first-born and later-born children through adolescence to adulthood. Such studies should include factors such as age gap, sex, underlying diseases, physical activity, nutritional habits, and psychiatric profiles. In this way, more definitive results can be obtained better to understand modifiable and non-modifiable risk factors of cardiometabolic health, enabling more accurate recommendations regarding clinical practice.
5. Conclusion
In conclusion, our findings did not identify convincing evidence to differ in SBP and DBP for the first and later order. Moreover, these results did not differ among continents, study types, and range of ages. These findings remained consistent using different sensitivity analyses.
Acknowledgment
We want to acknowledge the research that made summary data available.
References
Adolescents NHBPEPWG on HBP in C and. 2004. The fourth report on the diagnosis, evaluation, and treatment of high blood pressure in children and adolescents. Pediatrics, 114(Supplement_2): 555–576.
Albert B.B., De Bock M., Derraik J.G.B., Brennan C.M., Biggs J.B., Hofman P.L., Cutfield W.S. 2014. Among overweight middle-aged men, first-borns have lower insulin sensitivity than second-borns. Scientific Reports, 4(1): 3906.
Anzures‐Cabrera J., Higgins J.P.T. 2010. Graphical displays for meta-analysis: an overview with suggestions for practice. Research Synthesis Methods, 1(1): 66–80.
Aurpibul L., Butler É.M., Wongthanee A., Rerkasem A., Pruenglampoo S., Mangklabruks A., et al. 2021. Birth order is associated with an increased risk of obesity in young adults in Thailand. Journal of Epidemiology and Community Health, 75(3): 305–308.
Ayyavoo A., Savage T., Derraik J.G.B., Hofman P.L., Cutfield W.S. 2013. First-born children have reduced insulin sensitivity and higher daytime blood pressure compared to later-born children. The Journal of Clinical Endocrinology and Metabolism, 98(3): 1248–1253.
Borenstein M. 2023. How to understand and report heterogeneity in a meta-analysis: the difference between I-squared and prediction intervals. Integrative Medicine Research, 12, 101014.
Carretero O.A., Oparil S. 2000. Essential hypertension: part I: definition and etiology. Circulation, 101(3): 329–335.
Falkner B., Daniels S.R. 2004. Summary of the fourth report on the diagnosis, evaluation, and treatment of high blood pressure in children and adolescents. Hypertension, 44(4): 387–388.
Gaziano T.A. 2007. Reducing the growing burden of cardiovascular disease in the developing world. Health Affairs, 26(1): 13–24.
Ghandi Y., Habibi D., Farahani E. 2018. Reference values of longitudinal systolic right and left ventricular function measured by M-mode echocardiography in healthy preterm and term neonates. Journal of Cardiovascular Echography, 177, 28(3).
Helen S., Jose T.T., Nayak A.K. 2013. A correlational study on blood pressure, stress and body mass index (BMI) among Bsc nursing students in A selected college of nursing udupi district. Journal of Health and Allied Sciences NU, 3(03): 3–7.
Howe L.D., Hallal P.C., Matijasevich A., Wells J.C., Santos I.S., Barros A.J.D., et al. 2014. The association of birth order with later body mass index and blood pressure: a comparison between prospective cohort studies from the United Kingdom and Brazil. International Journal of Obesity, 38(7): 973–979.
Hysong S.J. 2009. Meta-analysis: audit and feedback features impact effectiveness on care quality. Medical Care, 47(3): 356–363.
INITIATIVE S. 2007. The strengthening the reporting of observational studies in epidemiology (STROBE) statement. Epidemiology (Cambridge, Mass.), 18(6): 800–804.
Jelenkovic A., Silventoinen K., Tynelius P., Myrskylä M., Rasmussen F. 2013. Association of birth order with cardiovascular disease risk factors in young adulthood: a study of one million Swedish men. PLoS ONE, 8(5): e63361.
Kelishadi R., Qorbani M., Rezaei F., Motlagh M.E., Djalalinia S., Ziaodini H., et al. 2018. Is single-child family associated with cardio-metabolic risk factors: the CASPIAN-V study. BMC Cardiovascular Disorders, 18: 1–8.
Kliegman R.M., Behrman R.E., Jenson H.B., Stanton B.M.D. 2007. Nelson textbook of pediatrics e-book. Elsevier Health Sciences.
Kwok M.K., Leung G.M., Schooling C.M. 2016. Associations of birth order with early adolescent growth, pubertal onset, blood pressure and size: evidence from Hong Kong's “Children of 1997” birth cohort. PLoS ONE, 11(4): e0153787.
Lawlor D.A., Najman J.M., Sterne J., Williams G.M., Ebrahim S., Smith G.D. 2004. Associations of parental, birth, and early life characteristics with systolic blood pressure at 5 years of age: findings from the Mater-University study of pregnancy and its outcomes.Circulation, 110(16): 2417–2423.
Lin L., Chu H. 2018. Quantifying publication bias in meta-analysis. Biometrics, 74(3): 785–794.
Meller F.O., Loret de Mola C., Assunção M.C.F., Schäfer A.A., Dahly D.L., Barros F.C. 2018. Birth order and number of siblings and their association with overweight and obesity: a systematic review and meta-analysis. Nutrition Reviews, 76(2): 117–124.
Mills K.T., Bundy J.D., Kelly T.N., Reed J.E., Kearney P.M., Reynolds K., et al. 2016. Global disparities of hypertension prevalence and control: a systematic analysis of population-based studies from 90 countries. Circulation, 134(6): 441–450.
Mills K.T., Stefanescu A., He J. 2020. The global epidemiology of hypertension. Nature Reviews Nephrology, 16(4): 223–237.
Moher D., Liberati A., Tetzlaff J., Altman D.G. 2009. Reprint—preferred reporting items for systematic reviews and meta-analyses: the PRISMA statement. Physical Therapy, 89(9): 873–880.
Pantke P.M., Herrmann-Lingen C., Rothenberger A., Poustka L., Meyer T. 2023. Is only-child status associated with a higher blood pressure in adolescence? An observational study. European Journal of Pediatrics, 182(3): 1377–1384.
Pihlman J., Magnussen C.G., Rovio S.P., Pahkala K., Jokinen E., Laitinen T.P., et al. 2021. Association between number of siblings and cardiovascular risk factors in childhood and in adulthood: the cardiovascular risk in young Finns study. The Journal of Pediatrics, 237: 87–95.e1.
Raitakari O.T., Juonala M., Kähönen M., Taittonen L., Laitinen T., Mäki-Torkko N., et al. 2003. Cardiovascular risk factors in childhood and carotid artery intima-media thickness in adulthood: the Cardiovascular Risk in Young Finns Study. JAMA, 290(17): 2277–2283.
Reis D.J., Kaizer A.M., Kinney A.R., Bahraini N.H., Holliday R., Forster J.E., Brenner L.A. 2023. A practical guide to random-effects Bayesian meta-analyses with application to the psychological trauma and suicide literature. Psychological Trauma: Theory, Research, Practice, and Policy, 15(1): 121.
Richardson M., Garner P., Donegan S. 2019. Interpretation of subgroup analyses in systematic reviews: a tutorial. Clinical Epidemiology and Global Health, 7(2): 192–198.
Röver C. 2020. Bayesian random-effects meta-analysis using the bayesmeta R Package. Journal of Statistical Software, 93: 1–51.
Sabri M.R., Habibi D., Ramezaninezhad D., Ghazavi R., Gheissari A., Mohammadifard N., et al. 2021. The associations of low birth weight with primary hypertension in later life: a systematic review and meta-analysis. Journal of Research in Medical Sciences, 26: 33.
Scheers Andersson E., Tynelius P., Nohr E.A., Sørensen T.I.A., Rasmussen F. 2015. No association of maternal gestational weight gain with offspring blood pressure and hypertension at age 18 years in male sibling-pairs: a prospective register-based cohort study. PLoS ONE, 10(3): e0121202.
Siervo M., Horta B.L., Stephan B.C.M., Victora C.G., Wells J.C.K. 2010. First-borns carry a higher metabolic risk in early adulthood: evidence from a prospective cohort study. PLoS ONE, 5(11): e13907.
Song P., Zhang Y., Yu J., Zha M., Zhu Y., Rahimi K., Rudan I. 2019. Global prevalence of hypertension in children: a systematic review and meta-analysis. JAMA Pediatrics, 173(12): 1154–1163.
Valdés-Ramos R., Villarreal-López L., Kaufer-Horwitz M., Barrera-Reyes R., Fernández-Carrocera L.A., Caraveo-Enrıquez V., Ávila-Rosas H. 2002. Association of anthropometric birth measurements and blood pressure in the first year of life. Nutrition Research, 22(1–2): 39–44.
Wells J.C.K., Hallal P.C., Reichert F.F., Dumith S.C., Menezes A.M., Victora C.G. 2011. Associations of birth order with early growth and adolescent height, body composition, and blood pressure: prospective birth cohort from Brazil. American Journal of Epidemiology, 174(9): 1028–1035.
Whincup P.H., Cook D.G., Shaper A.G. 1989. Early influences on blood pressure: a study of children aged 5-7 years. Bmj, 299(6699): 587–591.
Zeng W., Undurraga E.A., Nyberg C., Eisenberg D.T.A., Parida S., Zycherman A., et al. 2013. Sibling composition during childhood and adult blood pressure among native Amazonians in Bolivia. Economics and Human Biology, 11(3): 391–400.
Zhou B., Bentham J., Di Cesare M., Bixby H., Danaei G., Cowan M.J., et al. 2017. Worldwide trends in blood pressure from 1975 to 2015: a pooled analysis of 1479 population-based measurement studies with 19·1 million participants. The Lancet, 389(10064): 37–55.
Zhou B., Perel P., Mensah G.A., Ezzati M. 2021. Global epidemiology, health burden and effective interventions for elevated blood pressure and hypertension. Nature Reviews Cardiology, 18(11): 785–802.
Supplementary material
Supplementary Material 1 (DOCX / 2.17 MB).
- Download
- 2.18 MB
Information & Authors
Information
Published In
FACETS
Volume 10 • 2025
Pages: 1 - 8
Editors: Vance L Trudeau and Jian Liu
History
Received: 18 July 2024
Accepted: 14 January 2025
Version of record online: 27 March 2025
Copyright
© 2025 The Author(s). This work is licensed under a Creative Commons Attribution 4.0 International License (CC BY 4.0), which permits unrestricted use, distribution, and reproduction in any medium, provided the original author(s) and source are credited.
Data Availability Statement
None.
Key Words
Sections
Subjects
Plain Language Summary
Does Birth Order Affect Blood Pressure?
Authors
Author Contributions
Conceptualization: MM
Data curation: HRM, MM
Formal analysis: DH, MA
Investigation: AHK, MM
Methodology: DH, MM
Project administration: HRM, RK
Resources: AHK
Software: DH, HRM, MA, MM
Writing – original draft: DH, AHK
Writing – review & editing: HRM, Hm, HM, MM, MA, MM, MÁM, RK
Competing Interests
The authors declare no conflicts of interest.
Metrics & Citations
Metrics
Other Metrics
Citations
Cite As
Danial Habibi, Amir Hossein Koochekian, Hamid Reza Marateb, Homayoon masoudi, Hanifeh Mirtavoos-Mahyari, Muhammadhosein Moradi, Mahdi Akbarzadeh, Marjan Mansourian, Miguel Ángel Mañanas, and Roya Kelishadi. 2025. Unraveling the link between birth order and blood pressure: insights from a comprehensive systematic review and meta-analysis. FACETS.
10: 1-8.
https://doi.org/10.1139/facets-2024-0141
Export Citations
If you have the appropriate software installed, you can download article citation data to the citation manager of your choice. Simply select your manager software from the list below and click Download.
There are no citations for this item