Open access

A novel morphometry-based method for assessing maturity in male Tanner crab, Chionoecetes bairdi

Publication: FACETS
22 December 2022

Abstract

Accurate classification of maturity status and estimation of size at 50% maturity for male crabs are important to the management of North Pacific crab stocks, which form the basis of several economically valuable fisheries. We demonstrate a straightforward maturity classification approach applied to male Tanner crabs (Chionoecetes bairdi), based on the use of log-transformed chela height distributions calculated via kernel density functions. The linear equation defining the relationship between the minima of these chela height distributions, and the midpoint of the corresponding carapace width bins is then used to estimate the incidence of maturity by size group across the population. We demonstrate the performance of this approach relative to two other currently applied methodologies. Finally, we apply this method to assess annual size at 50% maturity in eastern Bering Sea male Tanner crabs, and spatiotemporal trends in this parameter. We demonstrate the existence of high interannual and spatial variability in this population metric and find evidence of a decline in size at maturity in the western stock.

Introduction

The eastern Bering Sea stock of southern Tanner crab, Chionoecetes bairdi, supports a regionally important fishery targeting mature males based on size-based criteria, and is managed in part based on estimated male mature biomass (Zheng and Pengilly 2011). Estimating male maturity at size, which may vary due to endogenous and exogenous factors (Somerton 1981; Otto and Pengilly 2002; Burmeister and Sainte-Marie 2010; Siddon and Bednarski 2010), is thus important for effective fishery management.
Physiological definitions of maturity are unlikely to be useful in this context. While male Tanner crabs may become physiologically mature, and begin producing spermatophores at a carapace width (CW) of 50–60 mm, functional maturity, when a crab is actually able to successfully complete the mating act, generally occurs at larger carapace sizes (>60 mm; Adams 1982; Paul et al. 1983; Stevens et al. 1993). This disconnect between physiological and functional maturity means that any index based on physiological maturity would likely overestimate reproductive potential.
Male Chionoecetes spp. crabs become functionally mature upon passing through a second maturity event subsequent to attaining physiological maturity (Conan and Comeau 1986). This consists of a terminal molt to a morphometrically mature state, characterized by a greater chela height (CH) to CW ratio (Somerton 1980; Conan and Comeau 1986; Keller et al. 2016). Hemolymph molting hormone levels indicate that morphometrically mature males are effectively terminally molted, with limited or no potential for further molting (Cormier et al. 1992; Tamone et al. 2005, 2007). Following this terminal molt, males are hypothesized to possess a competitive mating advantage conferred by this increase in chela size, even against larger-bodied, small-clawed crabs (Sainte-Marie and Hazel 1992; Stevens et al. 1993; Sainte-Marie et al. 1997; Mayrand et al. 1998).
A terminal molt to morphometric maturity poses several concerns for fishery managers. Fisheries may remove sexually mature, morphometrically immature, males from the stock before they have attained full reproductive competency. Conversely, crabs that reach morphometric maturity below the legal size limit will never be available to the fishery (Conan and Comeau 1986). Further, these small but morphometrically mature males may impose genetic drift on the stock, leading to a general reduction in size at terminal molt and an increasing proportion of males that will never attain either legal or industry-preferred size (Sainte-Marie et al. 2008). Finally, maturity at size estimates are an important data input for calculating mature male biomass in the stock assessment (Stockhausen 2021). For these reasons, and because size at maturity may vary interannually due to environmental factors (Burmeister and Sainte-Marie 2010; Dawe et al. 2012), it is important that size at maturity is assessed annually to facilitate optimal management, and to monitor for sustained shifts in size at maturity.
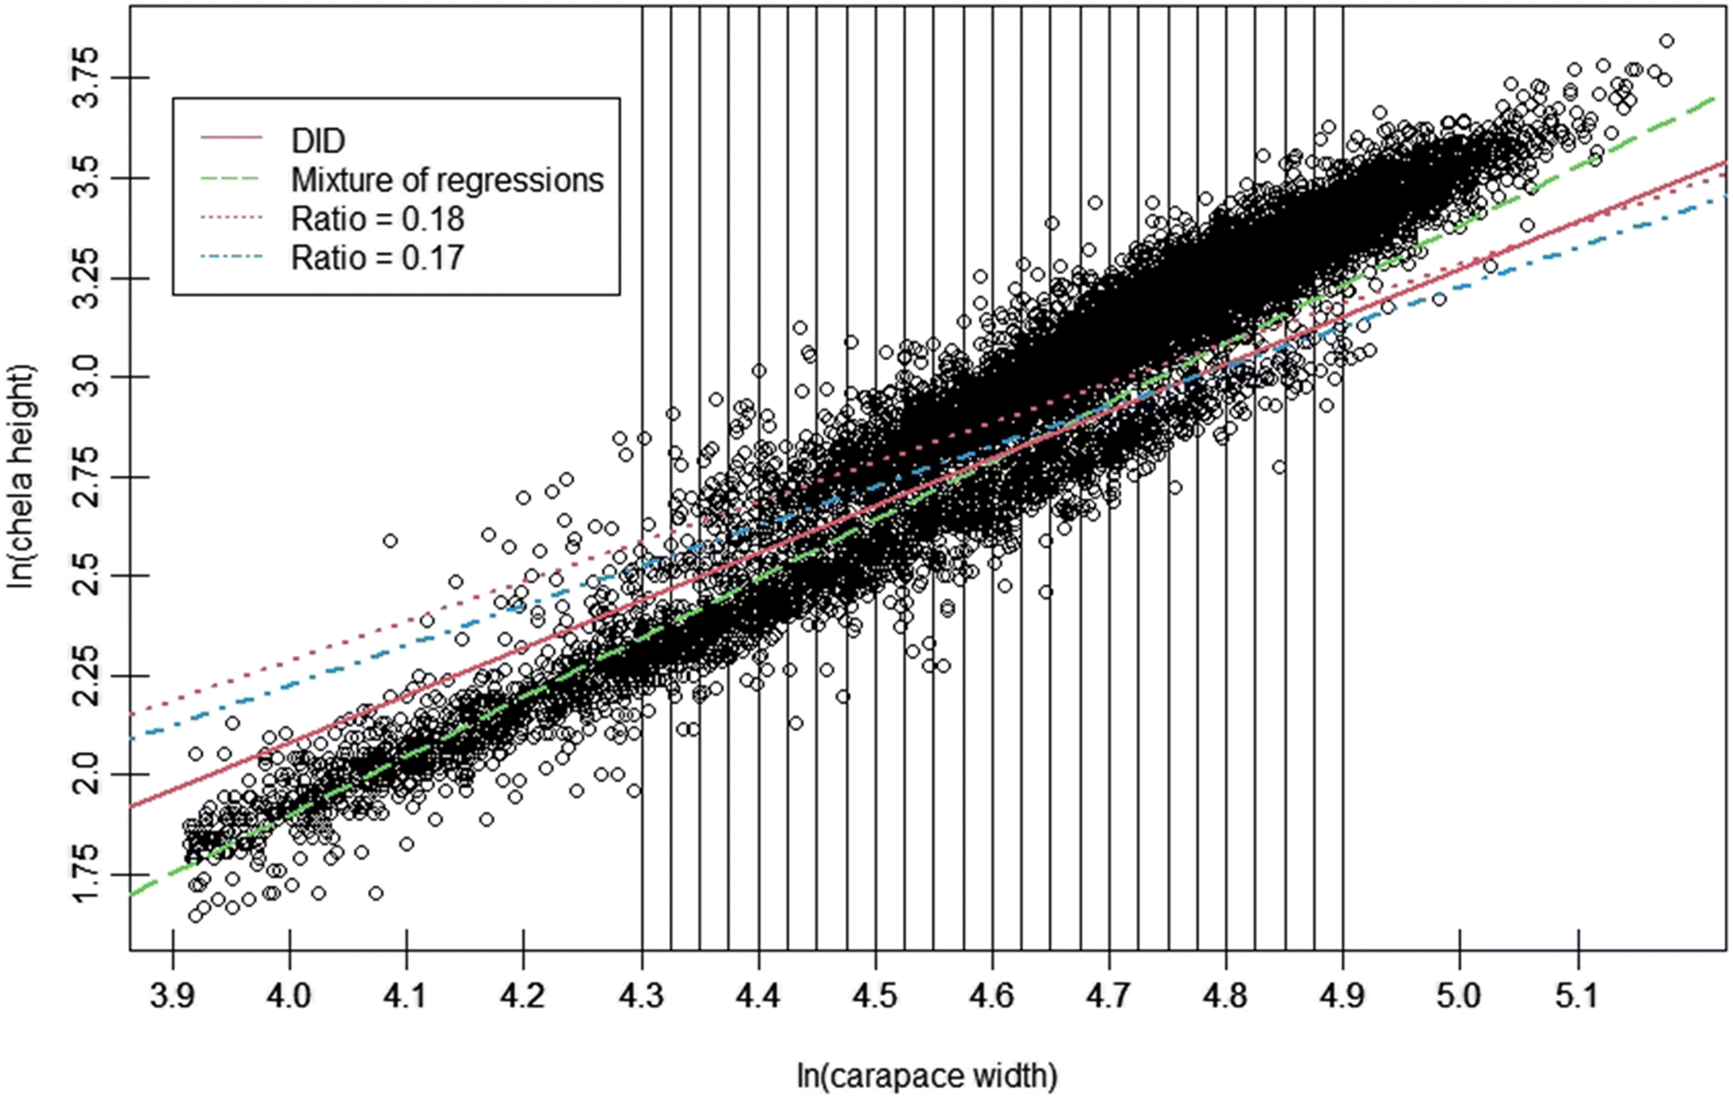
Morphometric measurements are nonlethal, can easily be conducted in the field environment, and may be used to identify mature individuals in crustaceans (e.g., Brown and Powell 1972; Donaldson et al. 1981; Conan and Comeau 1986; Pinheiro and Fransozo 1998; Jadamec et al. 1999; Fernández-Vergaz et al. 2000). In the case of Chionoecetes spp., the disproportionate increase in CH relative to CW with the terminal molt suggests an intuitive way to distinguish immature and mature males in a population, as it drives the bifurcation of data into two “clouds”, an upper cloud representing morphometrically mature, large-clawed crab, and a lower cloud representing small-clawed, immature crab (Fig. 1). Over the past three decades, multiple procedures have been developed to exploit this morphometric difference, with varying levels of statistical rigor (e.g., Somerton 1980; Conan and Comeau 1986; Stevens et al. 1993; Warren 1994).
Fig. 1.
Fig. 1. Natural-log chela height and carapace width data for 2008, 2010, 2012, 2014, 2016 and 2017 cutoff at ln(carapace width) = 3.9, with intervals used for calculating distributions and maturity cutlines developed using Distribution Interval Derived (DID), mixture of regressions and ratio approaches.
Although these procedures can be effective, they are not without shortcomings. A notable issue with methods commonly applied for Chionoecetes spp. crabs, such as the program MATURE (Somerton 1980) and Discriminant Function Analysis (DFA; Conan and Comeau 1986; Sainte-Marie and Hazel 1992; Sainte-Marie et al. 1995), is the requirement for a priori classification of crabs within a sample into groups with a known maturity status via other preliminary means (e.g., visual testes assessment). Consequently, these procedures may be problematic to apply in cases where the investigator lacks samples with known maturity statuses from which initial conditions for the given classifier may be derived (Warren 1994; Rugolo et al. 2005). In response, mixture of regressions procedures have been developed and applied to crustacean data for maturity classification on an exploratory basis (Warren 1994; Turner 2000; Rugolo et al. 2005; Murphy 2019). This approach, however, requires carefully selected initial values for the model parameters, and the investigator may be required to follow an iterative analysis process involving many runs, capped by a subjective decision as to the final “best fit”. Finally, some authors have employed the ratio of CH to CW to classify mature males (Stevens et al. 1993; Tamone et al. 2005; Tamone et al. 2007). Although this procedure offers the dual advantages of being both intuitively simple and computationally easy to apply, variability in the CH/CW ratio, both within and among years, leads to crabs on the lower extreme of the morphometrically mature cloud, and upper extreme of the immature cloud being likely to be misclassified (Rugolo et al. 2005). Complicating matters, the rate at which this occurs itself varies interannually across the time series (Rugolo et al. 2005).
In this paper, we outline a novel procedure; the distribution interval derived (DID) maturity cutline, which addresses issues identified with existing procedures for defining classification cutlines. We then provide basic comparisons of the performance of this new method relative to existing methodologies. Finally, we apply this procedure to calculate annual male size-at-maturity estimates for the eastern and western stocks of Tanner crabs in the eastern Bering Sea (EBS).

Methods

Data

Morphometric data for male Tanner crabs were obtained from the National Marine Fisheries Service (NMFS) eastern Bering Sea (EBS) bottom trawl survey, which has been conducted with standardized methods since 1982 (Lang et al. 2018). The EBS survey samples 375 stations on a regular grid (details in Lang et al. 2018). Both CH and CW were measured to the nearest 1 mm from a subsample of the catch in 1990-2007 and in 2009, and to the nearest 0.1 mm in 2008 and 2010–2019.

Density interval derived (DID) cutline procedure

Our procedure uses a kernel density estimator (KDE) to define the distributions in CH that distinguish crabs that have and have not undergone the terminal molt. KDE is a nonparametric procedure for estimating the underlying probability density of a given dataset, and offers the advantage of being able to determine the shape of the density without the constraints imposed by assumptions concerning the shape of the underlying distribution. The basic kernel density estimator has the equation
f^kde(x)=1nhDi=1nK(xXih)
(1)
where n is the sample size, Xi are data points, x is the location at which the density is being estimated, K is the kernel, a symmetric, typically positive function which when integrated will be equal to one, and h is the bandwidth, a smoothing parameter (Scott 1992; Deng and Wickham 2011). For calculating kernel densities, we used the density function in R version 3.4.3 (R Development Core Team 2017). This implementation of the KDE calculation process provides high accuracy, while remaining computationally efficient (Deng and Wickham 2011). To generate a kernel density estimate, the density function spreads the mass of the empirical density function over a grid of n ≥ 512 points prior to employing the fast Fourier transform to convolve this initial approximation with a discretized kernel.
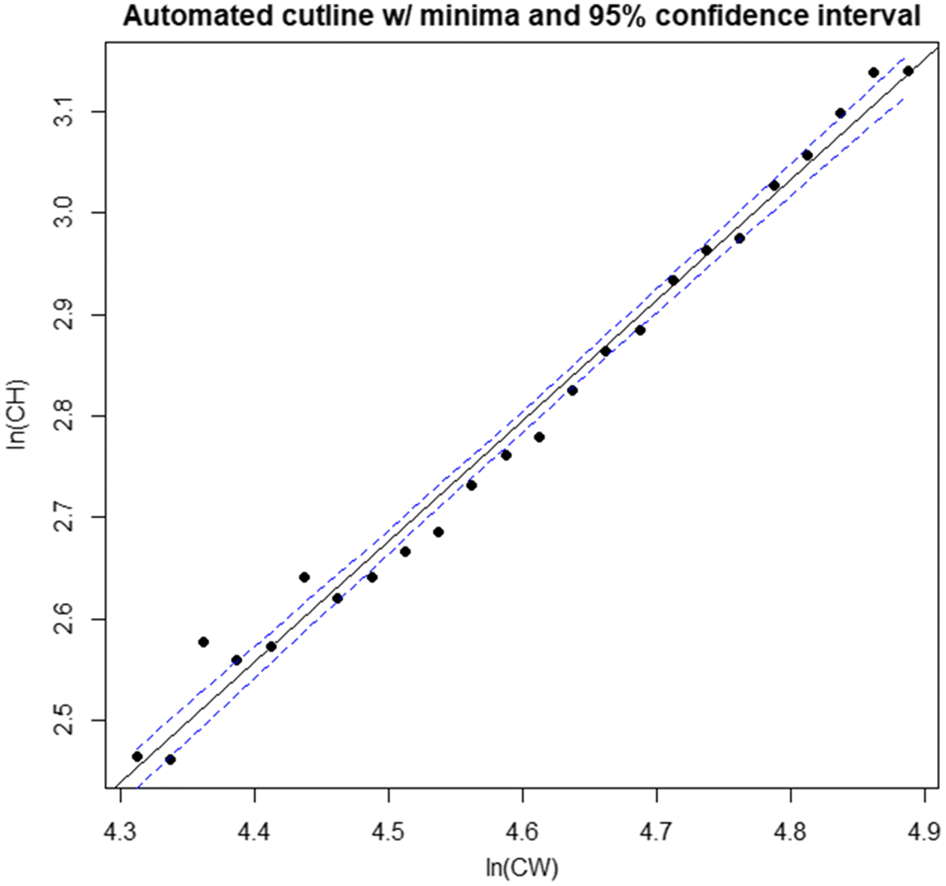
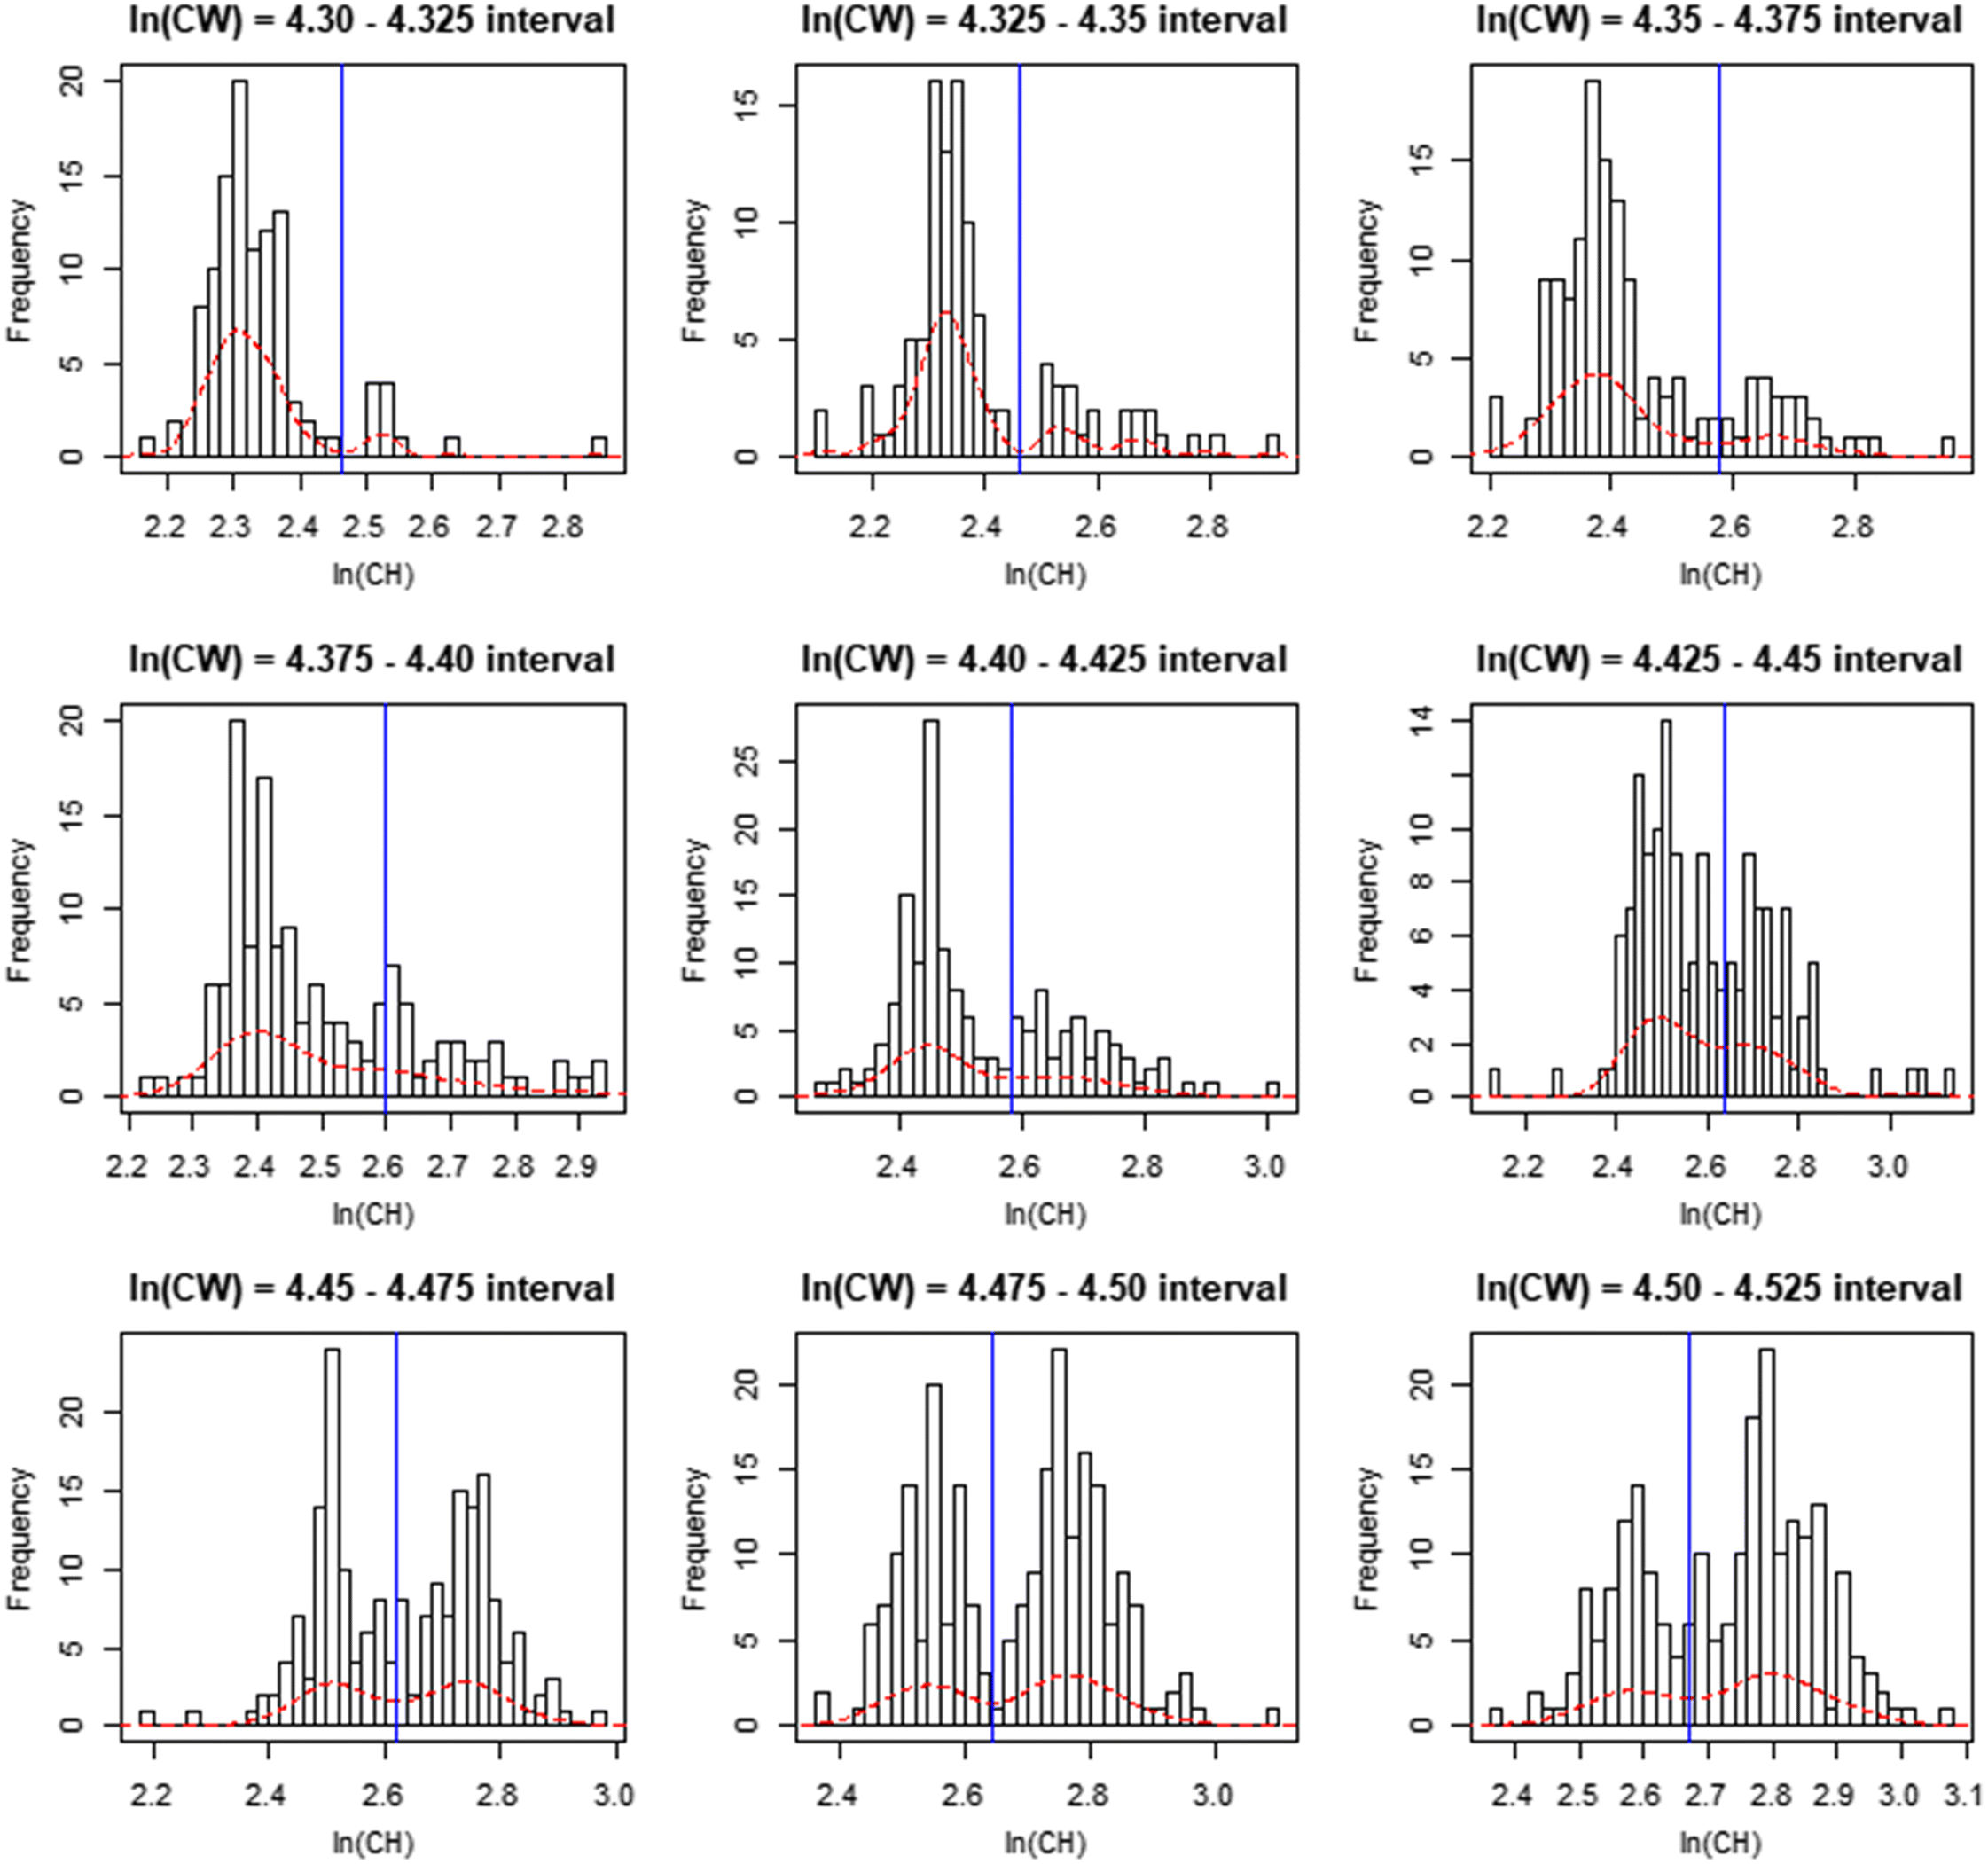
Data for CH and CW measurements obtained from males of all shell conditions sampled during surveys in 2008, 2010, 2012, 2014, 2016, and 2017 were pooled and linearized via natural log-transformation. Data were then subset into 24 ln(CW) size intervals at ln(CW) intervals of 0.025 to allow full coverage of the overlap region between the two distributions, while maximizing minima sample size (Fig. 1). We then sequentially applied kernel density estimation to the ln-chela height data for each subset interval, and the minima of the resulting density distributions were used to define the boundary between maturity classes for the given interval (Fig. 2). The two dominant modes within each extracted distribution were employed to set boundaries for the region within which the search algorithm would seek minima, to prevent it from identifying minima in the distribution tails. The cutline delineating the two maturity classes was then estimated as the best-fit linear regression of the minima in the ln(CH) distributions (the division between immature and mature crabs within a CW interval) against the midpoints of those CW intervals (Figs. 1, 3).
Fig. 2.
Fig. 2. Sample distributions at given intervals, with minima for each interval (vertical blue lines).
Fig. 3.
Fig. 3. Distribution minima, with least-squares fitted cutline, and 95% confidence interval.
Sensitivity analyses were conducted to evaluate the effects of changing the widths of the intervals used to subset data, as well as setting alternative upper and lower boundaries for the region over which intervals were taken from. For the former, interval widths of 0.02, 0.05 and 0.1 ln(in) were used, while for the latter lower boundaries of 4.35, 4.40, 4.45 and 4.50 ln(in) and upper boundaries of 6.675, 4.725, 4.775 and 4.825 ln(in) were evaluated.

Procedural comparisons

We assessed the performance of our method against two alternative procedures, which have previously been applied to classify maturity status in crabs: mixture of regressions (Warren 1994; Rugolo et al. 2005) and the ratio of CH to CW (Stevens et al. 1993; Tamone et al. 2005, 2007). For the mixture of regressions approach, log-transformed data from the 2008, 2010, 2012, 2014, 2016, and 2017 surveys for crabs of all shell conditions were pooled. Models were fitted using the R package ’mixreg’ following the removal of crabs with ln(CW) <4.3. This last step, taken only for calculating the mixture of regressions cutline itself, was made because smaller crabs introduce nonlinearity to the data set that may otherwise confound the algorithm used to fit the model, leading to inconsistent cutline calculations. As per Rugolo et al. (2005), the cutline parameters were calculated from the linear model output using the equations
b0c=b0m1*σm2σm1+σm2+b0m2*σm1σm1+σm2,
(2)
and
b1c=b1m1*σm2σm1+σm2+b1m2*σm1σm1+σm2
(3)
where b0c is the cutline intercept, b0m1 and b0m2 are the intercepts for the linear models m1 and m2 fitted by mixture of regressions, b1c is the cutline slope, b1m1 and b1m2 are the slopes for the respective linear models, and σm1 and σm2 are the model standard errors.
In applying the ratio approach, we employed ratios of 0.18 (R18), as previously employed on several occasions (Stevens et al. 1993; Tamone et al. 2007; Lang et al. 2018), and for further comparison, 0.17 (R17), which may be more appropriate for eastern Bering Sea Tanner crabs (W. Stockhausen, NOAA-Alaska Fisheries Science Center, pers. comm.). These were applied to the same data as used in the DID and mixture of regressions approaches.
Finally, as an initial application of the DID cutline, we examined variability in annual size at 50% maturity in the current Tanner crab management districts in the EBS (east and west of 166⁰W longitude) during 1990–2019. The DID cutline was applied to data for shell condition 2 (SC2) males only, as SC3 and 4 males (when mature) are understood to have made the terminal molt in prior years. Following maturity classification, crabs were binned into mature and immature categories by 10 mm CW increments for data from each district – year combination. This increment successfully addressed issues with small sample sizes during some years while maintaining procedural consistency throughout. The proportion of mature males was calculated for each bin, while crabs in bins <50 mm CW were assumed to be 100% immature. This cutoff is consistent with the smallest crabs classified as morphometrically mature by the currently applied ratio procedure. Size at 50% maturity was calculated using logistic regression in the R package nlme (Pinheiro et al. 2017). For purposes of comparison, size at 50% maturity time series were also created for the mixture of regressions and ratio approaches using identical procedures to those just described.

Results

Cutlines

Although there was minor residual curvilinearity, the relationship between ln(CH) minima (indicating the immature/mature division) and the midpoint of ln(CW) bins was well fit by a linear model (Fig. 3, Table 1). Consequently, the DID cutline reliably separated the large-claw and small-claw “clouds” in each year investigated, with minimal impingement on either cloud within the region of overlap, and was generally robust to interannual variance in allometric growth (Figs. 1, 4).
Table 1.
Table 1. Cutline model parameters for baseline model, and models investigating sensitivity to variation in interval widths.
a.) baseline (interval 0.025)EstimateStd. errort-valuep-value
Intercept−2.674110.13094−20.428.60E-16
Slope1.188840.0284441.8< 2E-16
Residual standard error: 0.02411 on 22 degrees of freedom
Multiple R-squared: 0.9876, Adjusted R-squared: 0.987
F-statistic: 1747 on 1 and 22 DF, p-value: < 2.2E-16
b.) interval 0.05EstimateStd. errort-valuep-value
Intercept−2.76830.1108−24.991.02E-11
Slope1.2080.023850.762.25E-15
Residual standard error: 0.01795 on 12 degrees of freedom
Multiple R-squared: 0.9954, Adjusted R-squared: 0.995
F-statistic: 2576 on 1 and 12 DF, p-value: 2.246E-15
c.) interval 0.02EstimateStd. errort-valuep-value
Intercept−2.703410.11873−22.77<2E-16
Slope1.195620.0257946.35<2E-16
Residual standard error: 0.02446 on 28 degrees of freedom
Multiple R-squared: 0.9871, Adjusted R-squared: 0.9867
F-statistic: 2149 on 1 and 28 DF, p-value <2.2E-16
d.) interval 0.1EstimateStd. errort-valuep-value
Intercept−2.68530.5943−4.5180.006292
Slope1.18630.12779.2910.000243
Residual standard error: 0.06757 on 5 degrees of freedom
Multiple R-squared: 0.9452, Adjusted R-squared: 0.9343
F-statistic: 86.31 on 1 and 5 DF, p-value: 0.000243
Fig. 4.
Fig. 4. Comparison of cutline procedures using 2014, 2016, 2017 and 2018 survey data for shell condition 2 male C. bairdi. Note high rate of classification of small crab as mature by mixture of regression approach, and classification of crabs from superior data “clouds” as being immature by the chela height to carapace width ratio-based procedures.
Relative to the ratio-based cutline, our approach increased the likelihood of small carapace crab being classified as being mature (Fig. 4), although this may be addressed using a reasonable size cutoff, as we did. Both ratios demonstrated a tendency to classify more smaller crabs belonging to the superior “large-clawed” cloud as immature, relative to the DID approach (Fig. 4). Relative to classification results for the DID approach, apparent misclassification of large-clawed crabs is greatest for R18, and continues to be an issue until the upper range of (CW) within the region of overlap between the two data “clouds”. Conversely, R18 exhibits reduced classification of small clawed males as being mature at the upper range of carapace sizes in the inferior cloud(s) compared to both R17 and DID approaches (Fig. 4). Relative to R18, R17 exhibited reduced rates of classification of large-clawed crabs as immature at smaller sizes, although more large-clawed males were still classified as immature relative to the DID approach. However, R17 classified more small clawed crabs at larger sizes as being mature relative to either R18, or the DID approach.
In terms of absolute number of crabs classified as mature, of the three procedures the DID approach was compared against, the mixture of regressions approach classified the most mature males that were also classified as mature by the DID method (Table 2). Unfortunately, the poor performance of the mixture of regressions cutline at smaller CWs lead to a high rate of reclassification identified as immature by the DID approach as being mature. Consequently, estimates of sensitivity between the two methods are the poorest seen in the presented comparisons. Specificity is, however, far better, with the DID approach only reclassifying 243 crab the mixture of regressions approach classified as being mature (Table 2). This discrepancy is due to the DID cutline’s previously noted minor tendency to classify large clawed crab as immature. Due to the ratio-based approaches’ poorer performance classifying smaller large-clawed males, comparisons of both gave markedly worse specificity estimates (Table 2). This is a result of the tendency of both ratio-based approaches to essentially “high-grade” maturity estimates, leading smaller large-clawed crab to be classified as immature at comparatively high numbers.
Table 2.
Table 2. Contingency table comparing maturity classifications between the different procedures: DID (Density Interval Derived), mixture of regressions, R17 (chela height/carapace width ratio = 0.17) and R18 (chela height/carapace width ratio = 0.18).
Mixture of regressions
MatureImmature  SE95% CI
DIDMature15543243Sensitivity76.858.7717.18
 Immature468111935Specificity98.009.9019.40
  R17    
  MatureImmature  SE95% CI
DIDMature138711915Sensitivity91.599.5718.76
 Immature127415342Specificity88.909.4318.48
  R18    
  MatureImmature  SE95% CI
DIDMature124423344Sensitivity90.949.5418.69
 Immature123915377Specificity82.149.0617.76
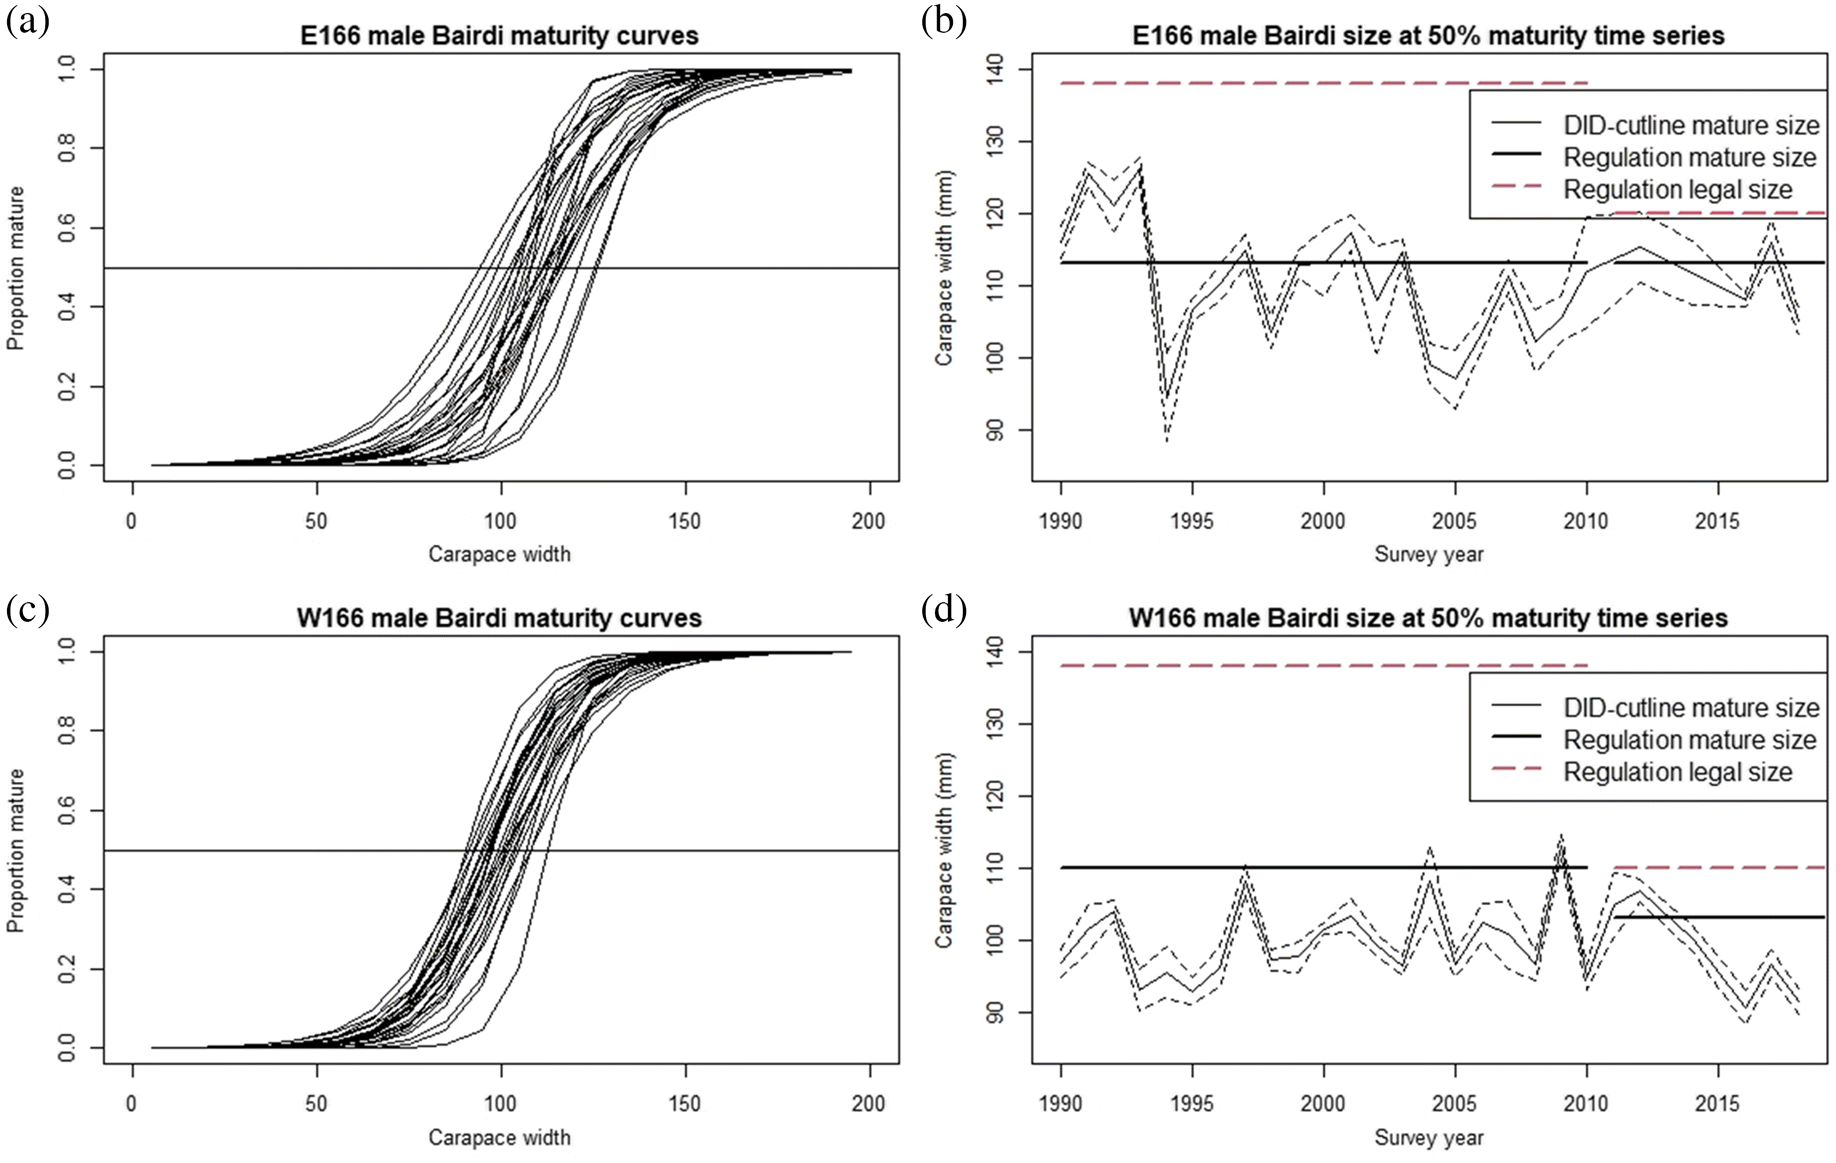
New shell male size at 50% maturity as defined by the DID cutline was highly variable across years in both management districts (Figs. 5, S1–S7, S30–S36, Tables S1, S2), with an average size at maturity of 99.2 mm in the western district, and 110.9 mm in the eastern district. Both of these estimates are lower than both the currently recognized sizes at maturity for these stocks (103.0 mm CW for the western district, 113.0 mm for the eastern district; Lang et al. 2018), and legal retention sizes (110.0 mm for the western district and 120.0 mm CW for the eastern; Lang et al. 2018). Of some historical interest, the eastern district average estimate does closely conform to the lower size threshold for the pre-fishery recruitment size class (110–137 mm) used for management prior to 2011, but was substantially below the legal retention size during that period (Fig. 5b). Furthermore, size at 50% maturity does not meet or exceed the period-appropriate legal size in any year for either district (Figs 5b, 5d). Although consistent trends in size at maturity are absent in both districts, in the western district, an abrupt decrease in size at maturity occurred in the period after 2012, with the smallest size at 50% maturity observed during the time series (90.7 mm CW) occurring in 2016 (Fig. 5d).
Fig. 5.
Fig. 5. Interannual variability in size at maturity. (a) Annual maturity model curves for eastern district (b) corresponding time series of size at 50% maturity for shell condition 2 male Tanner crab, with 95% confidence interval (c) annual maturity model curves for western district (d) and time series of size at 50% maturity with 95% confidence interval for western district. For (a) and (c) horizontal line at 0.5 denotes 50% maturity. For (b) horizontal solid black lines at 110 mm/113 mm denote regulation size at maturity for the eastern district for the time period, while horizontal dashed red line at 120/138 mm denotes the corresponding legal retention size. For (d) horizontal solid black line at 103/110 mm denotes size at maturity for the western district for given time period, while horizontal dashed red line at 110/138 mm denotes the corresponding legal retention size.
Size at maturity estimates for the mixture of regressions and ratio-based procedures demonstrate effects from the respective classification tendencies of the cutlines (Figs. 6, S8–S29, S37–S57, Tables S3–S8). Due to the mixture of regressions cutline’s tendency to classify more small CW, small-clawed crab as mature, size at maturity estimates for this procedure are consistently smaller than the matching estimates for the other procedures (Fig. 6). This occurred despite the use of the same minimum size threshold as used for the DID analysis (≥ 50 mm CW). Conversely, due to their tendencies to high grade maturity classifications relative to either the DID procedure or the mixture of regressions approach, annual size at maturity estimates for the ratio approaches are consistently larger, with R18 giving the largest (Fig. 6). Interestingly, while magnitudes differ, all four approaches yield similar trends within both districts (Fig. 6).
Fig. 6.
Fig. 6. Time series comparisons of size at 50% maturity estimates for (a) the eastern district, and (b) the western district. Note that the mixture of regressions approach consistently provides the lowest size at maturity estimates, while the ratio methods consistently provide the largest.
Of note is our use of 1 mm resolution data, most notably during the earlier years of the time series investigated. Due to the lower resolution of these data, there is potential for size-at-maturity estimates in these years to be less precise compared to estimates in those years for which high-resolution data are available. This should be kept in mind when considering the affected size-at-maturity estimates.
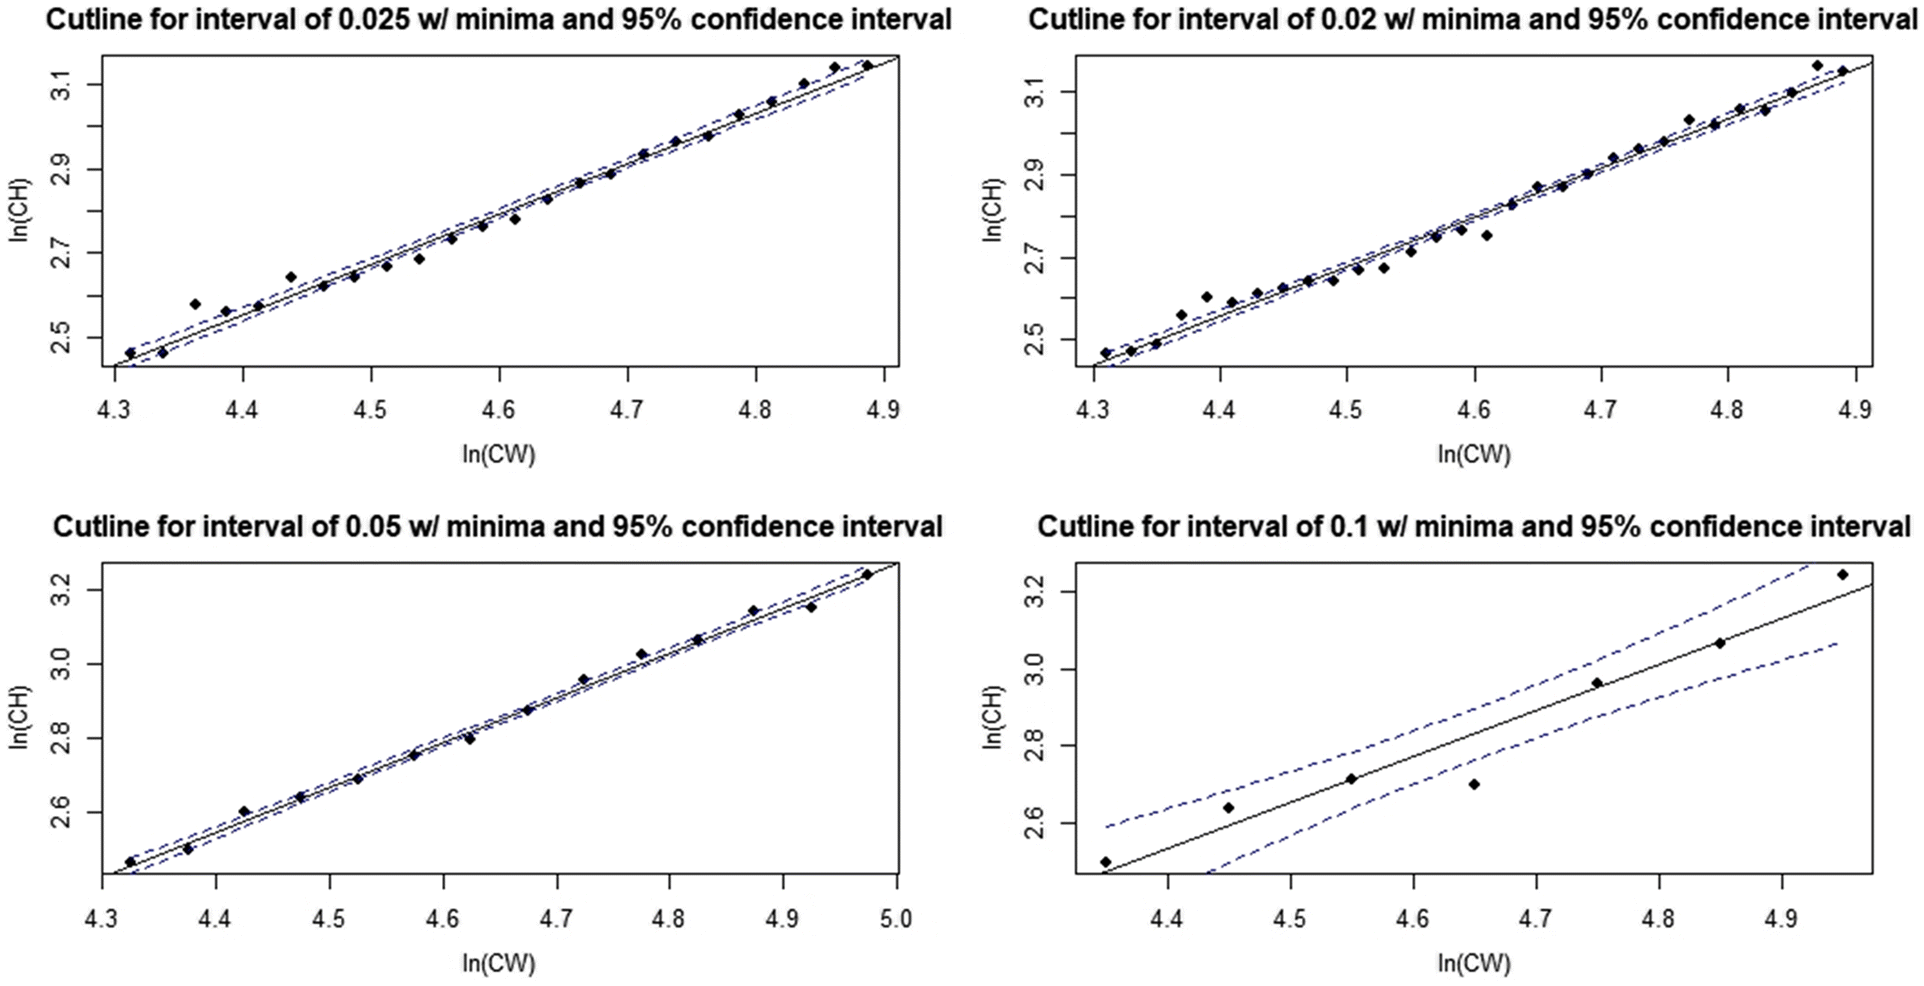
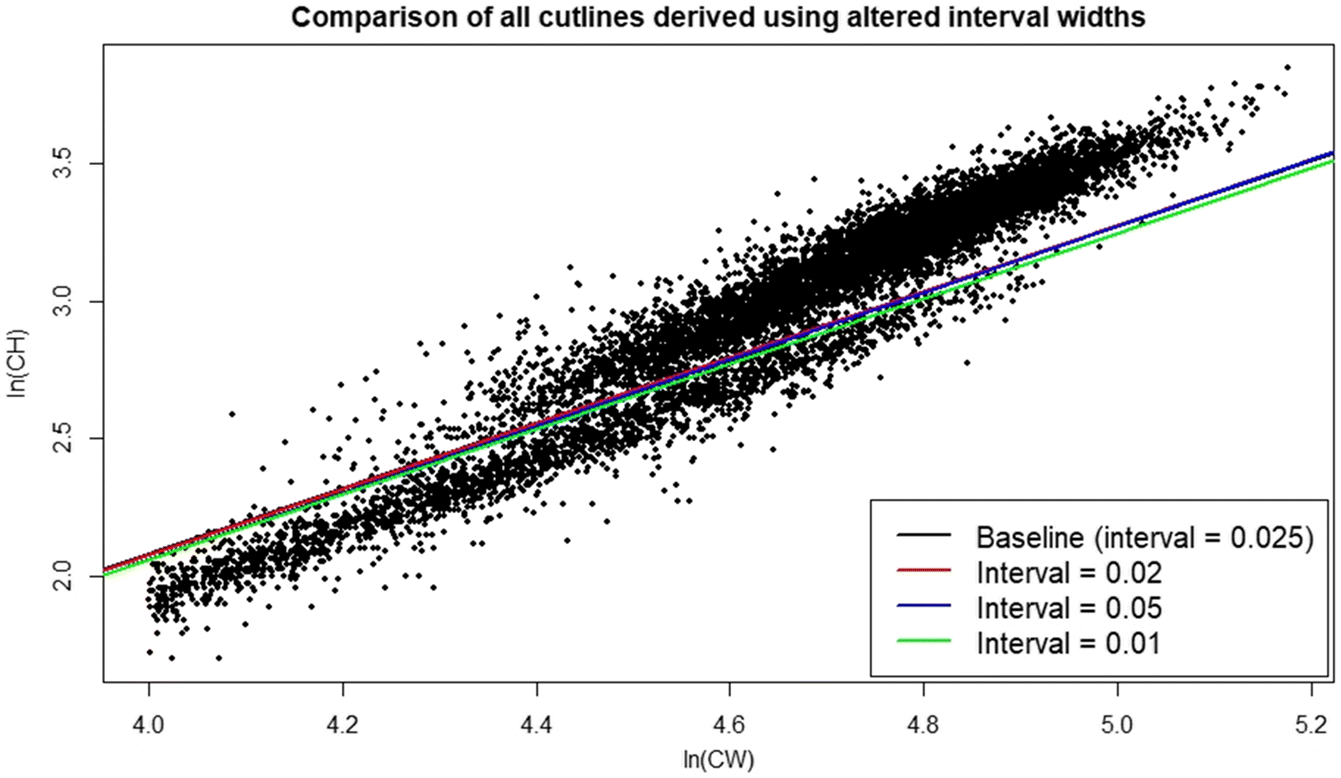
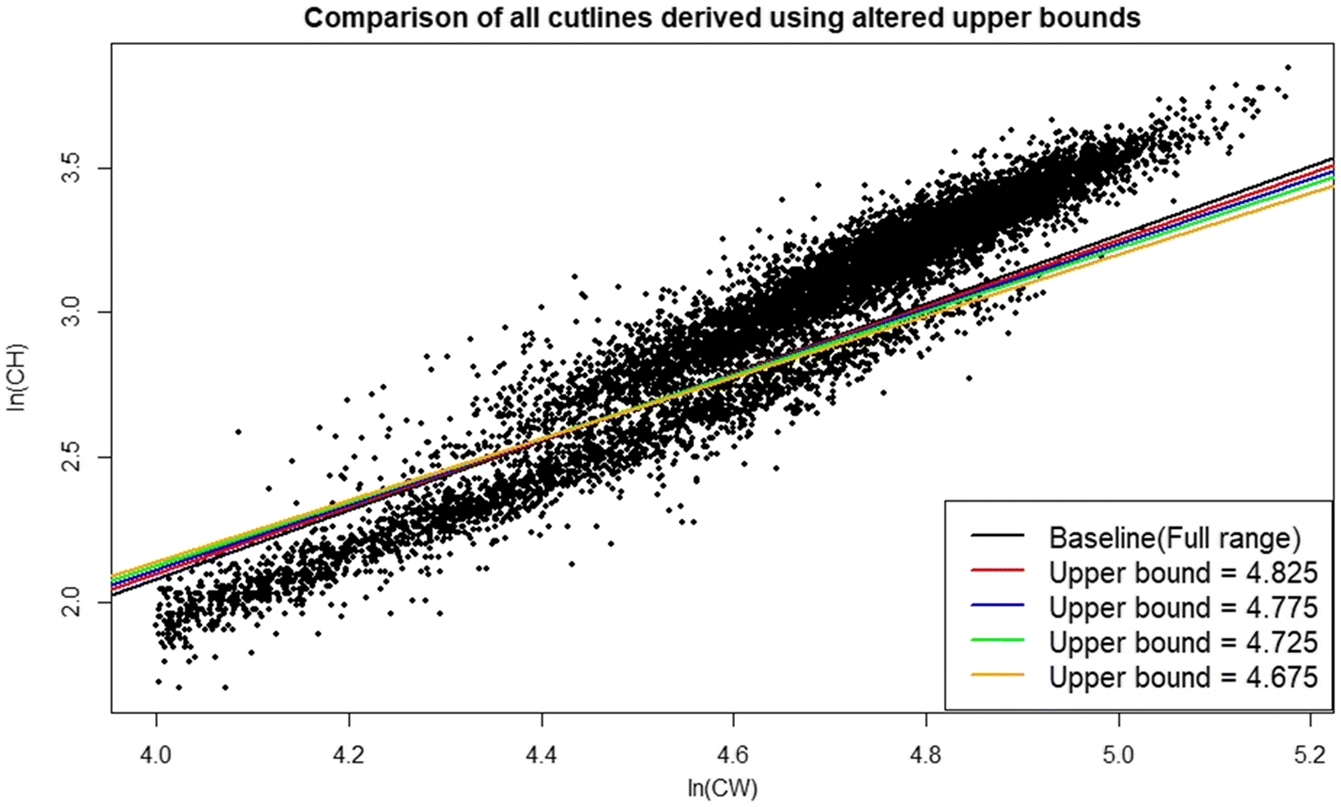
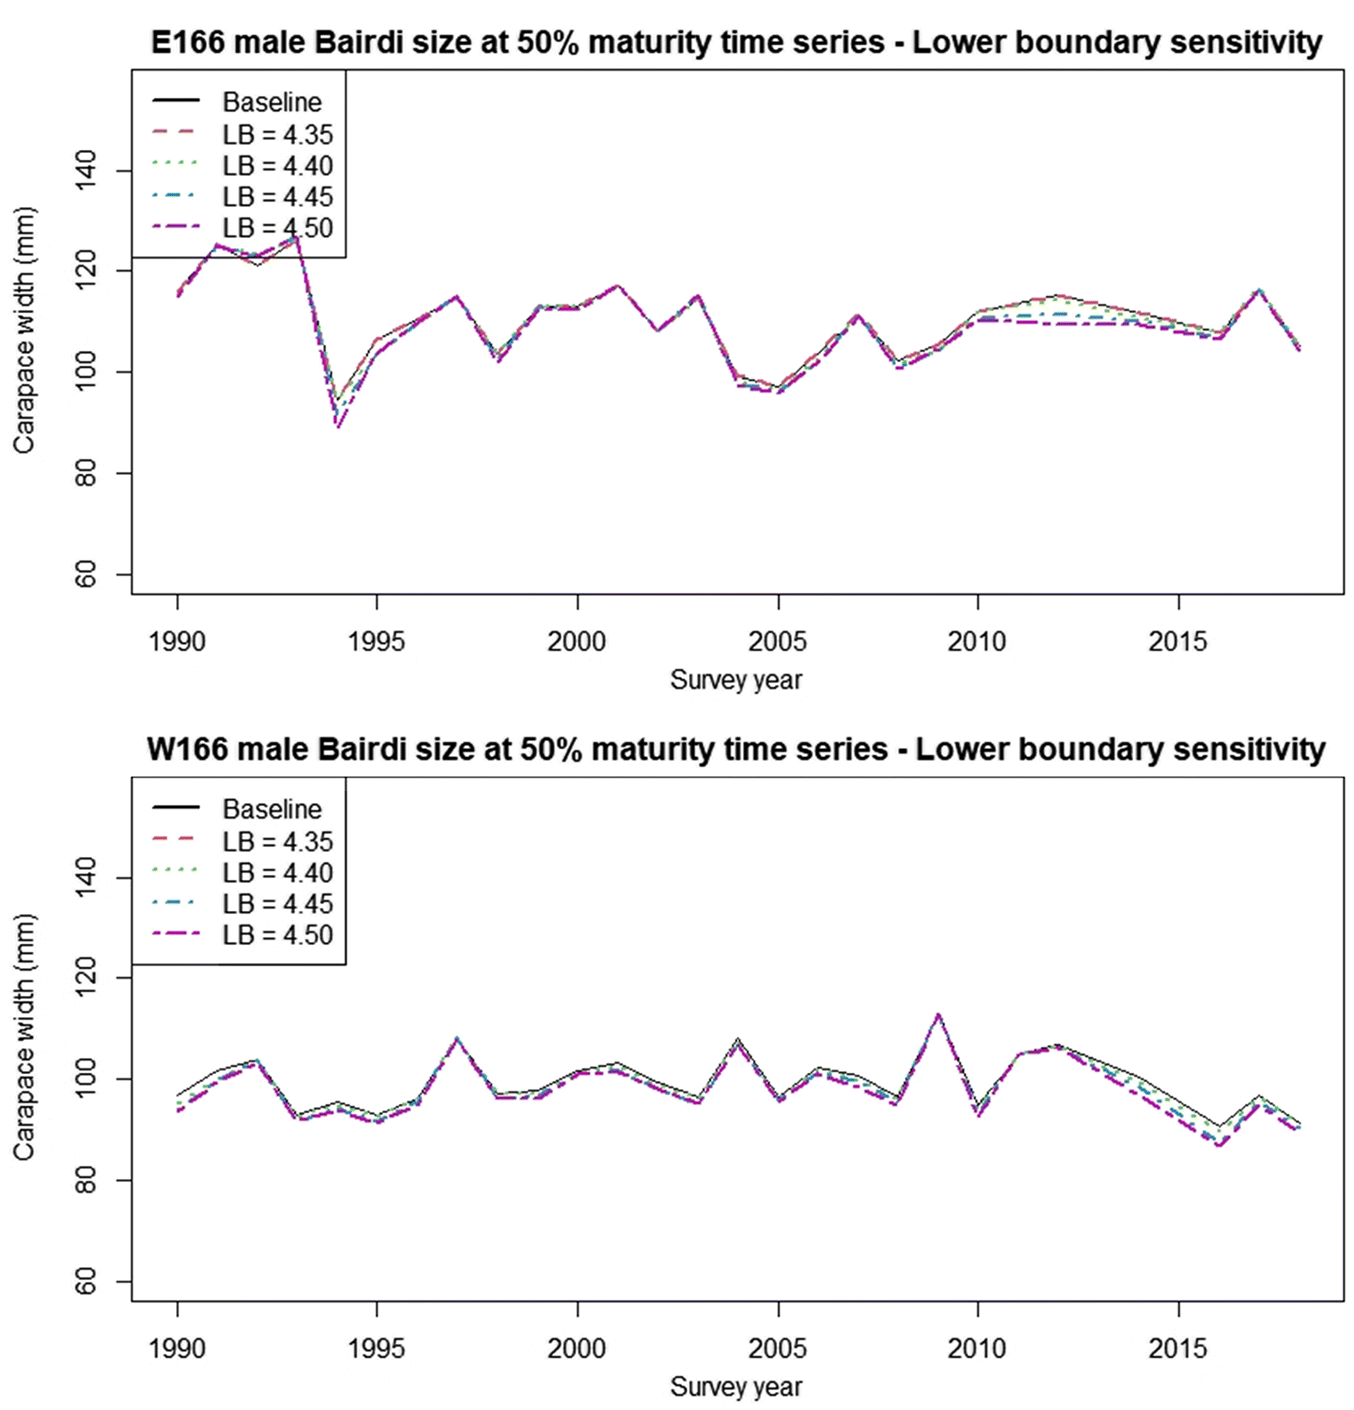
Sensitivity analyses indicate that the DID procedure is modestly robust to varying the width of intervals used for subsetting data (Figs. 7, 8; Table 1). Although the largest interval chosen (0.1) gave a poorer fit to the derived minima and had wide confidence intervals (Fig. 7d), the final cutline was very similar to the baseline when plotted against the raw data, albeit with some minor vertical displacement (Fig. 8). Changing the upper and lower boundaries for the region from which data were subset using baseline interval width settings had a greater effect on the final cutline. Increasing the lower boundary increased the slope of the cutline, leading to substantially more small small-clawed crabs being misclassified relative to the baseline (Fig. 9), while decreasing the upper boundary reduced cutline slope leading to more large but small-clawed crabs being misclassified relative to the baseline (Fig. 10). Despite the apparent changes in the cutlines associated in particular with alternative bounds, only limited effects were seen in the derived size at maturity estimates (Fig. 11).
Fig. 7.
Fig. 7. Sensitivity analysis evaluating effects of changing widths of intervals used to extract distributions from the data on cutline fit to minima.
Fig. 8.
Fig. 8. Sensitivity analysis evaluating effects of changing widths of intervals used to extract distributions from the data on cutline fit to chela height data.
Fig. 9.
Fig. 9. Sensitivity analysis evaluating effects of changing lower bounds for extracting data distributions for minima identification on cutline fit to chela height data.
Fig. 10.
Fig. 10. Sensitivity analysis evaluating effects of changing upper bounds for extracting data distributions for minima identification on cutline fit to data.
Fig. 11.
Fig. 11. Comparisons of size at 50% maturity time series for sensitivity analyses focusing on effects of changing the upper boundary for the region over which the intervals are derived. Here results for scenarios where the lower boundary limit (LB) are specified as the given value are shown. Results for changing the upper boundary limit and varying the interval width are very similar.

Discussion

In this paper, we demonstrated a novel procedure for defining a maturity classification cutline for crustaceans. This procedure employs analysis of CH distributions across a range of CW intervals within the region of overlap between the data “clouds” taken to represent morphometrically mature and morphometrically immature male crabs. We compared basic performance of this procedure against established procedures based on the ratio of CH to CW, and a mixture of regressions model. Finally, we employed our cutline to calculate size at 50% maturity for Tanner crabs within the eastern and western management districts of the eastern Bering Sea. Our procedure was found to be competitive with established methods for classifying morphometric maturity in crabs. Results of our initial analytical application demonstrated significant interannual variability in male size at maturity, and suggested the existence of issues with current management tools for these stocks. The most noteworthy of these is the mismatch between our estimated size at maturity estimates for a population that terminally molts, and the legal retention size for males in state harvest strategies, which suggests the potential of genetic drift may exist.
The DID cutline permitted effective classification of morphometrically mature male Tanner crabs and maintained effectiveness across crab pseudocohorts, demonstrating reduced susceptibility to variance in crab allometric growth patterns arising from either endogenous or exogenous factors, or both, relative to other methods (Rugolo et al. 2005). The DID approach offers the additional benefit of being scalable based on the availability of data—the investigator may choose as many, or as few, intervals as the data permit. Furthermore, its application is comparatively user friendly and straightforward, facilitating use by the wider fishery research community. It is recommended that if used, distributions should be drawn from the full region of overlap between data point “clouds”. If the investigator wishes to optimize their interval selection process, linear model confidence intervals provide a good metric for comparison between models derived using different numbers of intervals, with the smallest CI indicating the “best” interval for use.
Operationally, within the region of overlap between the data “clouds”, the DID approach demonstrated reduced rates of likely classification errors at smaller CW values relative to the competing approaches tested, which would otherwise lead to errors in estimates of maturity. In the case of the mixture-of regressions approach, the observed tendency to classify smaller, small-claw crab as being mature lead to consistent underestimates of size at maturity relative to the other procedures. If these maturity estimates were then employed to calculate estimates of the mature male population, these estimates would be markedly larger than would seem likely to actually be the case. The application of a stringent size cut-off in data being analyzed using mixture of regressions may help to alleviate the issue somewhat. However, this is not a perfect solution, as seen in our case where the same cutoff used for the DID approach was not sufficient. It is important to note that the use of this cutoff in the DID method was more a formality than an ironclad requirement to maintain analytical validity.
This issue also seems apparent in other applications of the mixture of regressions approach, and is thus not an artifact of our specific implementation (Murphy 2019). While the DID cutline does classify more large CW, small-clawed crabs as being mature than the mixture of regressions cutline, this error is much easier to resolve during the analysis process than when small CW small-clawed crabs as classed as mature, not least because these cases will be much more apparent. In the eventuality that these crabs are missed during error checking, they should have minimal effect on maturity calculations.
Conversely, the relatively large number of smaller, large-clawed males that are classified as immature by both of the ratio-based approaches leads to comparatively large estimates of size at maturity for both, which were consistent across the entire time series analyzed. Applied for population estimation purposes, these would lead to reduced estimates of the mature male component relative to those derived using the DID and mixture of regressions procedures. Of the two, R18, which is the ratio most often seen used for Bairdi, consistently gave the largest size at maturity estimates (Tamone et al. 2007). If fishery managers employed these estimates, they would potentially lead to especially conservative management decisions. Furthermore, use of these cutlines in research may lead to, amongst other concerns, overestimates of the prevalence of skip-molting, a phenomenon whereby immature crabs skip a molt, as small, old-shell large-claw crab would be classed as being immature.
The DID approach bears some similarities to the procedures employed by the MATURE program (Somerton 1980; Zheng 2008). Notably, both approaches use fitting a line through a continuous region of minimal data density to create the final cutline; however, they differ in the steps taken prior to that. As previously noted, MATURE requires inputs for known mature and immature crab, from which groups initial classifier lines are defined. These lines are then extended into a region of overlap by iteratively assigning points in this region to the nearest classifier line and re-estimating the classifier until no points switch lines (Somerton 1980). The average of these two classifiers is then taken as an initial cutline, and this is then vertically translated within the bounds of the two classifiers until an elevation is found that results in the fewest observations within its region (Somerton 1980; Zheng 2008). In contrast, the DID approach proceeds directly to identifying the regions of minimal density once density intervals have been specified, and then immediately uses these to create the cutline.
From a statistical perspective, in comparison to the multiple-regression approach, the DID approach does not inherently calculate certain useful auxiliary information, such as group membership likelihoods by data point. Although, based on the distribution modeling procedures used, such information may be extracted on an interval-by-interval basis from the calculated distributions. We acknowledge that a weakness in the work we have presented herein is the minor curvilinearity observed in our data and the distribution minima series calculated from it. Consequently, as a next step, exploration of the use of limited nonlinear modeling may be appropriate. Our approach of fitting a model to a sequence of distribution minima lends itself to such investigations. If successful, in addition to potentially providing a better performing and more accurate cutline, this may also allow for the elimination of the requirement that data be natural log-transformed prior to analysis. This approach will be explored as a possible refinement of the DID procedure in future research.
Spatiotemporal variability in annual size at maturity in SC2 male Chionoecetes spp., as was observed here and in previous work (Somerton 1981; Otto and Pengilly 2002; Zheng 2008), may arise through several processes, acting either singly or in concert, and doing so on multiple crab pseudocohorts. Environmental conditions, particularly water temperature, have a pronounced effect on crab growth and size at maturity, primarily through reducing molting frequency, and thus increasing age-at-instar, and reducing the number of molts before terminal molt (Somerton 1981; Burmeister and Sainte-Marie 2010; Dawe et al. 2012). Density-dependent effects have also been observed in male Chionoecetes spp., primarily via mating competition, which has been hypothesized to delay the terminal molt, and thus increase the size at terminal molt (Elner and Beninger 1995; Comeau et al. 1998).
An observation of note is that in many years our size at 50% maturity estimates were well below the regulation legal retention sizes for both districts (Lang et al. 2018). Given that male Tanner crabs are not likely to grow following their terminal molt, the present fisheries are harvesting from a limited segment of the genetic population--that with traits favoring growth to larger sizes, potentially imposing size-selectivity on the population. This carries the possibility of imposing harvest-induced evolution if it continues across multiple generations, leading to issues including decreased size at terminal molt, reduced mature biomass, and reduced genetic diversity, which may itself lead to reductions in stock adaptability (Sainte-Marie et al. 1995; Carver et al. 2005; Zheng 2008; Enberg et al. 2009). The decrease in size at maturity observed in the western district since 2012 suggests that this may already be occurring. Further research into this issue, and careful monitoring in future years should be a priority.
An additional priority for future research should be applying the methods of Tamone et al. (2007) to the EBS region. This would provide a baseline “known” estimate for actual terminal molt/morphometric maturity against which estimates derived from allometric-based procedures might be compared to establish rates of actual bias/misclassification in estimates, rather than the relative rates as described in this paper.
Acknowledgments

The authors would like to especially thank the crews of the fishing vessels Arcturus, Aldebaran, Vesteraalen and Alaska Knight for their invaluable support during the summer surveys, and the many NOAA-AFSC-RACE groundfish and shellfish personnel who gathered the data presented in this paper over the course of their careers.

References

Adams AE. 1982. The mating behavior of Chionoecetes bairdi. In Proceedings of the International Symposium on the genus Chionoecetes. University of Alaska Sea Grant Program report No. 82–10. pp. 233–270.
Brown RB, and Powell GC. 1972. Size at maturity in the male Alaskan Tanner crab, Chionoecetes bairdi, as determined by chela allometry, reproductive tract weights, and size of precopulatory males. Journal of the Fisheries Research Board of Canada, 29(4): 423–427.
Burmeister A, and Sainte-Marie B. 2010. Pattern and causes of a temperature-dependent gradient of size at terminal moult in snow crab (Chionoecetes opilio) along west Greenland. Polar Biology, 33(6): 775–788.
Carver AM, Wolcott TG, Wolcott DL, and Hines AH. 2005. Unnatural selection: Effects of a male-focused size-selective fishery on reproductive potential of a blue crab population. Journal of Experimental Marine Biology and Ecology, 319(1–2): 29–41.
Comeau M, Conan GY, Maynou F, Robichaud G, Therriault JC, and Starr M. 1998. Growth, spatial distribution, and abundance of benthic stages of the snow crab (Chionoecetes opilio) in Bonne Bay, Newfoundland, Canada. Canadian Journal of Fisheries and Aquatic Sciences, 55(1): 262–279.
Conan GY, and Comeau M. 1986. Functional maturity and terminal molt of male snow crab, Chionoecetes opilio. Canadian Journal of Fisheries and Aquatic Sciences, 43(9): 1710–1719.
Cormier RJ, Fraser AR, Bailey RFJ, and Raymond N. 1992. Hemolymph ecdysone concentration as a function of sexual maturity in the male snow crab (Chionoecetes opilio). Canadian Journal of Fisheries and Aquatic Sciences, 49(8): 1619–1623.
Dawe EG, Mullowney DR, Moriyasu M, and Wade E. 2012. Effects of temperature on size-at-terminal molt and molting frequency in snow crab Chionoecetes opilio from two Canadian Atlantic ecosystems. Marine Ecology Progress Series, 469: 279–296.
Deng H, and Wickham H. 2011. Density estimation in R. available from vita.had.co.nz/papers/density-estimation.pdf [accessed 30 January 2019].
Donaldson WE, Cooney RT, and Hilsinger JR. 1981. Growth, age, and size at maturity of Tanner crab, Chionoecetes bairdi M.J. Rathbun in the northern Gulf of Alaska (Decapoda, Brachyura). Crustaceana, 40 (3): 286–302.
Elner RW, and Beninger PG. 1995. Multiple reproductive strategies in snow crab, Chionoecetes opilio: Physiological pathways and behavioral plasticity. Journal of Experimental Marine Biology and Ecology, 193(1–2): 93–112.
Enberg K, Jørgenson C, Dunlop ES, Heino M, and Dieckmann U. 2009. Implications of fisheries-induced evolution for stock rebuilding and recovery. Evolutionary Applications, 2(3): 394–414.
Fernández-Vergaz V, López Abellán LJ, and Balguerías E. 2000. Morphometric, functional and sexual maturity of the deep-sea red crab Chaceon affinis inhabiting Canary Island waters: Chronology of maturation. Marine Ecology Progress Series, 204: 169–178.
Jadamec LS, Donaldson WE, and Cullenberg P. 1999. Biological field techniques for Chionoecetes crabs. University of Alaska Sea Grant Program Report 99-02. 80 p.
Keller A, Buchanan JC, Steiner E, Draper D, Chappell A, Frey P, Head MA. 2016. Size at maturity for grooved Tanner crab (Chionoecetes tanneri) along the U.S. west coast (Washington to California). Fisheries Oceanography, 25(3): 292–305.
Lang CA, Richar JI, and Foy RJ. 2018. The 2017 eastern Bering Sea continental shelf and northern Bering Sea bottom trawl surveys: Results for commercial crab species. U.S. Department of Commerce, NOAA Technical Memorandum NMFS-AFSC-372, 233 p.
Mayrand E, Guderley H, and Dutil JD. 1998. Effect of morphometric maturity and size on enzyme activities and nucleic acid ratios in the snow crab Chionoecetes opilio. Journal of Crustacean Biology, 18(2): 232–242.
Murphy JT. 2019. Patterns and implications of skip-molting for the eastern Bering Sea snow and Tanner crab (Chionoecetes opilio and C. bairdi). Fisheries Research, 210: 63–70.
Otto RS, and Pengilly D. 2002. Spatiotemporal trends in Tanner crab (Chionoecetes bairdi) size at maturity. In Crabs in cold water regions: biology, management, and economics. University of Alaska Sea Grant Program Report No. 01-003. pp. 339–349.
Paul AJ, Adams AE, Paul JM, Feder HM, and Donaldson WE. 1983. Some aspects of the reproductive biology of the crab Chionoecetes bairdi. University of Alaska Sea Grant Program Report No. 83-1. 32 p.
Pinheiro MAA, and Fransozo A. 1998. Sexual maturity of the speckled swimming crab Arenaeus cribrarius (Lamarck, 1818) (Decapoda, Brachyura, Portunidae), in the Ubatuba littoral, Sao Paulo State, Brazil. Crustaceana, 71(4): 434–452.
Pinheiro J, Bates D, DebRoy S, Sarkar D, and R Core Team. 2017. nlme: Linear and Nonlinear Mixed Effects Models. R package version 3.1-131. [online]: Available from CRAN.R-project.org/package=nlme.
R Development Core Team. 2017. R: A language and environment for statistical computing. R Foundation for Statistical Computing, Vienna, Austria. [online]: Available ww.R-project.org/.
Rugolo LJ, Pengilly D, Macintosh R, and Gravel K. 2005. Reproductive potential and life history of snow crabs in the eastern Bering Sea In Bering Sea snow crab fishery restoration research. Edited by D. Pengilly. Alaska Department of Fish and Game, Juneau, AK. pp. 57–324.
Sainte-Marie B, and Hazel F. 1992. Moulting and mating of snow crabs, Chionoecetes opilio (O. Fabricius), in shallow waters of the northwestern Gulf of St. Lawrence. Canadian Journal of Fisheries and Aquatic Sciences, 49(7): 1282–1293.
Sainte-Marie B, Raymond S, Brêthes JC. 1995. Growth and maturation of the benthic stages of male snow crab, Chionoecetes opilio (Brachyura: Majidae). Canadian Journal of Fisheries and Aquatic Sciences, 52(5): 903–924.
Sainte-Marie B, Sêvigny JM, and Gauthier Yves. 1997. Laboratory behavior of adolescent and adult males of the snow crab (Chionoecetes opilio) (Brachyura: Majidae) mated noncompetitively and competitively with primiparous females. Canadian Journal of Fisheries and Aquatic Sciences, 54(2): 239–248.
Sainte-Marie B, Gosselin T, Sêvigny JM, and Urbani N. 2008. The snow crab mating system: Opportunity for natural and unnatural selection in a changing environment. Bulletin of Marine Science, 83(1): 131–161.
Scott DW. 1992. Kernel Density Estimators. In Multivariate Density Estimation: Theory, Practice and Visualization. John Wiley & Sons, Inc., New York. pp. 125–193.
Siddon CE, and Bednarski JA. 2010. Variation in size at maturity of two species of Tanner crab in southeastern Alaska, USA. In Biology and management of exploited crab populations under climate change. University of Alaska Sea Grant Program report No. 10-01. pp. 283–294
Somerton DA. 1980. A computer technique for estimating the size of sexual maturity in crabs. Canadian Journal of Fisheries and Aquatic Sciences, 37(10): 1488–1494.
Somerton DA. 1981. Regional variation in the size of maturity of two species of Tanner crab (Chionoecetes bairdi and C. opilio) in the eastern Bering Sea, and its use in defining management subareas. Canadian Journal of Fisheries and Aquatic Sciences, 38(2): 163–174.
Stevens BG, Donaldson WE, Haaga JA, and Munk JE. 1993. Morphometry and maturity of paired Tanner crabs, Chionoecetes bairdi, from shallow- and deepwater environments. Canadian Journal of Fisheries and Aquatic Sciences, 50(7): 1504–1516.
Stockhausen WT. 2021. 2021 stock assessment and fishery evaluation report for Tanner crab fisheries of the Bering Sea and Aleutian Islands Regions. In: Stock assessment and fishery evaluation report for the king and Tanner crab fisheries of the Bering Sea and Aleutian Islands regions. 2021 Final Crab SAFE. North Pacific Fishery Management Council, Anchorage, Alaska.
Tamone SL, Adams MM, and Dutton JM. 2005. Effect of eyestalk-ablation on circulating ecdysteroids in haemolymph of snow crabs, Chionoecetes opilio: physiological evidence for a terminal molt. Integrative and Comparative Biology, 45(1): 166–171.
Tamone SL, Taggart SJ, Andrews AG, Mondragon J, and Nielsen JK. 2007. The relationship between circulating ecdysteroids and chela allometry in male Tanner crabs: evidence for a terminal molt in the genus Chionoecetes. Journal of Crustacean Biology, 27(4): 635–642.
Turner TR. 2000. Estimating the propagation rate of a viral infection of potato plants via mixtures of regressions. Applied Statistics, 49(3): 371–384.
Warren WG. 1994. Maturity and molt status of Crustacea: determining classification without prior criteria. Canadian Journal of Fisheries and Aquatic Sciences, 51(2): 408–416.
Zheng J. 2008. Temporal changes in size at maturity and their implications for fisheries management for eastern Bering Sea Tanner crab. Journal of Northwest Atlantic Fisheries Science, 41: 137–149.
Zheng J, and Pengilly D. 2011. Overview of proposed harvest strategy and minimum size limits for Bering Sea District Tanner crab. Alaska Department of Fish and Game, Special Publication No. 11-02, Anchorage, AK.

Supplementary material

Supplementary Material 1

Information & Authors

Information

Published In

cover image FACETS
FACETS
Volume 7Number 1January 2022
Pages: 1598 - 1616
Editor: Tanzy Love

History

Received: 23 May 2021
Accepted: 2 September 2022
Version of record online: 22 December 2022

Data Availability Statement

Data are available upon request. Please direct any such request to author at [email protected].

Key Words

  1. Chionoecetes bairdi
  2. morphometric maturity
  3. maturity classification
  4. Bering Sea
  5. bimodal distribution
  6. distribution minima

Sections

Subjects

Plain Language Summary

A novel morphometry-based method for assessing maturity in male Tanner crab

Authors

Affiliations

Jonathan I. Richar [email protected]
Kodiak Laboratory, Alaska Fisheries Science Center, National Marine Fisheries Service, National Oceanic and Atmospheric Administration, 301 Research Court, Kodiak, AK 99615, USA
Robert J. Foy
Alaska Fisheries Science Center, National Marine Fisheries Service, National Oceanic and Atmospheric Administration, 17109 Pt. Lena Loop Road, Juneau AK 99801, USA

Author Contributions

All conceived and designed the study.
JIR performed the experiments/collected the data.
JIR analyzed and interpreted the data.
All contributed resources.
JIR drafted or revised the manuscript.

Competing Interests

The authors declare there are no competing interests.

Funding Information

No funding was received for this research—all effort was conducted as part of normal position duties.

Metrics & Citations

Metrics

Other Metrics

Citations

Cite As

Export Citations

If you have the appropriate software installed, you can download article citation data to the citation manager of your choice. Simply select your manager software from the list below and click Download.

There are no citations for this item

View Options

View options

PDF

View PDF

Get Access

Media

Media

Other

Tables

Share Options

Share

Share the article link

Share on social media