Introduction
Physiological definitions of maturity are unlikely to be useful in this context. While male Tanner crabs may become physiologically mature, and begin producing spermatophores at a carapace width (CW) of 50–60 mm, functional maturity, when a crab is actually able to successfully complete the mating act, generally occurs at larger carapace sizes (>60 mm;
Adams 1982;
Paul et al. 1983;
Stevens et al. 1993). This disconnect between physiological and functional maturity means that any index based on physiological maturity would likely overestimate reproductive potential.
A terminal molt to morphometric maturity poses several concerns for fishery managers. Fisheries may remove sexually mature, morphometrically immature, males from the stock before they have attained full reproductive competency. Conversely, crabs that reach morphometric maturity below the legal size limit will never be available to the fishery (
Conan and Comeau 1986). Further, these small but morphometrically mature males may impose genetic drift on the stock, leading to a general reduction in size at terminal molt and an increasing proportion of males that will never attain either legal or industry-preferred size (
Sainte-Marie et al. 2008). Finally, maturity at size estimates are an important data input for calculating mature male biomass in the stock assessment (
Stockhausen 2021). For these reasons, and because size at maturity may vary interannually due to environmental factors (
Burmeister and Sainte-Marie 2010;
Dawe et al. 2012), it is important that size at maturity is assessed annually to facilitate optimal management, and to monitor for sustained shifts in size at maturity.
Morphometric measurements are nonlethal, can easily be conducted in the field environment, and may be used to identify mature individuals in crustaceans (e.g.,
Brown and Powell 1972;
Donaldson et al. 1981;
Conan and Comeau 1986;
Pinheiro and Fransozo 1998;
Jadamec et al. 1999;
Fernández-Vergaz et al. 2000). In the case of
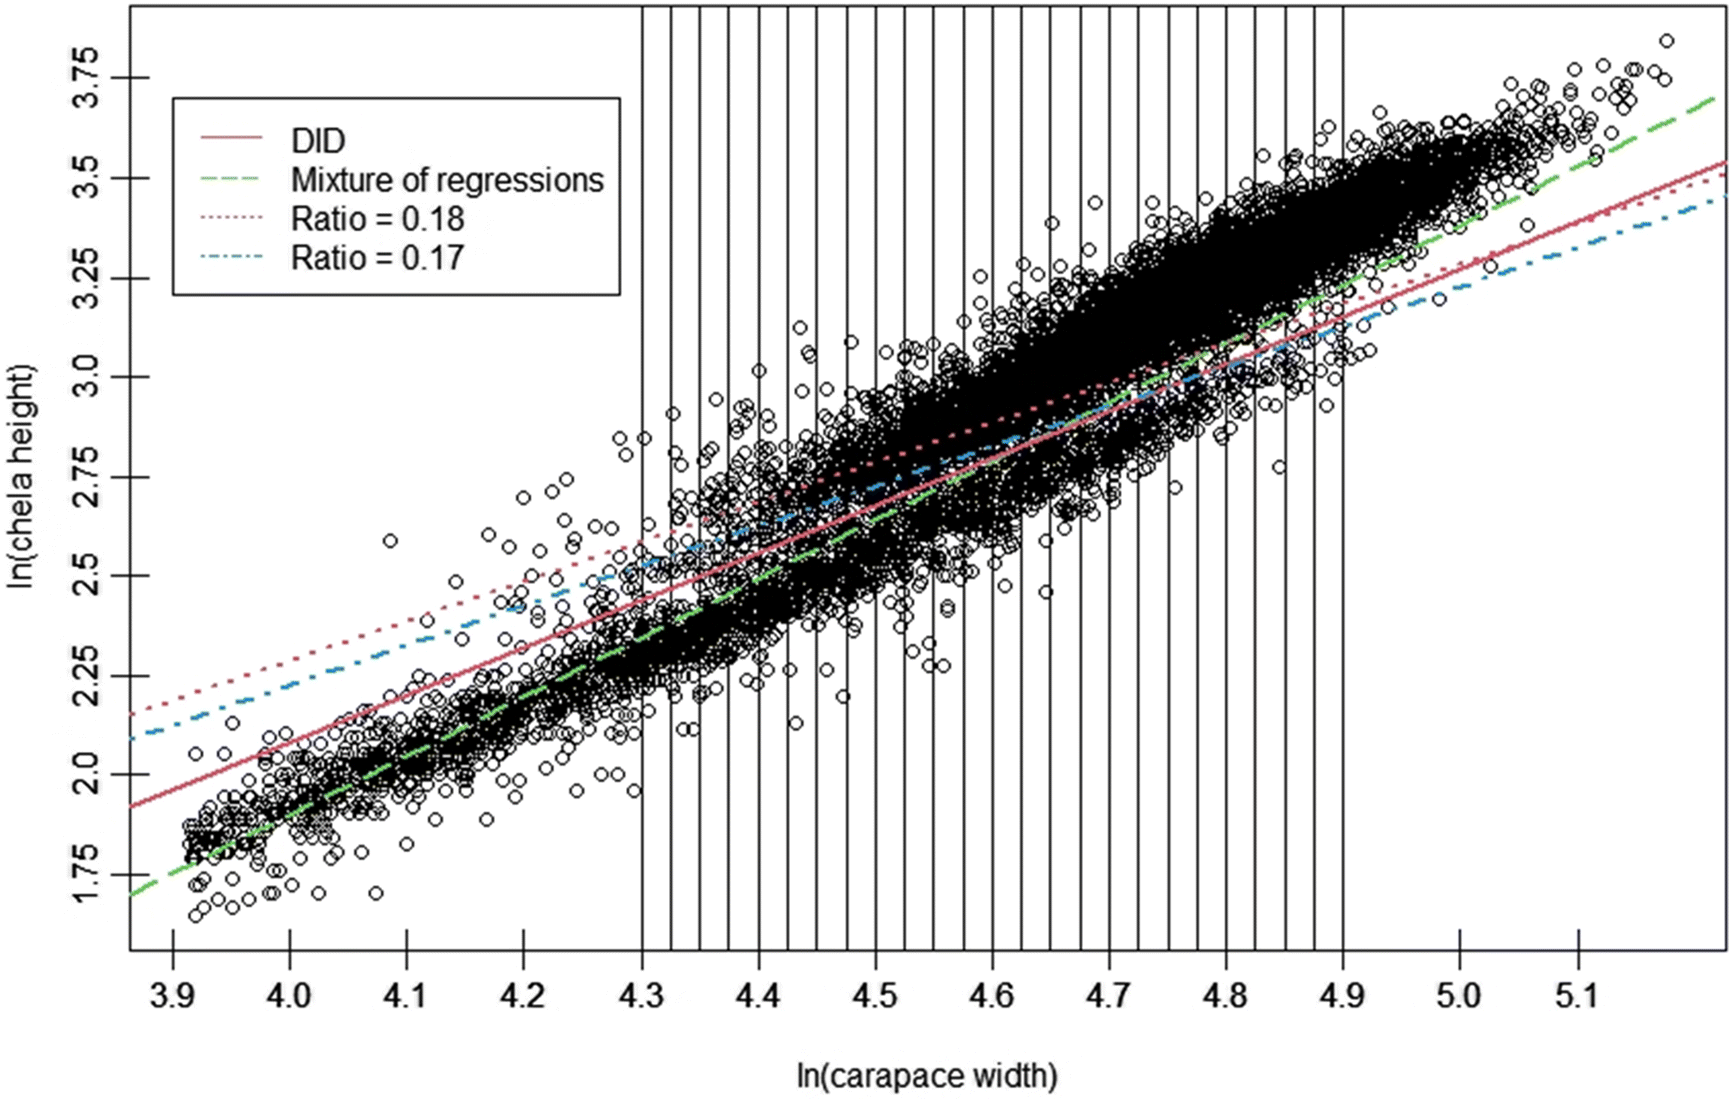
Chionoecetes spp., the disproportionate increase in CH relative to CW with the terminal molt suggests an intuitive way to distinguish immature and mature males in a population, as it drives the bifurcation of data into two “clouds”, an upper cloud representing morphometrically mature, large-clawed crab, and a lower cloud representing small-clawed, immature crab (
Fig. 1). Over the past three decades, multiple procedures have been developed to exploit this morphometric difference, with varying levels of statistical rigor (e.g.,
Somerton 1980;
Conan and Comeau 1986;
Stevens et al. 1993;
Warren 1994).
Although these procedures can be effective, they are not without shortcomings. A notable issue with methods commonly applied for
Chionoecetes spp. crabs, such as the program MATURE (
Somerton 1980) and Discriminant Function Analysis (DFA;
Conan and Comeau 1986;
Sainte-Marie and Hazel 1992;
Sainte-Marie et al. 1995), is the requirement for
a priori classification of crabs within a sample into groups with a known maturity status via other preliminary means (e.g., visual testes assessment). Consequently, these procedures may be problematic to apply in cases where the investigator lacks samples with known maturity statuses from which initial conditions for the given classifier may be derived (
Warren 1994;
Rugolo et al. 2005). In response, mixture of regressions procedures have been developed and applied to crustacean data for maturity classification on an exploratory basis (
Warren 1994;
Turner 2000;
Rugolo et al. 2005;
Murphy 2019). This approach, however, requires carefully selected initial values for the model parameters, and the investigator may be required to follow an iterative analysis process involving many runs, capped by a subjective decision as to the final “best fit”. Finally, some authors have employed the ratio of CH to CW to classify mature males (
Stevens et al. 1993;
Tamone et al. 2005;
Tamone et al. 2007). Although this procedure offers the dual advantages of being both intuitively simple and computationally easy to apply, variability in the CH/CW ratio, both within and among years, leads to crabs on the lower extreme of the morphometrically mature cloud, and upper extreme of the immature cloud being likely to be misclassified (
Rugolo et al. 2005). Complicating matters, the rate at which this occurs itself varies interannually across the time series (
Rugolo et al. 2005).
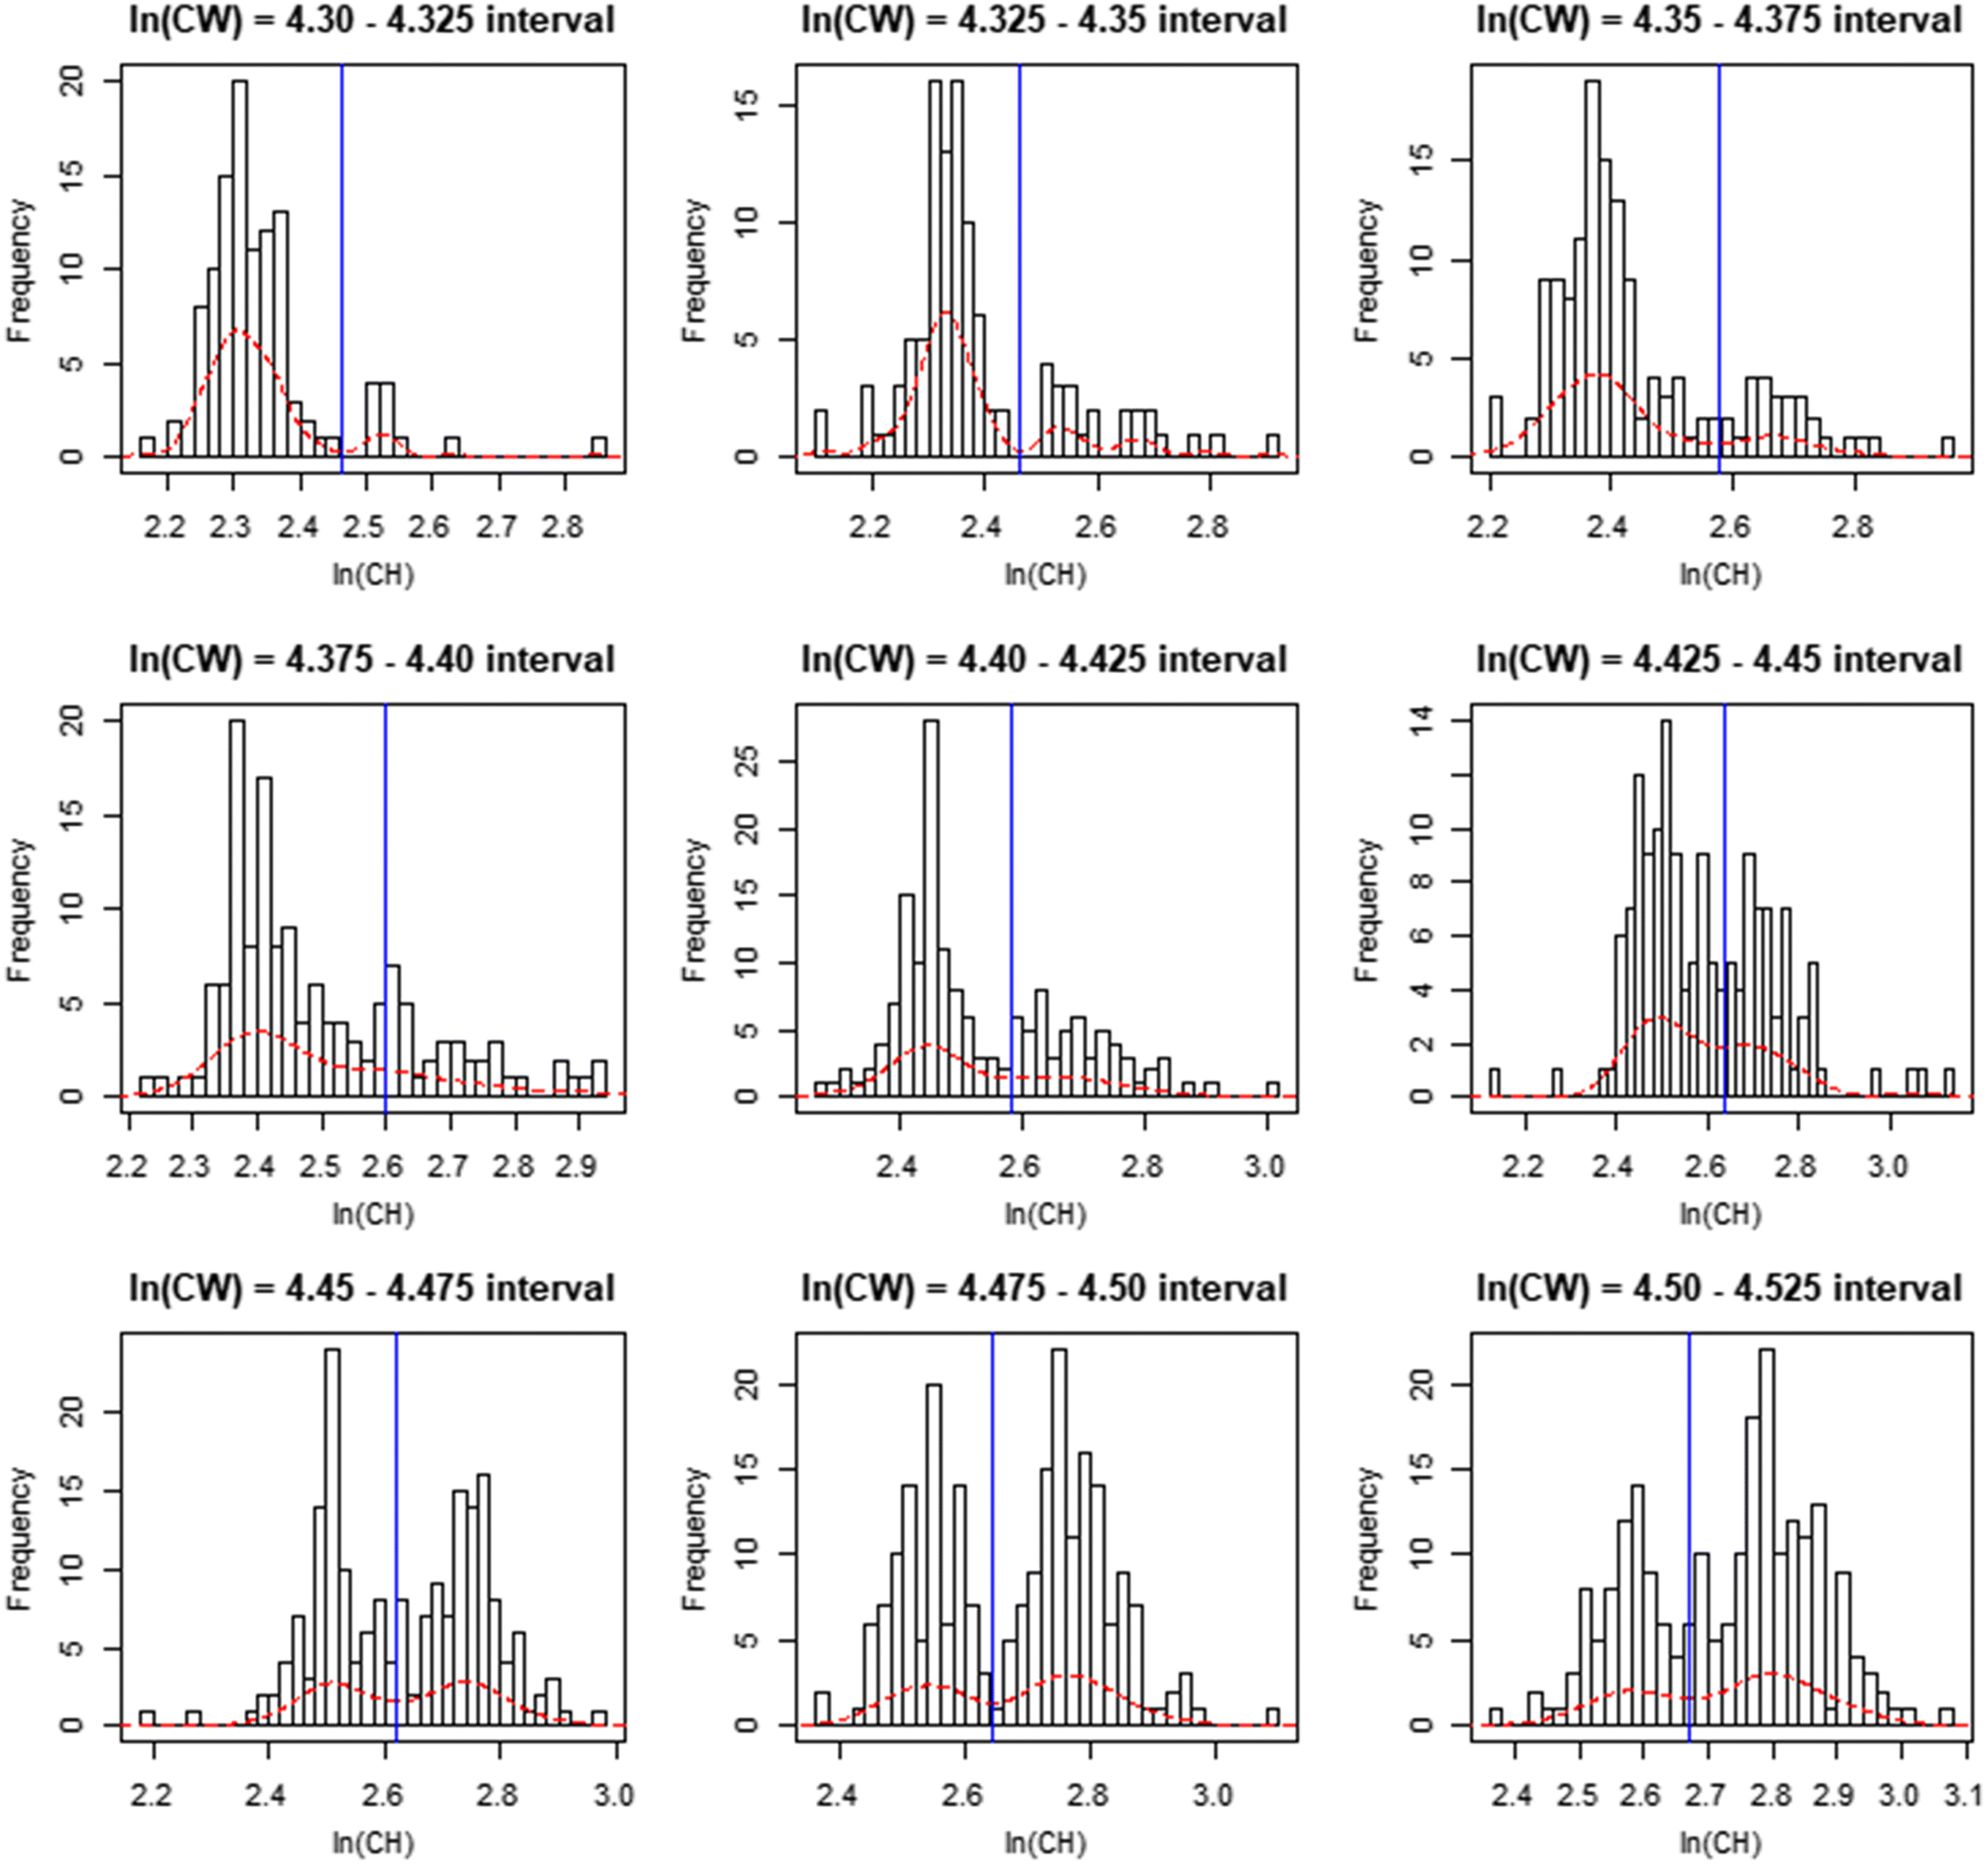
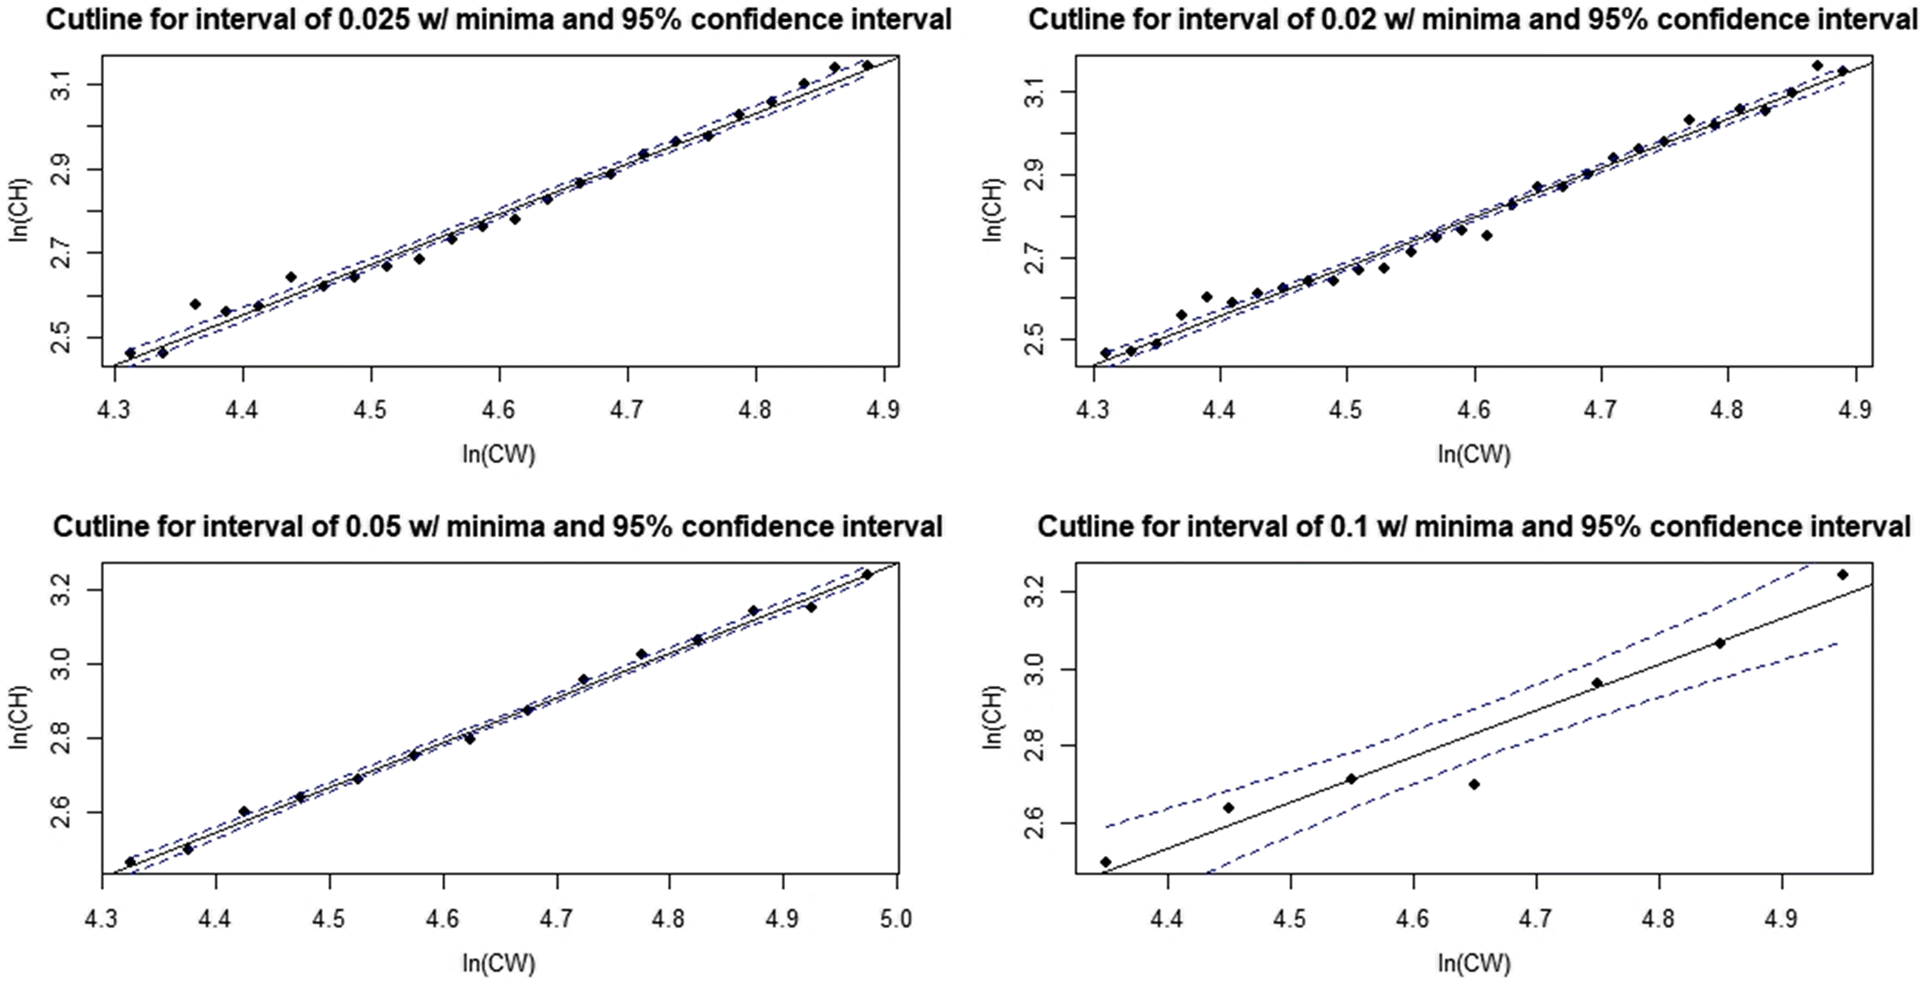
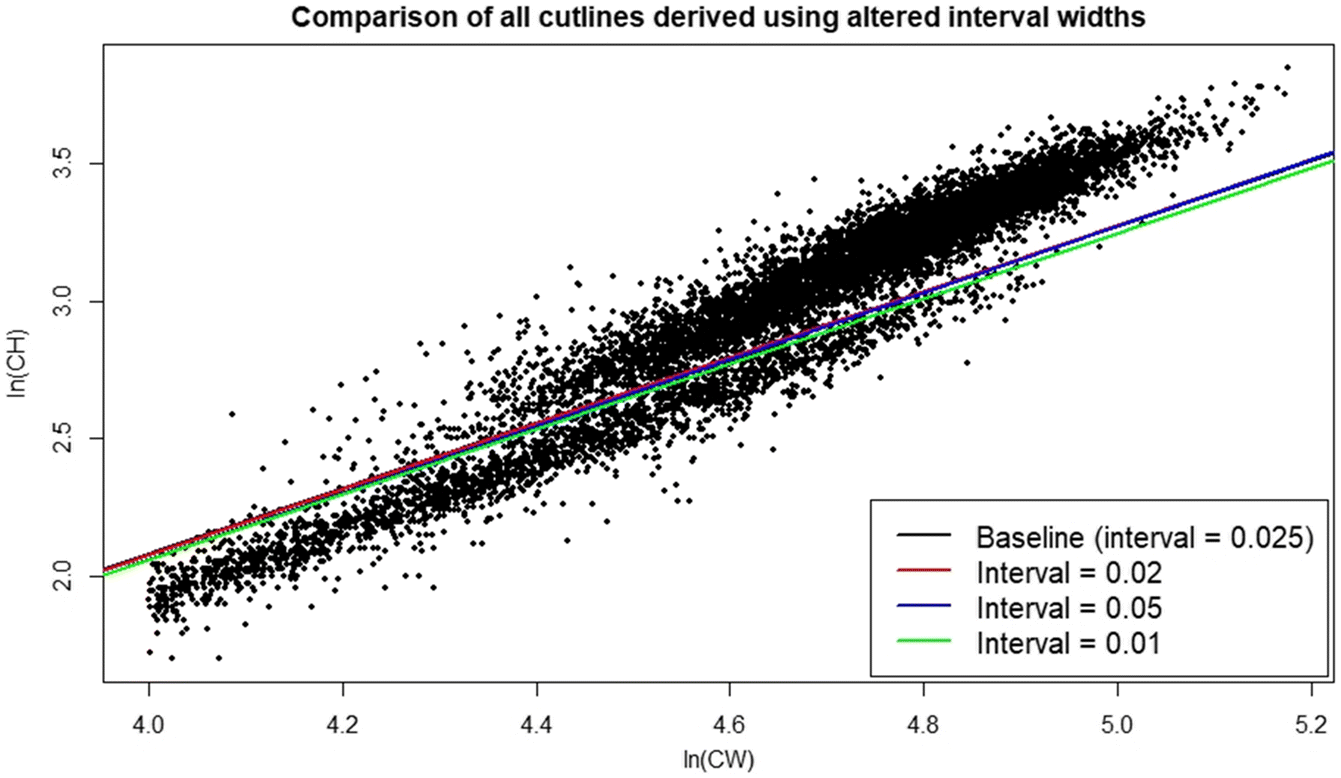
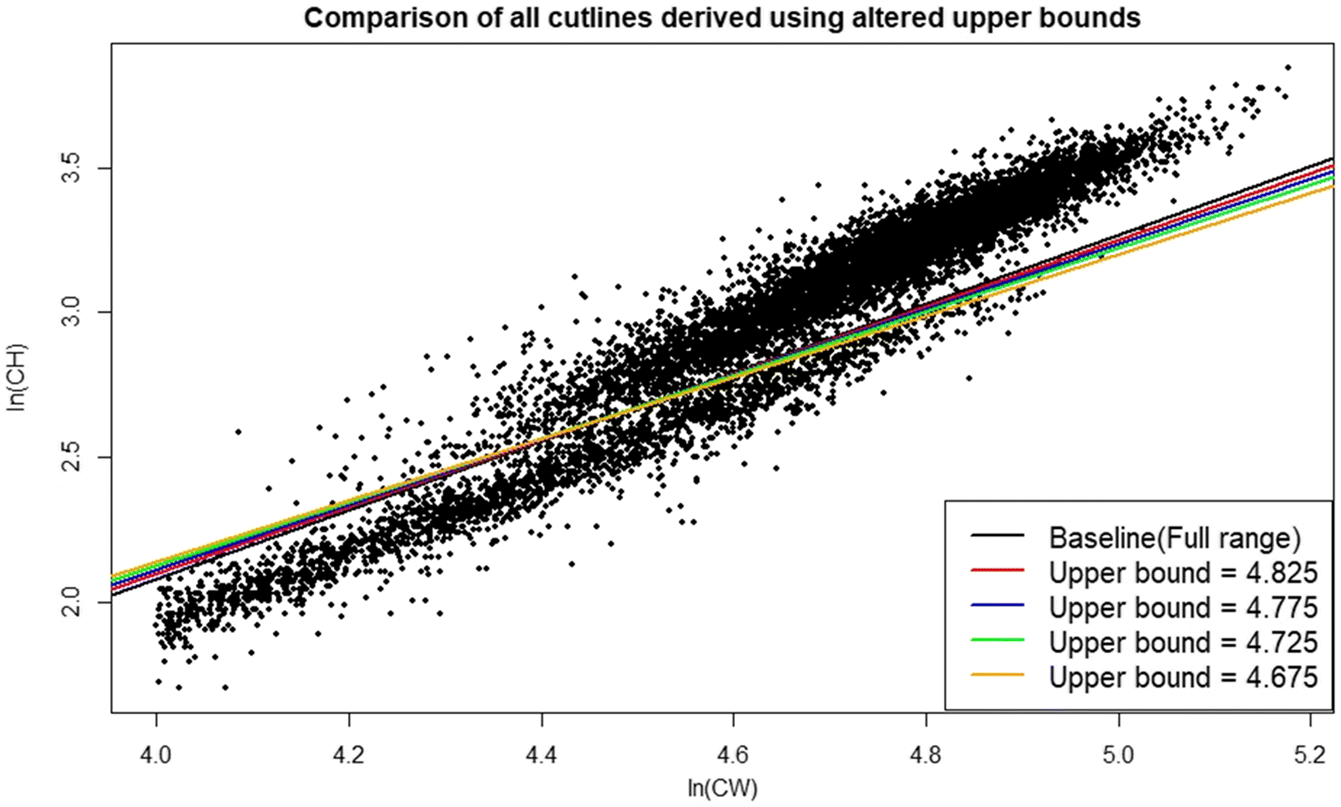
In this paper, we outline a novel procedure; the distribution interval derived (DID) maturity cutline, which addresses issues identified with existing procedures for defining classification cutlines. We then provide basic comparisons of the performance of this new method relative to existing methodologies. Finally, we apply this procedure to calculate annual male size-at-maturity estimates for the eastern and western stocks of Tanner crabs in the eastern Bering Sea (EBS).
Discussion
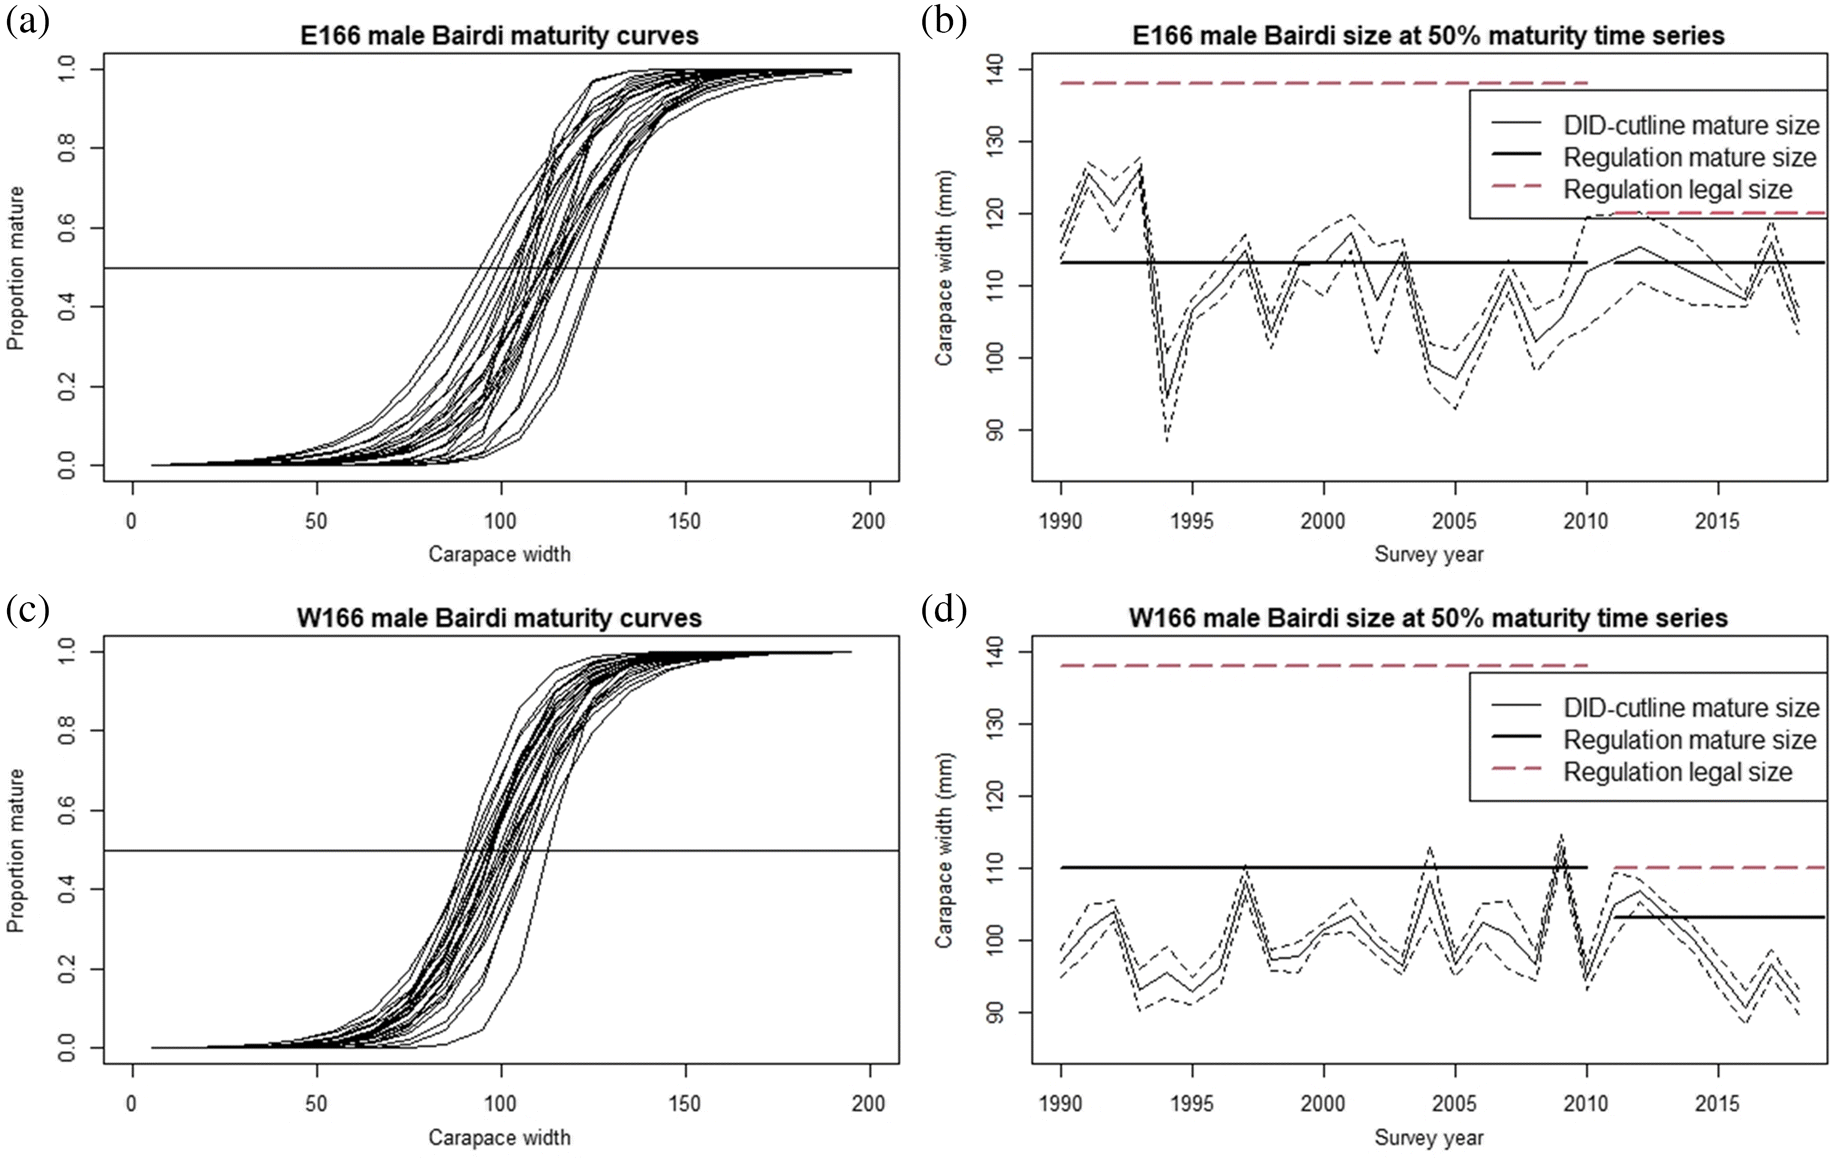
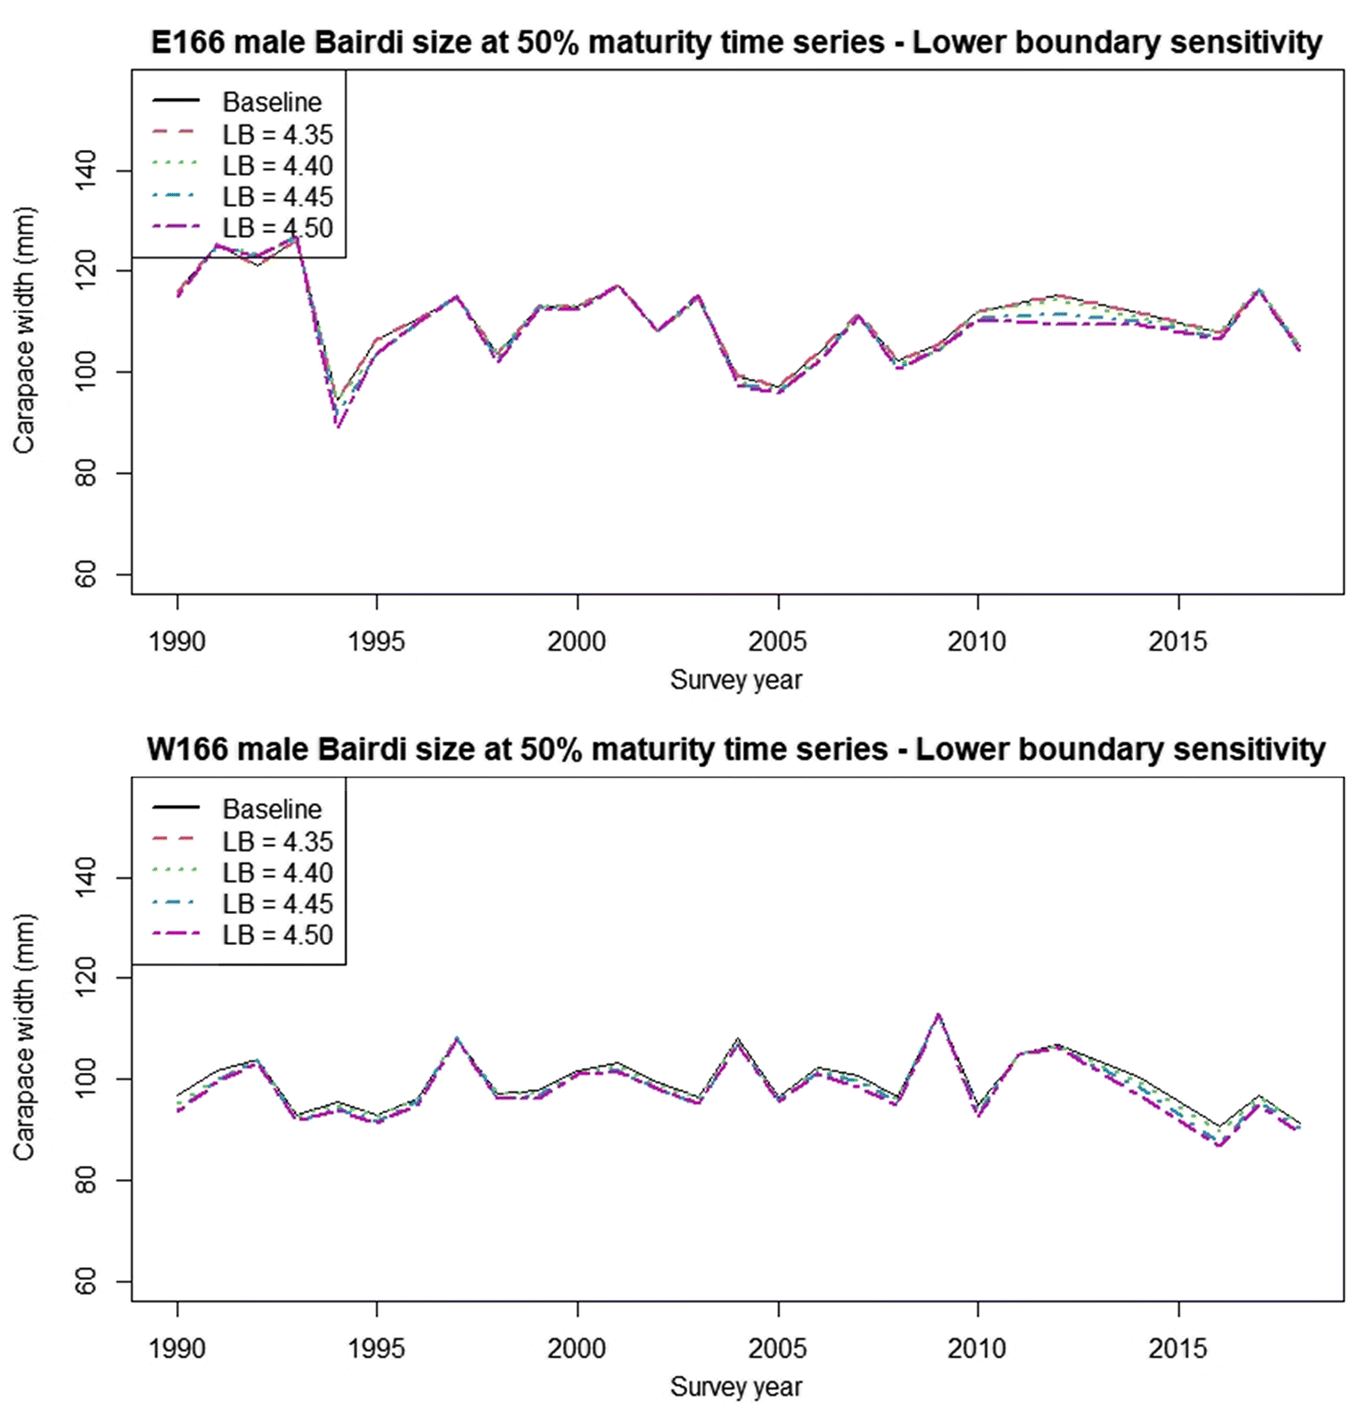
In this paper, we demonstrated a novel procedure for defining a maturity classification cutline for crustaceans. This procedure employs analysis of CH distributions across a range of CW intervals within the region of overlap between the data “clouds” taken to represent morphometrically mature and morphometrically immature male crabs. We compared basic performance of this procedure against established procedures based on the ratio of CH to CW, and a mixture of regressions model. Finally, we employed our cutline to calculate size at 50% maturity for Tanner crabs within the eastern and western management districts of the eastern Bering Sea. Our procedure was found to be competitive with established methods for classifying morphometric maturity in crabs. Results of our initial analytical application demonstrated significant interannual variability in male size at maturity, and suggested the existence of issues with current management tools for these stocks. The most noteworthy of these is the mismatch between our estimated size at maturity estimates for a population that terminally molts, and the legal retention size for males in state harvest strategies, which suggests the potential of genetic drift may exist.
The DID cutline permitted effective classification of morphometrically mature male Tanner crabs and maintained effectiveness across crab pseudocohorts, demonstrating reduced susceptibility to variance in crab allometric growth patterns arising from either endogenous or exogenous factors, or both, relative to other methods (
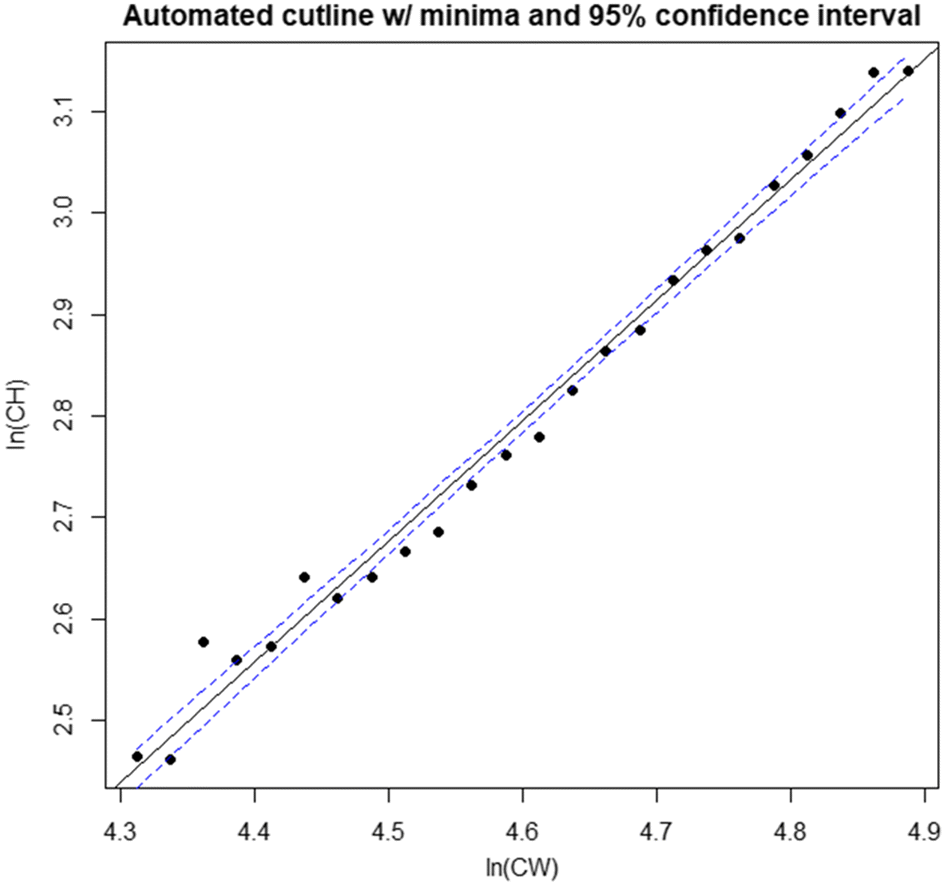
Rugolo et al. 2005). The DID approach offers the additional benefit of being scalable based on the availability of data—the investigator may choose as many, or as few, intervals as the data permit. Furthermore, its application is comparatively user friendly and straightforward, facilitating use by the wider fishery research community. It is recommended that if used, distributions should be drawn from the full region of overlap between data point “clouds”. If the investigator wishes to optimize their interval selection process, linear model confidence intervals provide a good metric for comparison between models derived using different numbers of intervals, with the smallest CI indicating the “best” interval for use.
Operationally, within the region of overlap between the data “clouds”, the DID approach demonstrated reduced rates of likely classification errors at smaller CW values relative to the competing approaches tested, which would otherwise lead to errors in estimates of maturity. In the case of the mixture-of regressions approach, the observed tendency to classify smaller, small-claw crab as being mature lead to consistent underestimates of size at maturity relative to the other procedures. If these maturity estimates were then employed to calculate estimates of the mature male population, these estimates would be markedly larger than would seem likely to actually be the case. The application of a stringent size cut-off in data being analyzed using mixture of regressions may help to alleviate the issue somewhat. However, this is not a perfect solution, as seen in our case where the same cutoff used for the DID approach was not sufficient. It is important to note that the use of this cutoff in the DID method was more a formality than an ironclad requirement to maintain analytical validity.
This issue also seems apparent in other applications of the mixture of regressions approach, and is thus not an artifact of our specific implementation (
Murphy 2019). While the DID cutline does classify more large CW, small-clawed crabs as being mature than the mixture of regressions cutline, this error is much easier to resolve during the analysis process than when small CW small-clawed crabs as classed as mature, not least because these cases will be much more apparent. In the eventuality that these crabs are missed during error checking, they should have minimal effect on maturity calculations.
Conversely, the relatively large number of smaller, large-clawed males that are classified as immature by both of the ratio-based approaches leads to comparatively large estimates of size at maturity for both, which were consistent across the entire time series analyzed. Applied for population estimation purposes, these would lead to reduced estimates of the mature male component relative to those derived using the DID and mixture of regressions procedures. Of the two, R18, which is the ratio most often seen used for Bairdi, consistently gave the largest size at maturity estimates (
Tamone et al. 2007). If fishery managers employed these estimates, they would potentially lead to especially conservative management decisions. Furthermore, use of these cutlines in research may lead to, amongst other concerns, overestimates of the prevalence of skip-molting, a phenomenon whereby immature crabs skip a molt, as small, old-shell large-claw crab would be classed as being immature.
The DID approach bears some similarities to the procedures employed by the MATURE program (
Somerton 1980;
Zheng 2008). Notably, both approaches use fitting a line through a continuous region of minimal data density to create the final cutline; however, they differ in the steps taken prior to that. As previously noted, MATURE requires inputs for known mature and immature crab, from which groups initial classifier lines are defined. These lines are then extended into a region of overlap by iteratively assigning points in this region to the nearest classifier line and re-estimating the classifier until no points switch lines (
Somerton 1980). The average of these two classifiers is then taken as an initial cutline, and this is then vertically translated within the bounds of the two classifiers until an elevation is found that results in the fewest observations within its region (
Somerton 1980;
Zheng 2008). In contrast, the DID approach proceeds directly to identifying the regions of minimal density once density intervals have been specified, and then immediately uses these to create the cutline.
From a statistical perspective, in comparison to the multiple-regression approach, the DID approach does not inherently calculate certain useful auxiliary information, such as group membership likelihoods by data point. Although, based on the distribution modeling procedures used, such information may be extracted on an interval-by-interval basis from the calculated distributions. We acknowledge that a weakness in the work we have presented herein is the minor curvilinearity observed in our data and the distribution minima series calculated from it. Consequently, as a next step, exploration of the use of limited nonlinear modeling may be appropriate. Our approach of fitting a model to a sequence of distribution minima lends itself to such investigations. If successful, in addition to potentially providing a better performing and more accurate cutline, this may also allow for the elimination of the requirement that data be natural log-transformed prior to analysis. This approach will be explored as a possible refinement of the DID procedure in future research.
Spatiotemporal variability in annual size at maturity in SC2 male
Chionoecetes spp., as was observed here and in previous work (
Somerton 1981;
Otto and Pengilly 2002;
Zheng 2008), may arise through several processes, acting either singly or in concert, and doing so on multiple crab pseudocohorts. Environmental conditions, particularly water temperature, have a pronounced effect on crab growth and size at maturity, primarily through reducing molting frequency, and thus increasing age-at-instar, and reducing the number of molts before terminal molt (
Somerton 1981;
Burmeister and Sainte-Marie 2010;
Dawe et al. 2012). Density-dependent effects have also been observed in male
Chionoecetes spp., primarily via mating competition, which has been hypothesized to delay the terminal molt, and thus increase the size at terminal molt (
Elner and Beninger 1995;
Comeau et al. 1998).
An observation of note is that in many years our size at 50% maturity estimates were well below the regulation legal retention sizes for both districts (
Lang et al. 2018). Given that male Tanner crabs are not likely to grow following their terminal molt, the present fisheries are harvesting from a limited segment of the genetic population--that with traits favoring growth to larger sizes, potentially imposing size-selectivity on the population. This carries the possibility of imposing harvest-induced evolution if it continues across multiple generations, leading to issues including decreased size at terminal molt, reduced mature biomass, and reduced genetic diversity, which may itself lead to reductions in stock adaptability (
Sainte-Marie et al. 1995;
Carver et al. 2005;
Zheng 2008;
Enberg et al. 2009). The decrease in size at maturity observed in the western district since 2012 suggests that this may already be occurring. Further research into this issue, and careful monitoring in future years should be a priority.
An additional priority for future research should be applying the methods of
Tamone et al. (2007) to the EBS region. This would provide a baseline “known” estimate for actual terminal molt/morphometric maturity against which estimates derived from allometric-based procedures might be compared to establish rates of actual bias/misclassification in estimates, rather than the relative rates as described in this paper.
