A novel energy-saving method for campus wired and dense WiFi network applying machine learning and idle cycling techniques
Abstract
University campus networks need wired (ethernet) and dense wireless fidelity networks that have devices like access points, switches, and routers that are always turned on. Consequently, they generate two important problems: the energy bill and the influence of carbon dioxide into the atmosphere. Energy savings are the solution to those problems. There are several proposals to augment the energy savings separately in ethernet and wireless fidelity, but there is no integrated method to simultaneously reduce them in both parts of the networks. Our novel method combines idle cycling and machine learning techniques to efficiently obtain energy savings in both parts of the network simultaneously. We categorize network devices into two groups: (a) those that are always turned on and (b) those that can be dynamically turned on or off based on network performance. We formulated two algorithms that decide when to turn on and off access points. We use Ward's machine learning hierarchical clustering technique to optimize the energy savings of our model in the network of the Unidades Tecnológicas de Santander (Bucaramanga, Colombia). We showed that energy savings of 21.5 kWh per day are possible. The success of the model in this context highlights its potential to achieve substantial energy savings.
1. Introduction
These days, infrastructure wireless fidelity (WiFi) is the most used technology for local area networks (LANs) and for connecting wireless terminals to the Internet. A wide-area campus dense WiFi network is integrated by thousands of access points (APs) and hundreds to thousands of wireless terminals (portable and desktop computers, tablets, mobile telephones, sensors, etc.) growing every day (Number of Internet Users (2016)—Internet Live Stats, s. f.) around the world (Yu et al. 2017). Part of an infrastructure WiFi network are wired devices such as switches (SW) for commuting communication messages among APs and routers (Rs) for end-to-end routing. Regularly, users turn on and turn off wireless terminals on their own. In contrast, APs, SWs, and Rs commute between two modes of energy consumption: active (high level of energy consumption) and sleeping (low level of energy consumption) under network staff administration. As an example, a regular AP consumes between 4 and 22 W (UniFi—PoE Availability and Modes, s. f.). In consequence, the energy consumption of a dense WiFi network could be very high. Three examples of energy consumption in a wide-area campus network are as follows: the superior education institutions like Unidades Tecnológicas de Santander (UTS) integrated 204 APs, 13 SWs, and 2 Rs consuming around 3.5 kWh or 84 kWh in 1 day (in slots of time when it is deeply used); the University of Michigan (Hetting 2022) integrated by 16 000 APs, 350 SWs, and 5 Rs, consuming 1500 KWh; and the University of Beihang in Pekin (Fang et al. 2018) integrated 8000 APs, 180 SWs, and 4 Rs, consuming around 800 KWh. That high energy consumption is translated into high economic costs and a contribution to the increase of green house gas (GHG) emissions that have harmful effects on human health (Benhamaid et al. 2022). Reducing energy consumption by efficiently managing energy savings in dense WiFi network devices avoids the unnecessary sending of tons of carbon dioxide (CO2) into the atmosphere and helps to reduce GHG emissions (Davis 2011). Moreover, energy savings improve the image of organizations, and in some states of the European Union, this implies tax incentives (Ruiz s. f.).
Authors like Casademont et al. (2019) use specialized devices to detect idling APs (those that do not carry traffic during some slots of time), which increase the economic cost of the network. Other authors, like Silva et al. (2019), propose to change the transmission and reception settings of APs, compromising network efficiency and resulting in reduced energy savings. APs of university wide-area campus networks could not carry traffic for long periods of time (i.e., 12 hours). Applying any idle cycling techniques allows for efficient energy savings. A cyclic interval scheduling technique for data transmission in sensor networks is proposed in Tripathi et al. (2022), but it cannot be directly applied to dense WiFi networks. In our previous work, we applied that technique to optimize the energy consumption of APs using a battery to efficiently obtain energy savings (García García Baquerizo et al. 2019). The recent success of machine learning has led some authors to explore its use in energy savings in APs combined with idle cycling (Fang et al. 2018; Yang et al. 2023), which in general affects network availability. To our knowledge, we are the first to apply a combination of machine learning algorithms and idle cycling techniques for implementing energy savings in the APs, SWs, and Rs of the university wide-area campus networks. We have designed a clustering strategy to group related APs, SWs, and Rs that could simultaneously be configured as a virtual LAN (VLAN) and carry traffic under a pre-defined threshold. If that condition is met, then that group of devices will be turned off in a predefined set of slots of time. The threshold and the set of slots of time are generated after a previous intelligent characterization of the cyclic traffic patterns in the network.
The main contributions of this paper are the following:
•
Novel algorithms to turn on and turn off the APs: We classify the network devices (APs, SWs, and Rs) into two sets: those that are always turned on and those that can be turned on and off. Two algorithms decide when to turn on and off (for a set of slots of time) the APs, considering the network traffic thresholds, their congested neighbors APs, and wireless terminal trajectories.
•
A new mathematical model for the specification of energy savings in the entire network (APs, SWs, and Rs): A smart but general matrix notation is created to specify the conditions under which energy savings can be achieved. We specify a general clustering strategy of APs, SWs, and Rs that derives from a mathematical optimization problem.
•
Implementation and experimental verification of the algorithms: The above energy savings optimization could be reached using any machine learning technique; moreover, the input of the two above algorithms is real network traffic traces to discover cyclic traffic patterns with machine learning methods. We implemented the two algorithms and verified that significant energy savings can be obtained using a particular machine learning clustering standard method that is efficient and very simple to implement in front of other similar methods. We obtained 25% (21.5 kWh in a day) of energy consumption without affecting network availability, which does not affect the quality of the user experience.
The paper is organized as follows. Section 2 discusses related work. Section 3 explains the proposed model and the algorithm to turn on and turn off the APs. Section 4 presents experimental results: first some key parameters are discussed, and then the execution of the implemented software is shown on a particular university wide-area dense WiFi and wired network. Discussions are presented in Section 5. Finally, the conclusions are presented in Section 6.
2. Related work
Two standards for energy savings in wireless WiFi terminals are as follows. (a) The IEEE 802.11ac implements the power save mode (PSM), setting the wireless terminals in sleeping mode for several microslots of time (microsleeping) when no communication was carried out in previous time slots (Sidam et al. 2022). Unfortunately, the PSM, in some cases, produces connection losses due to the time needed to start the wireless terminal after a microsleep. (b) The wake-up radio (Caballe et al. 2019; Casademont et al. 2019), whose main inconvenience is the increased complexity and cost of devices needed for its implementation. In this paper, we are not interested in the energy savings on WiFi terminals. Moreover, the energy consumption of the wireless WiFi terminals only affects those universities that permit the user to charge their WiFi terminals using a standard wall socket power supply. Wireless terminals, from the point of view of energy savings management, should be considered as a maximum overall amount of energy consumption, external to the campus network, and treated as such. We focus on the energy savings of network devices controlled directly by the network administrator.
Network paradigms like wireless sensor networks (WSN) and Internet of Things (IoTs) increase dramatically the number of connected terminals (Benhamaid et al. 2022). Their effect is an increase in energy consumption, generating a worrying increase in GHG emissions. The dramatic growth of those paradigms (they are applied massively in campus networks) forced the design and implementation of energy-saving techniques due to the fact that the number of network devices must be increased. But IoT and WSN can be used for implementing energy savings in dense WiFi networks using sensors, actuators, and programmable electronic cards. Benhamaid et al. (2022) and Qu (2022) proposed routing protocols that reroute network traffic and turn off inactive wireless terminals to increase energy savings (Jimenez et al. 2019; Marrero et al. 2019; Dhandapani et al. 2022). García Baquerizo et al. (2019) proposed the use of an Arduino-based electronic circuit to control the dual power supply of WiFi APs: using a traditional via wall socket (alternating current) and a battery (direct current). The objective is to control the efficient charging and discharging of the battery to optimize energy savings. The energy savings obtained were around 20% (compared with the usage of only traditional power supplies). The main inconvenience of those techniques is that the usage of extra devices increases the cost and complexity of the energy savings mechanism. In contrast, we do not use extra devices; we implement our method with standard management software and machine learning software (Oliveira et al. 2021).
Efficient management of required time communication of data (controlling the bandwidth of the wireless channels) allows to augment energy savings (Qu 2022) by varying transmission power standard parameters. The inconvenience of those techniques is the reduced amount of energy savings (10%) compared with the no-application of the technique (Silva et al. 2019). Moreover, the efficiency of communication with the wireless terminals is affected, and the percentage of energy savings is very low compared to other techniques. Our proposed model does not change configurations on network devices that could affect the efficiency of information traffic or the quality of the user experience.
Active sleeping of APs, SWs, and Rs is a traditional technique. For example, Oh et al. (2016) force APs to sleep to save energy on a WiFi network. Two techniques in switched networks to reduce power consumption during idle time intervals are used in Manjate et al. (2018). Another energy savings strategy is presented in Onik et al. (2017), where a device is proposed to be placed before the SWs and turned off at times of low network traffic. Proposals such as Chunyue et al. (2021) consider energy savings in Rs through dynamic control of sleep and wake times. Our method can take advantage of that technique on APs, SWs, and Rs because it is independent of how the administrator of the campus network administers them.
Idle cycling techniques that use microsleep, disable the wireless interfaces, or completely turn off the APs for some slots of time save more power than other strategies and are more economical to implement (Garcia-Morales et al. 2020). We propose the use of an idle cycling technique in which the APs do not carry traffic for some slots of time or they carry traffic under a pre-defined threshold. The objective is to obtain better energy savings than previously reviewed methods. Moreover, microsleep is usually used in modern Ethernet SWs and Rs. But we are interested in the integral coordination of the energy savings in the wide-area campus network according to Lloret et al. (2019) and He et al. (2022), which stated that the energy efficiency of all components of a network (APs, SWs, and Rs) must be optimized to obtain a significant amount of energy savings.
In Parwez et al. (2017), k-means and hierarchical clustering techniques are used to analyze user or wireless terminal information, such as mobility patterns, to develop intelligent algorithms for turning on and off WiFi devices. Similarly, in Esrafilian-Najafabadi and Haghighat (2021) and Yang et al. (2023), they address energy savings in wireless networks by creating models to predict people's movement, location, and length of stay. These approaches that rely on wireless endpoint data, such as mobility, location, or duration of connectivity, to forecast network performance patterns can be prone to inaccuracies. One of these impressions arises when wireless terminals are connected to the network but are not transmitting or receiving data. This results in unnecessary energy consumption, as network devices can be turned off to save power when wireless terminals without throughput are connected. The prediction models for the network behavior presented in Fu and Wang (2022) are subject to errors due to possible changes in the patterns that are not considered in the analysis of the information and require a large amount of historical data to obtain good predictions. Our energy savings model uses actual throughput measurements to determine whether to turn on or off APs, SWs, and Rs. Our approach employs machine learning and clustering techniques, unlike previous methods that used predictive techniques.
Our energy savings method presents an innovative approach to harmonizing the energy savings of APs, SWs, and Rs. We do not alter the standard configurations and parameters of the devices in the network, which avoids any adverse impact on the efficiency of data transmission and on the quality of the user experience. Unlike other energy-saving methods, our method leverages WiFi throughput measurements to determine precisely when devices on the network should be turned on or off. Judiciously selecting a subset of APs to stay always turned on, our method assures network availability even during periods of low or no throughput.
3. Proposed method
Wide-area infrastructure WiFi networks are composed of a large number of wireless terminals, thousands of APs, and hundreds of SWs and Rs. This type of network is installed, for instance, in educational institutions using more than hundreds of access points. Those networks organize the APs, SWs, and Rs hierarchically on several levels (Fig. 1):
1.
The most important characteristic is the wireless terminal and its geographical movements, which determine the AP with which it is associated. We do not focus on the energy savings at this level due to reasons wielded in Section 2.
2.
It consists of WiFi APs. The APs supervise associated wireless terminals and retransmit their communication messages. We distinguish several kinds of APs: A' ≈ { A′1, A′2, … A′p' }: set of the APs that are always turned on to offer coverage in areas where there are wireless terminals such as servers or critical sensors (surveillance), which always evacuate internal data to the Internet. A ≈ { A1, A2, … Ap }: set of the APs that can be turned off in certain slot of time, i.e., during the night, in public places of the campus there will be no students and professors, so those APs covering that area could be turned off all night. Usually, those APs are set to sleep (with low power consumption) all night. In contrast, we plan to turn them all off to maximize energy savings.
3.
The SWs at this level supervise the traffic of the APs that are connected to them. We distinguish two kinds of SWs: S' ≈ { S′1, S′2, … S′s' }: set of the SWs that are always turned on, i.e., those to which any of the are always connected. S ≈ {S1, S2, … Ss}: set of the SWs that can be turned off in certain slots of time. Any can be turned off when all the APs of A connected to it are turned off.
4.
The Rs form this level. We distinguish two kinds of Rs: R' ≈ { R′1, R′2, … R′r' }: this is the set of Rs that are always turned on, i.e., those to which the are always connected. R ≈ { R1, R2, … Rr }: set of Rs that can be turned off in certain slots of time. Any can be turned off when all the Ss of S connected to it are turned off. Let us note that the above hierarchy is valid for any number of sublevels (i.e., two sublevels of SWs or Rs).
Fig. 1.
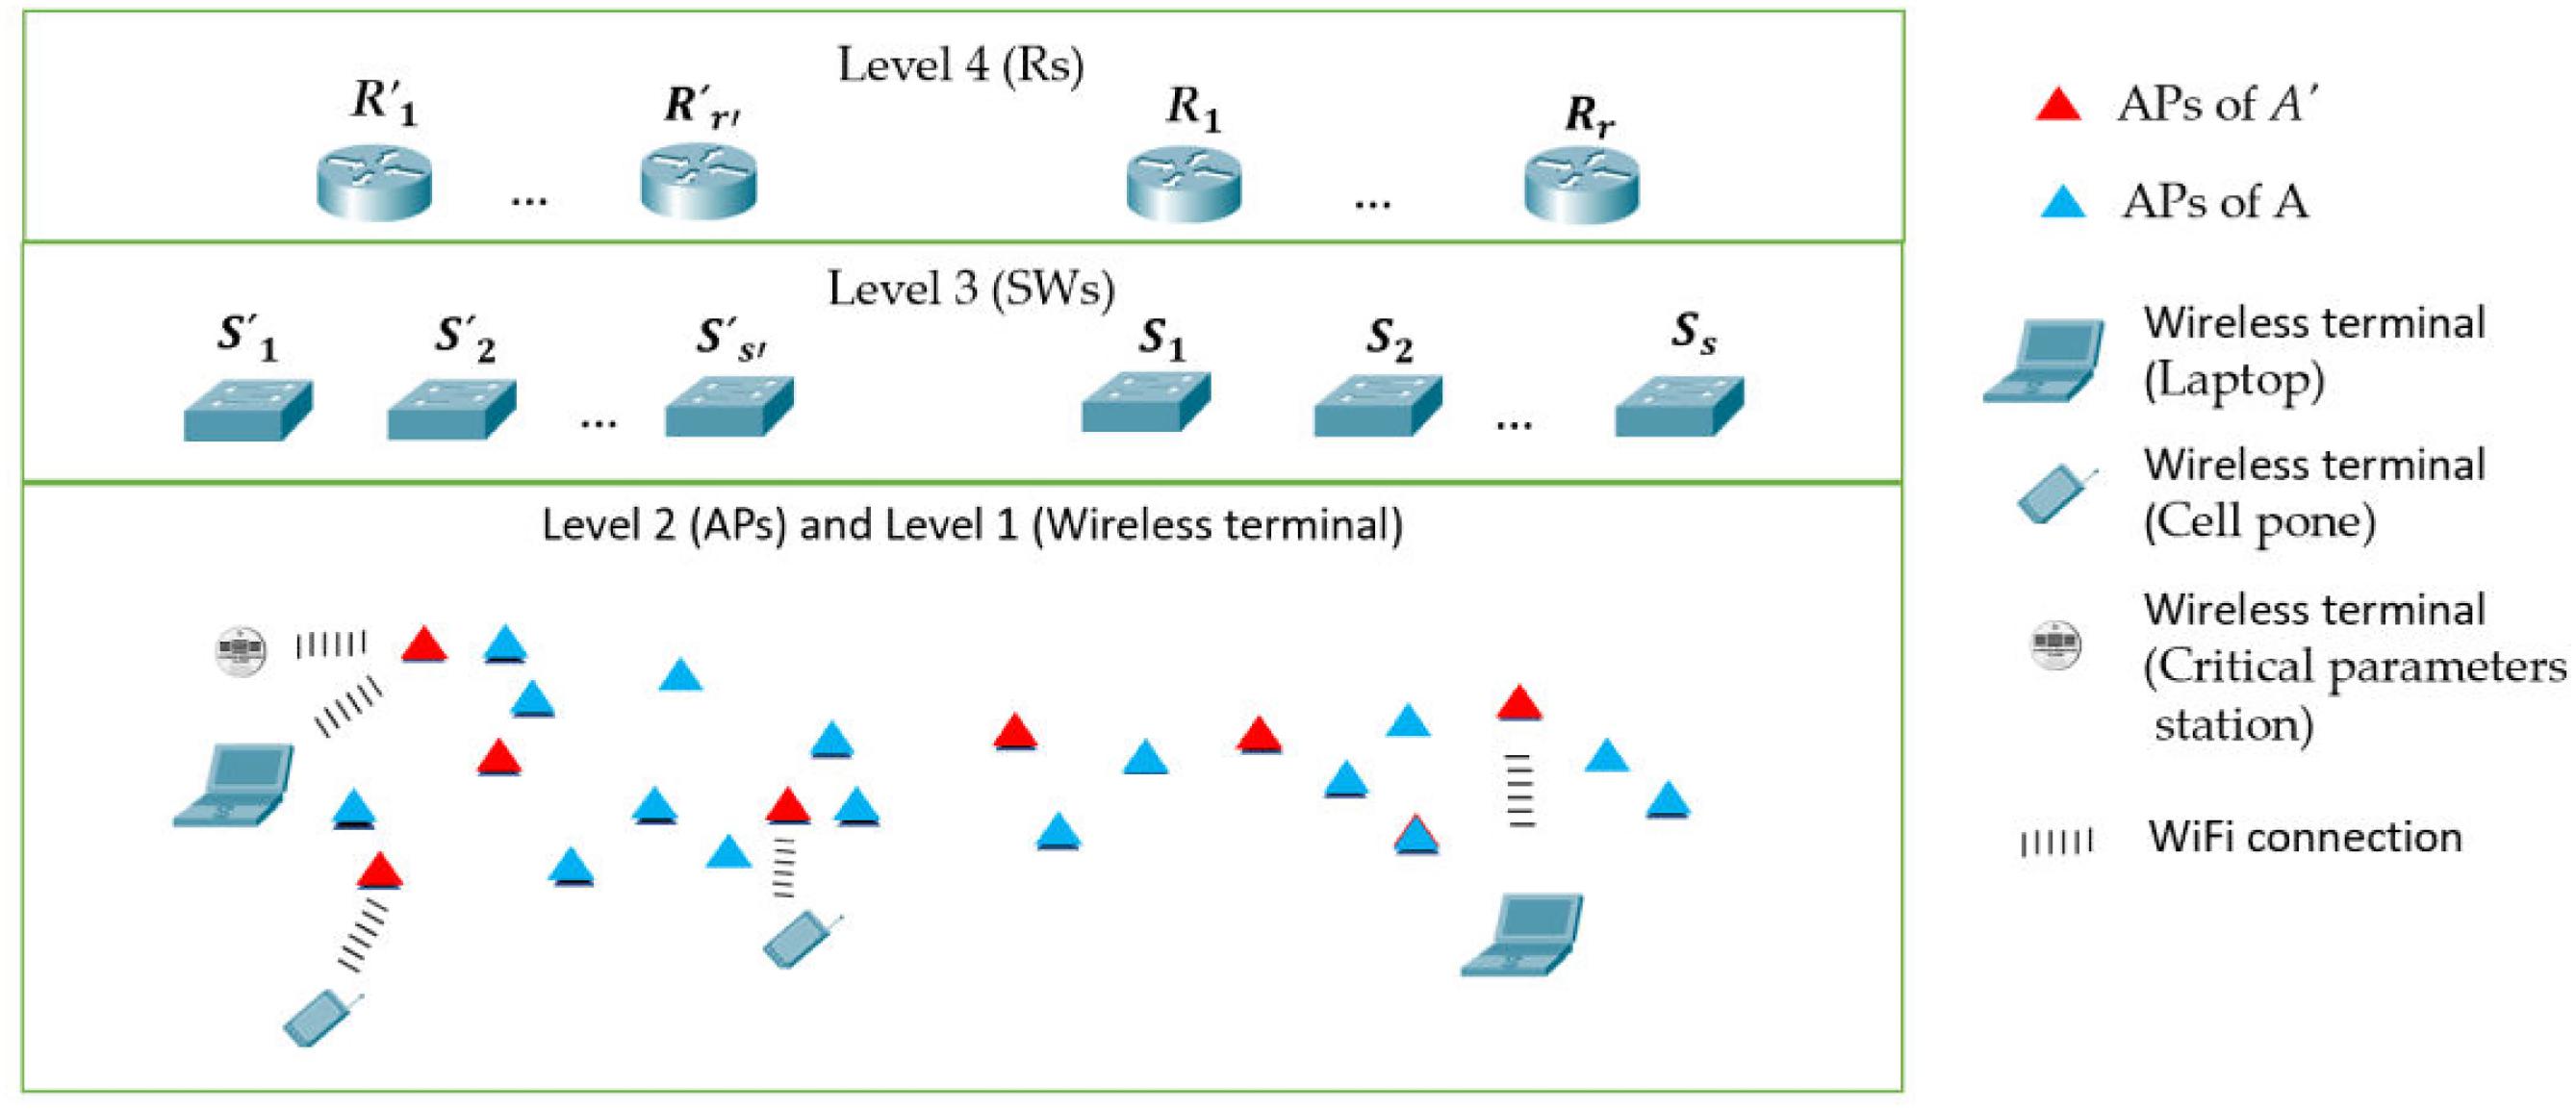
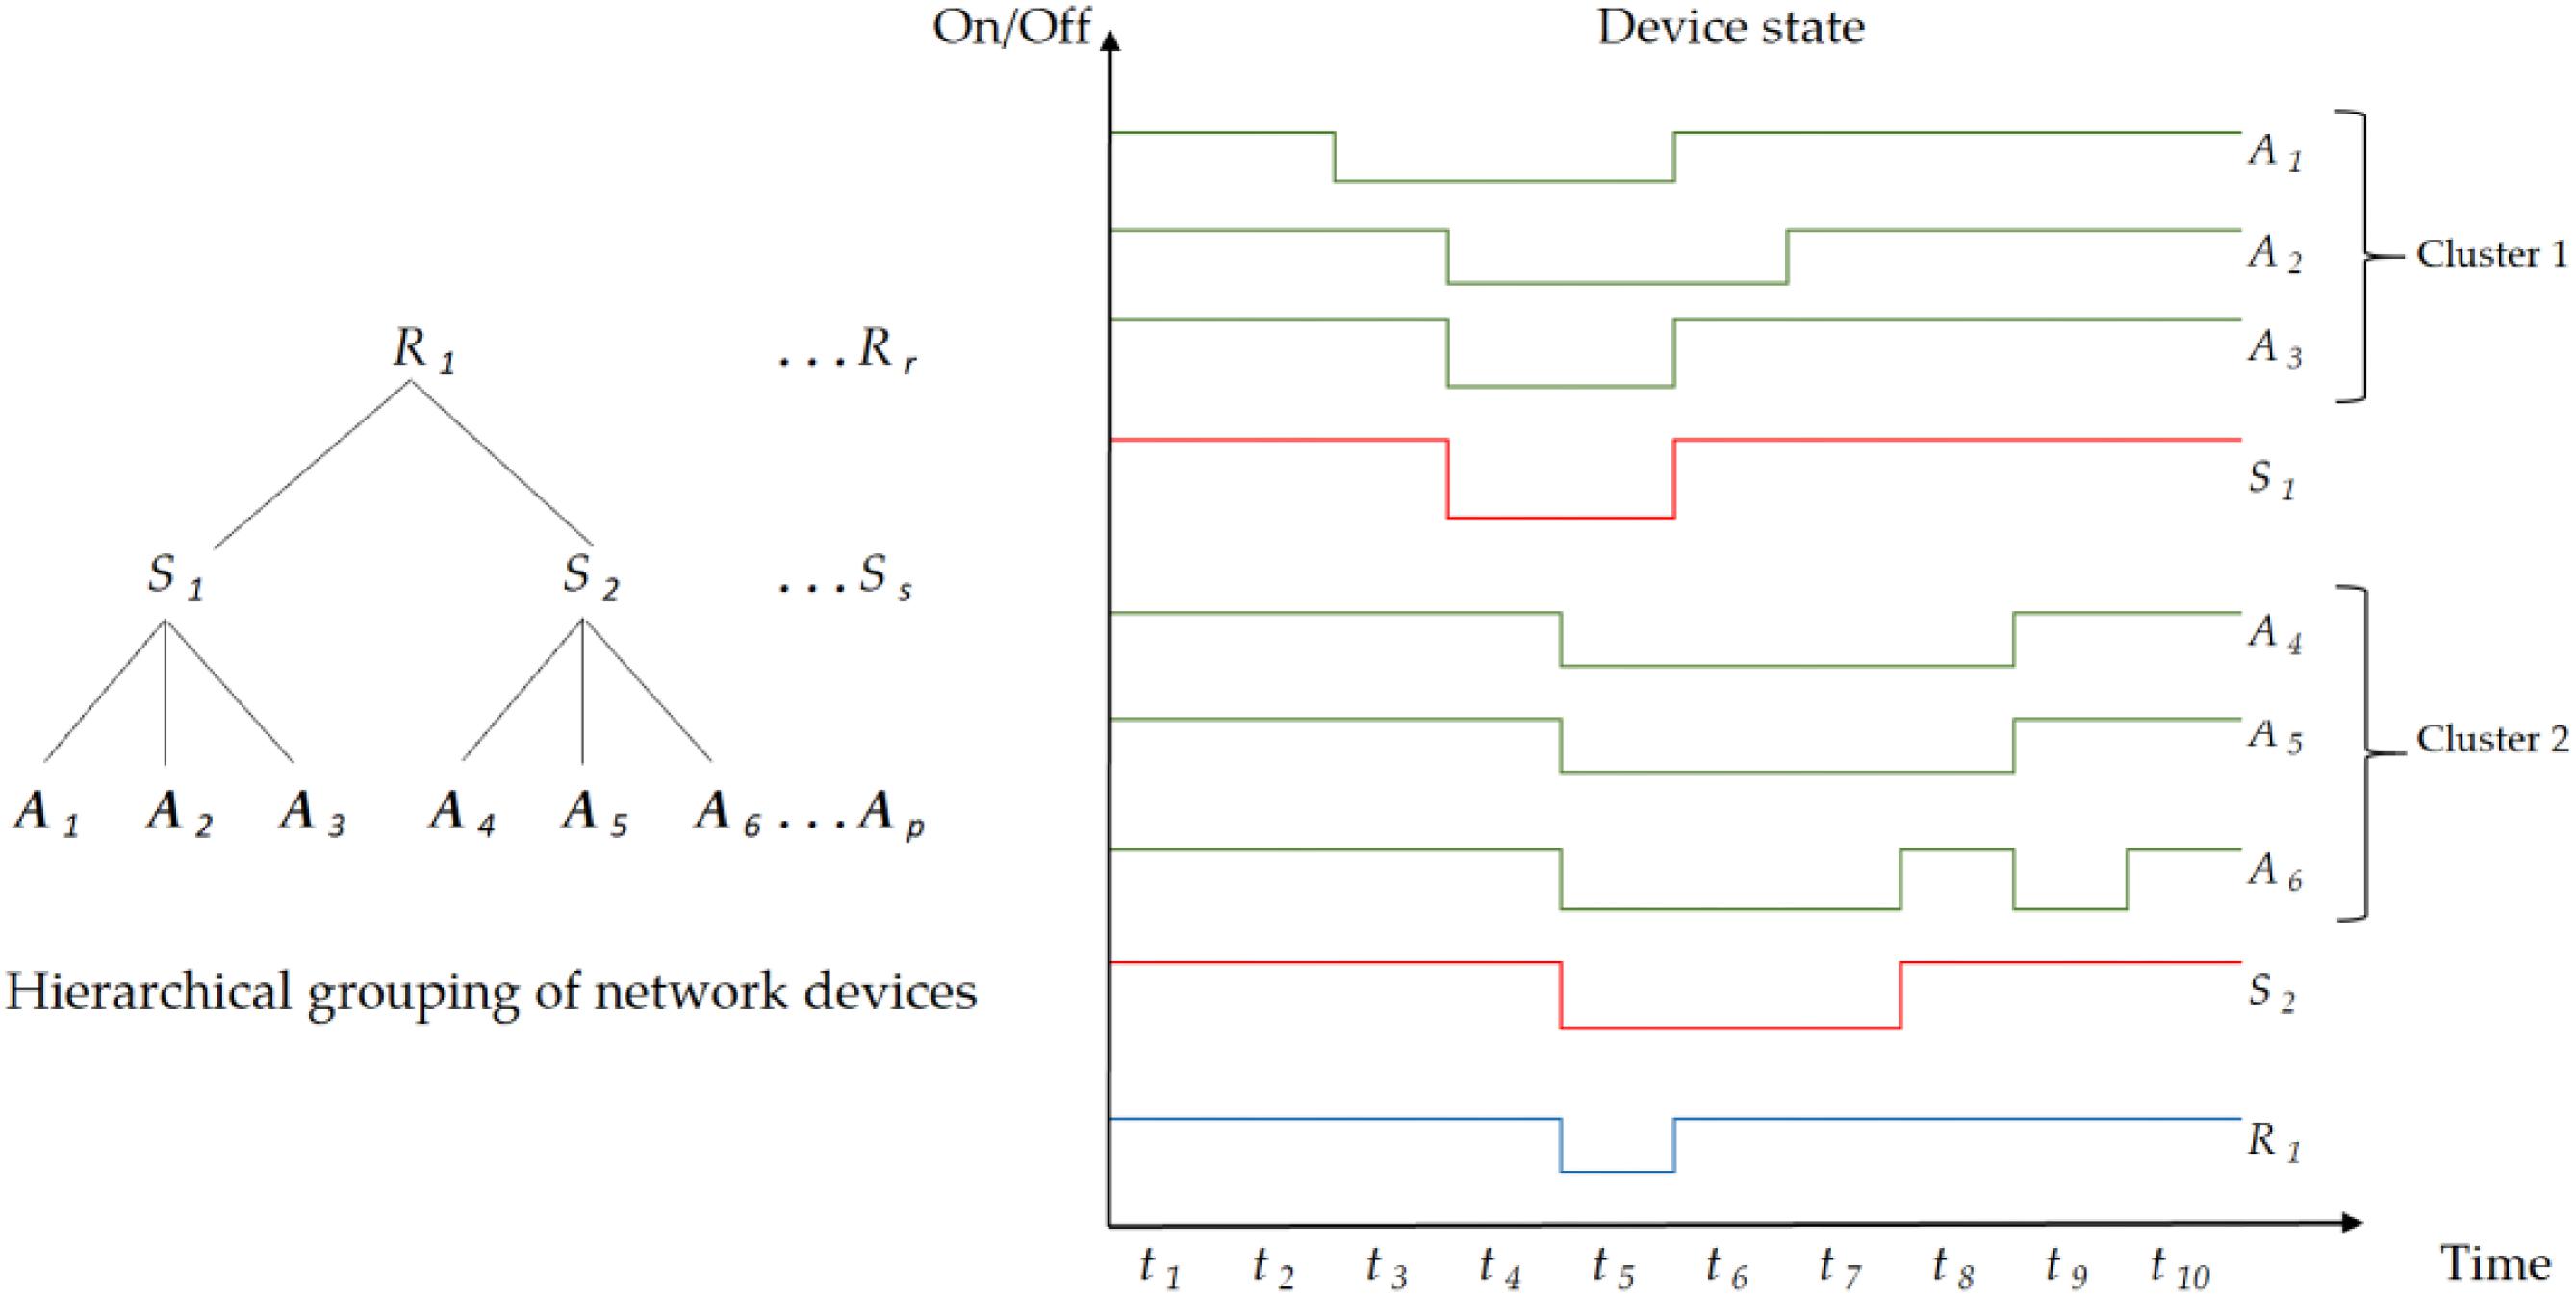
Our method is focused on the efficient estimation of the decision-making of when to turn on and turn off the maximum number of devices in sets A, S, and R simultaneously to achieve a maximum amount of energy savings in a determined slot of time (ti) in a period of time T = { t1, t2, …, tn}. This is a complex optimization problem that must consider traffic engineering in the overall WiFi network. For that reason, it is key to plan throughput monitoring in the network. At Level 2, the are turned off in , if they will not communicate any data or synchronization signals. Simultaneously, at Level 3, the to which the Ai are connected will be turned off. To do that, our method must cluster the APs of A that can be turned off, finding the maximum of j (for each cluster) for which a maximum number of APs can be turned off. The range of S limits the number of clusters. Similarly (at level 4), our method must cluster S limited to the range of R. As an example, in Fig. 2, we show a particular clustering for sets A, S, and R. We have considered a period of 10 slots of time (T = { t1, t2, t3, t4, t5, t6, t7, t8, t9, t10 } ). A1, A2, and A3 are turned off in t4 and t5. They could be clustered (cluster 1), and because they are connected to S1 (which is connected to R1), all those devices can be turned off in t4 and t5 simultaneously. The same applies for A4, A5, and A6 (cluster 2), connected to S2. At t5, t6, and t7, S2 can be turned off. Following the same criteria, R1 could be turned off in t5.
Fig. 2.
The monitorization could guide the implementation of efficient roaming policies in the AP (Bousia et al. 2016) to balance the traffic efficiently, allowing to turn off idle APs in A during the maximum amount of time, implement VLANs (Ho et al. 2014) in the S and R to separate the traffic, or to implement a network slicing (Jalalian et al. 2023) using software-defined networking (SDN) (Ashtari et al. 2022). We focus on the method to implement the maximum amount of energy savings, presenting the main ideas of our method, formalizing the energy savings, and presenting experimental results that refute our formal model. Our model optimizes energy savings by determining when to turn on and off APs of A, SWs of S, and Rs or R, influenced by network traffic. The main elements of our method are the following:
i.
Planning the placement of APs in the geographical area of the WiFi network, organized in a rectangular manner (by rows and columns), to ensure coverage and a minimum permanent bandwidth to the wireless terminals.
ii.
Designing the control algorithms for turning on and turning off APs of A according to the traffic A’ carries.
iii.
Using a machine learning clustering technique to maximize energy savings in SWs and Rs.
3.1. Planning the allocation of the APs
The objective is to cover the geographical area of the wide campus dense WiFi network guaranteeing a minimum bandwidth for the wireless terminals.
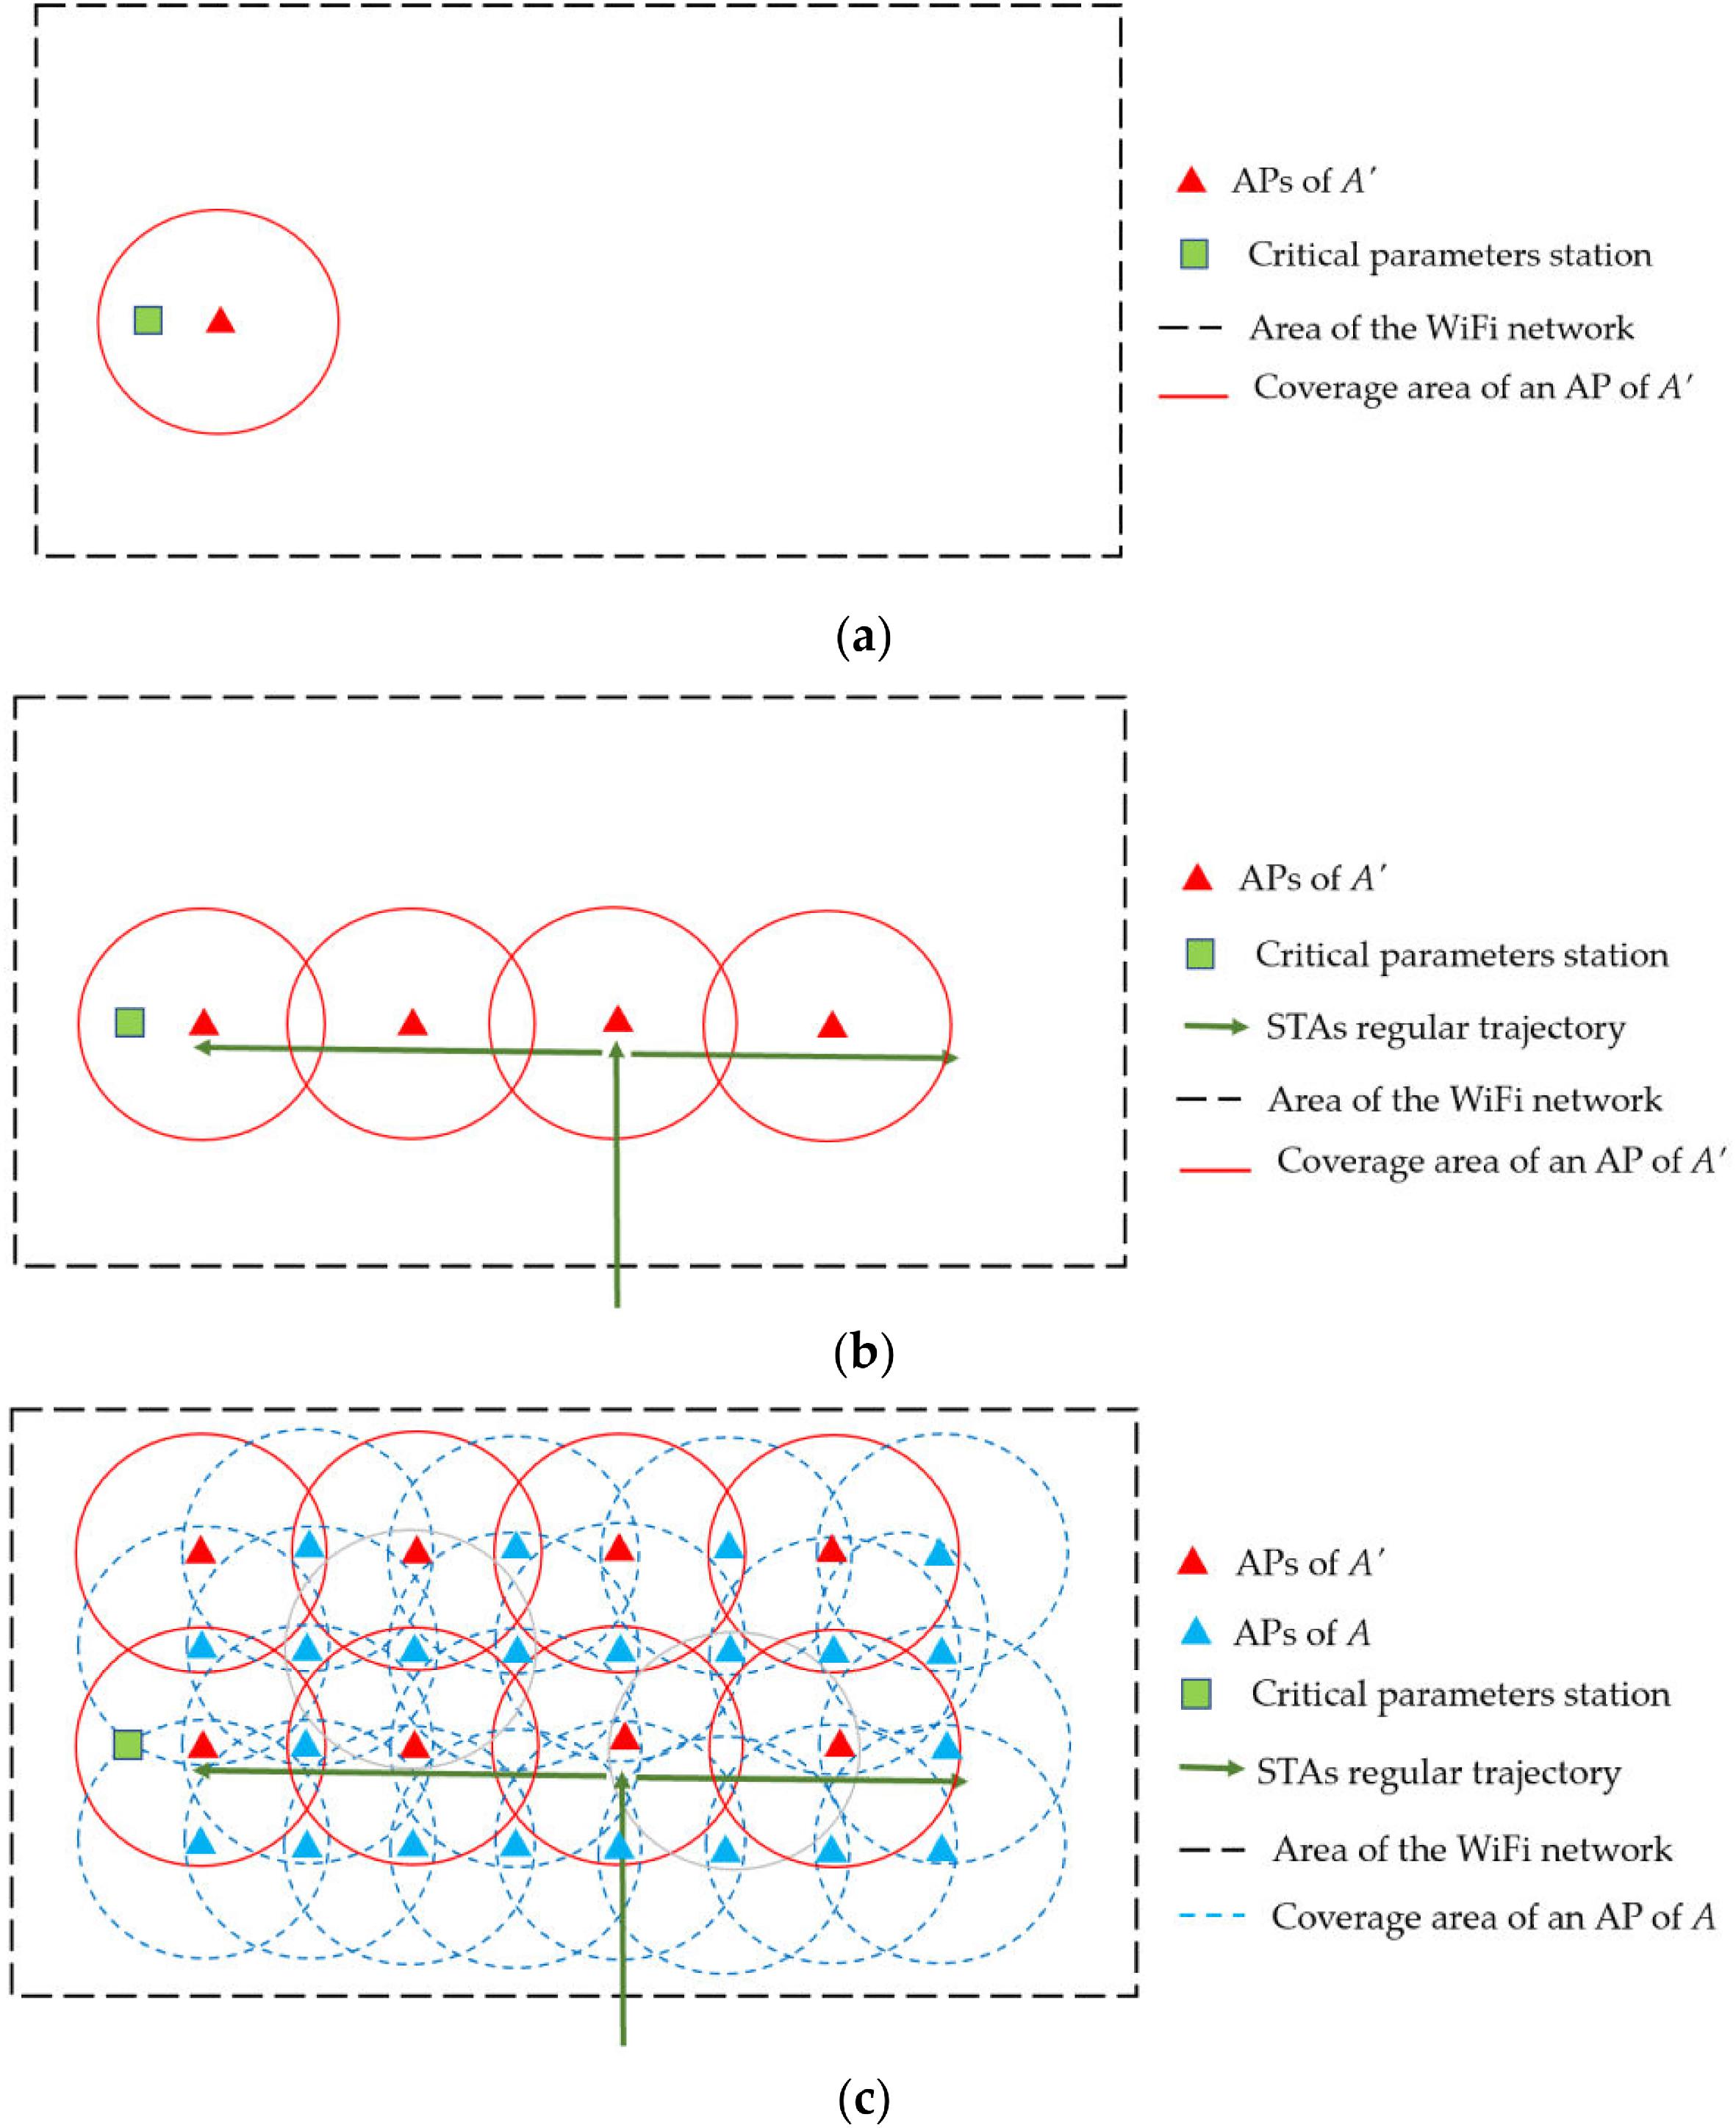
First, the APs of A′ are planned, and then the APs of A fill the maximum number of uncovered areas. From a theoretical point of view, we consider the coverage area of each AP as a circle (Xu et al. 2020). Therefore, the geographical area would be tiled with intersecting circles so that a wireless device located in the area intersected by two or more APs could communicate using any of them. Each AP in A’ will have a set of adjacent APs of A around it. The geographical area tiled by the APs is approximated by a rectangular area matrix. The APs of A′ are allocated according to the following steps (Fig. 3):
•
First, we allocate the APs of A′ to which a critical wireless terminal (green square) is connected (critical sensors, servers, vigilance cameras, detection of the presence of people using WiFi signals, etc.).
•
Second, we allocate the APs of A′ covering the trajectory (such as the hallways of a building) that mobile wireless terminals (portable computers, mobile telephones, etc.) daily visit. Those trajectories are often very well characterized in university campus environments (Traunmueller et al. 2018; Igual et al. 2022).
•
Third, each AP of A’ will be surrounded by a set of APs of A following a particular strategy.
Fig. 3.
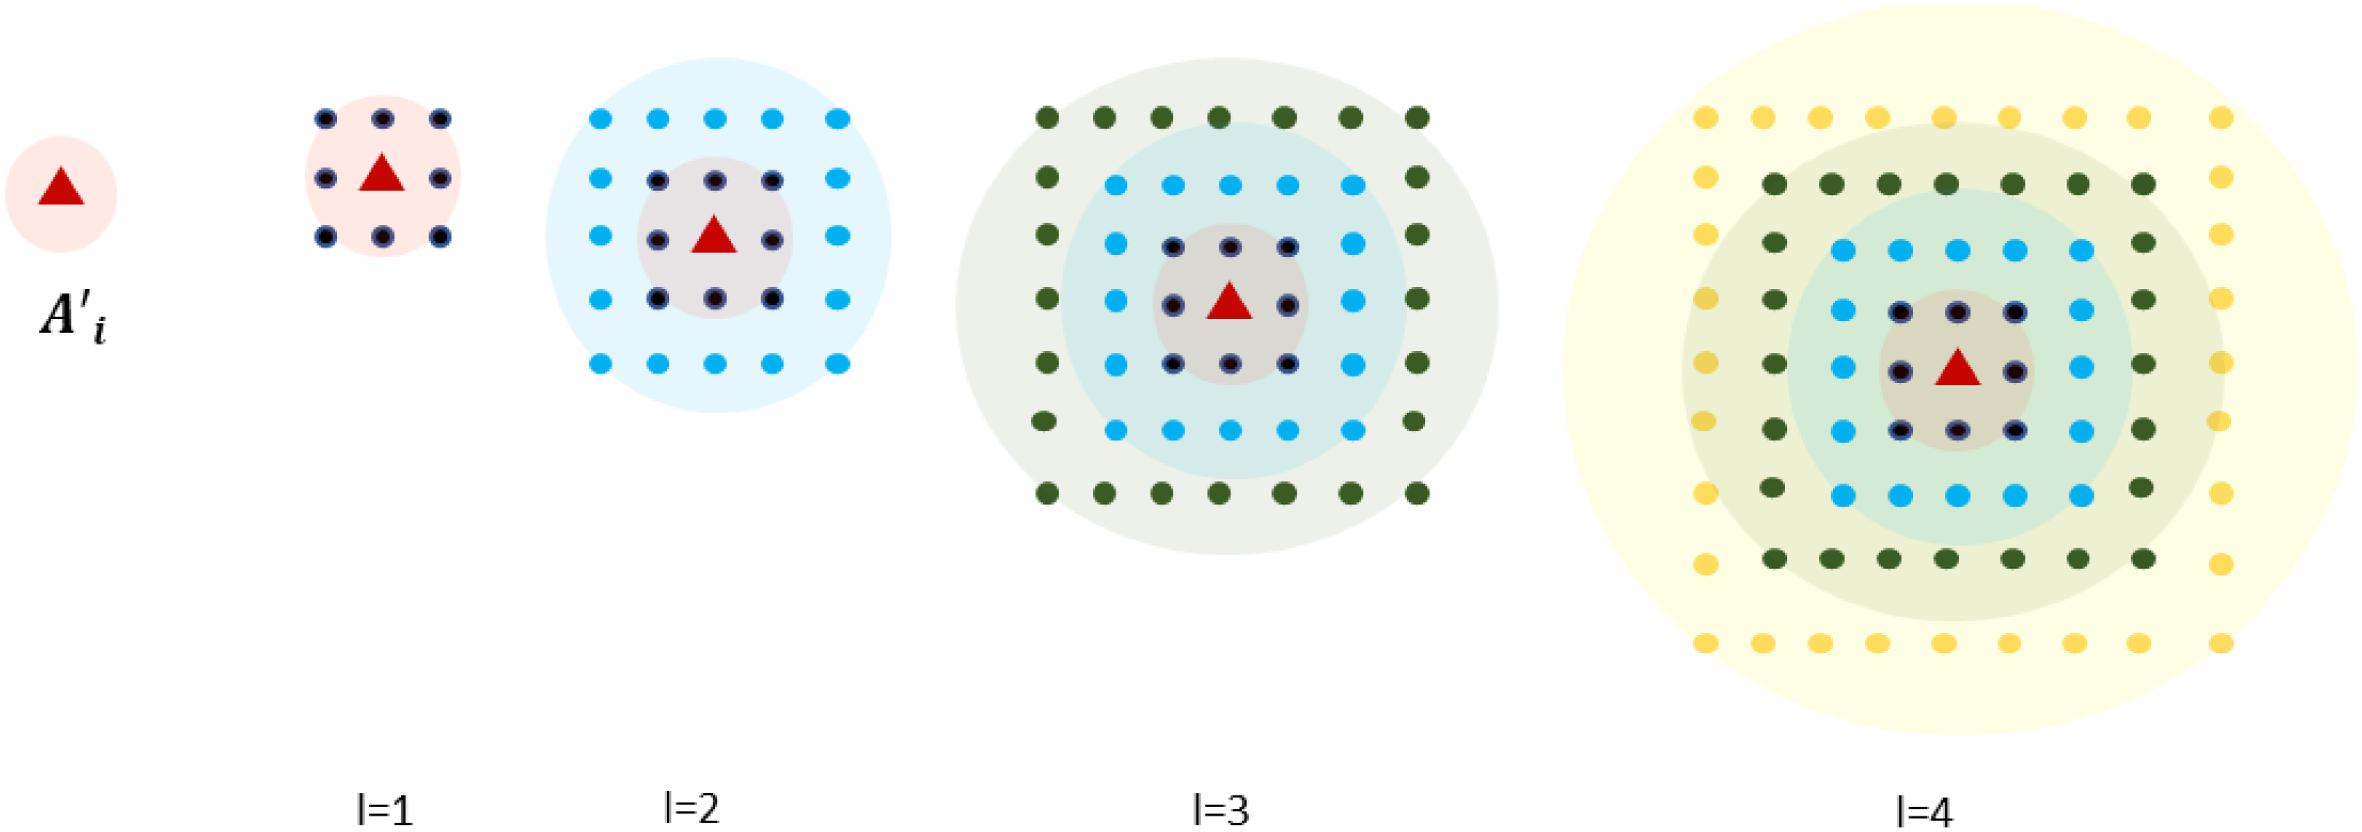
In Fig. 4, the algorithm Surrounds_APs describes the planning steps of the APs of A that surround each AP of A′. The inputs of the algorithm are all the APs in A′ and the number of levels (Nl) of surround. The output is the surrounding allocation of APs in A for each A′i. The objective is to build Nl crowns of radio l in which APs of A are allocated (Fig. 5).
Fig. 4.
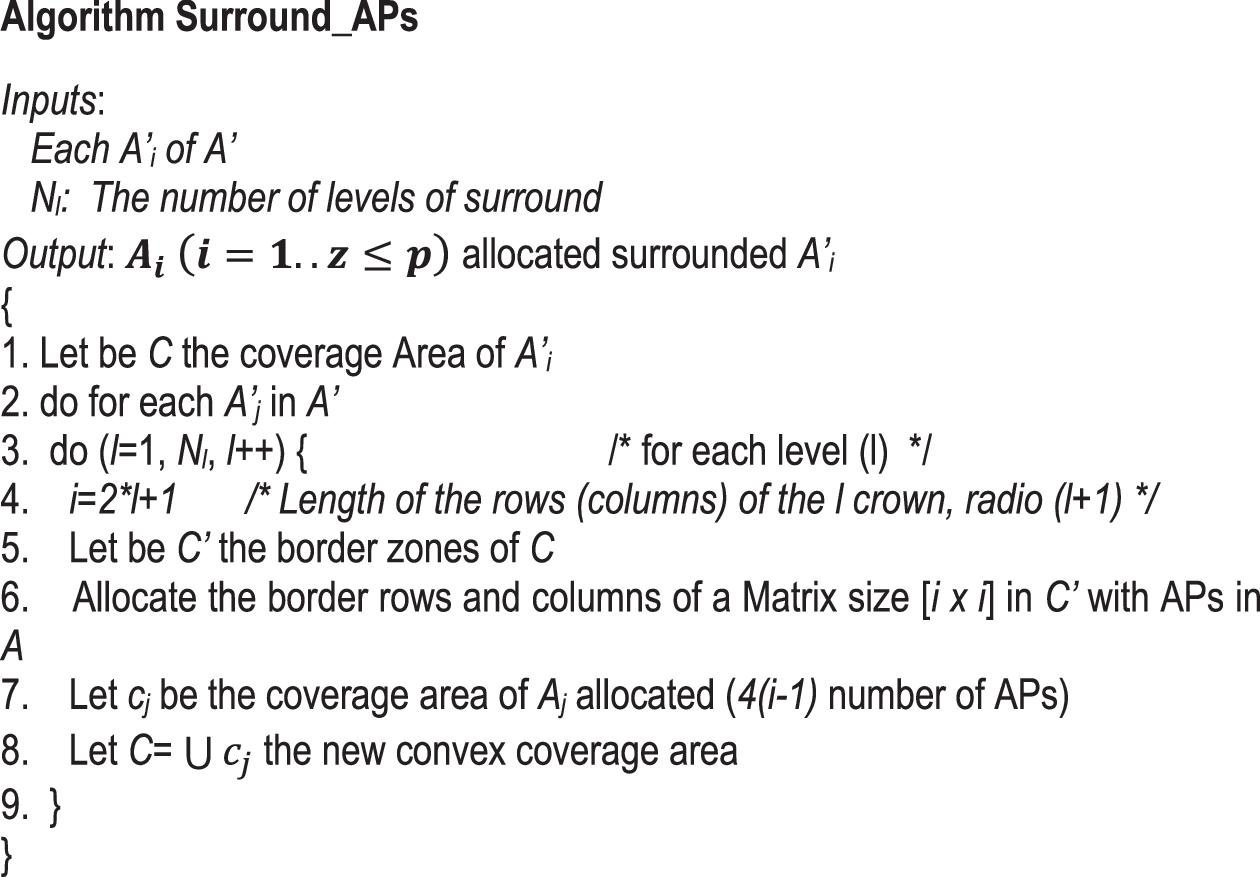
Fig. 5.
3.2. Algorithms for turning on and turning off APs of A
Once the planning of the location of the APs in the dense WiFi network is carried out, we analyze the control of turning on and off the APs of A. We next present general conditions that guide the turning on and turning off of the APs of A and the code of two algorithms for achieving those actions by applying the idle cycling technique.
Let the list (L) of APs in the crowns of a particular AP (A′j ( j = 1 . s' ) ) of A′. Some elements of L will be turned on just when some traffic conditions occur on A′j. Let Tt ( A′j ) a Boolean function that is true when the traffic carried by A′j exceeds a certain amount (it is congested or close to being congested (Youngseok Lee et al. 2002)) during some previously established number of ti. When that condition occurs, the traffic will be balanced on a determinate list of Ai of L. That list (Lp) consists of the APs in the path from A′j and their one hop neighbors (). After that, a wireless device that was disconnected from the A′j now must be connected to the Ai. That process produces a forced handoff (Wang et al. 2017) that has been well studied, and efficient traditional solutions exist for it (Suárez et al. 2010). For that reason, it is necessary to characterize the trajectory of wireless terminals and efficiently assign the APs of the WiFi network so that the handoff is achieved efficiently. Moreover, the process to turn on and execute the handover must be very fast. Figure 6 shows the Turn_On_APs algorithm, which is executed asynchronously when A′j is congested for a certain amount of time. The complexity of that algorithm is dependent on Nl and the control messages among the A′j and the APs of L. The smaller the Nl, the faster the Turn_On_APs algorithm. The protocol derived from this algorithm, in charge of finding Lp and managing messages between APs, must also be very fast. After some established number of ti, that protocol will turn on the APs in Lp.
Fig. 6.
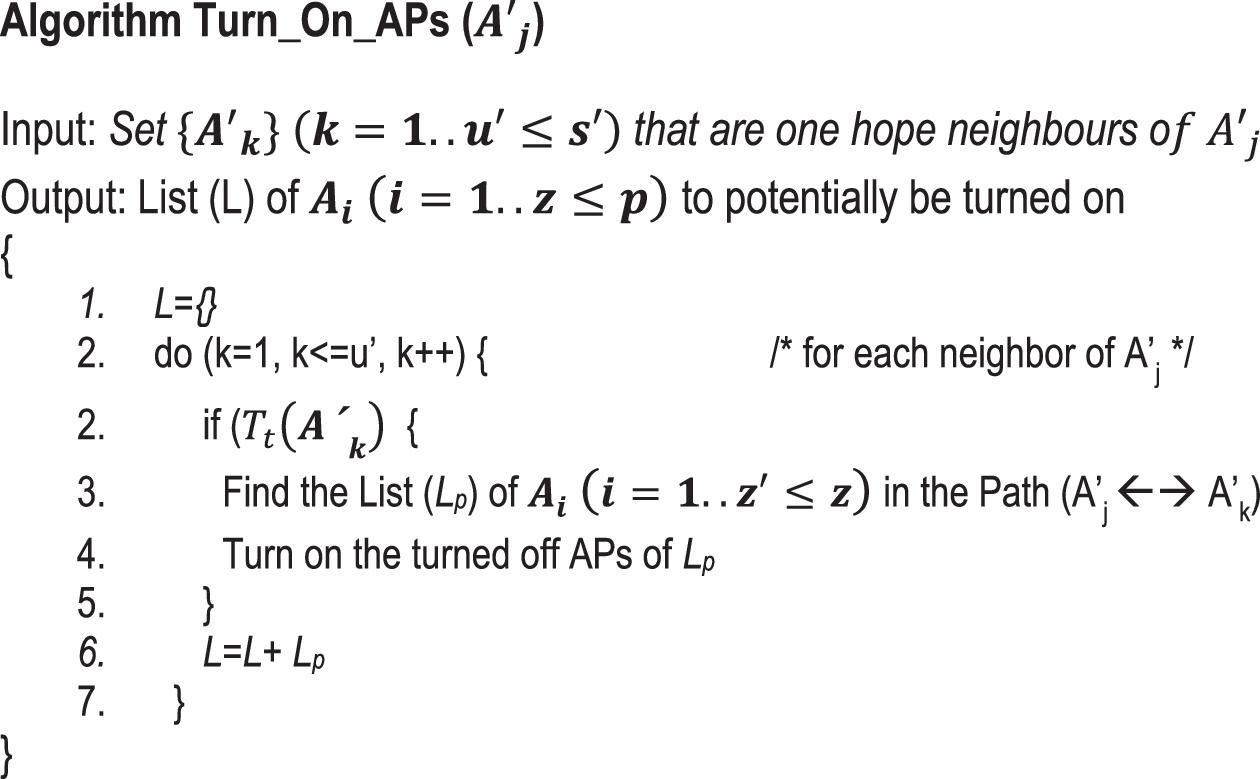
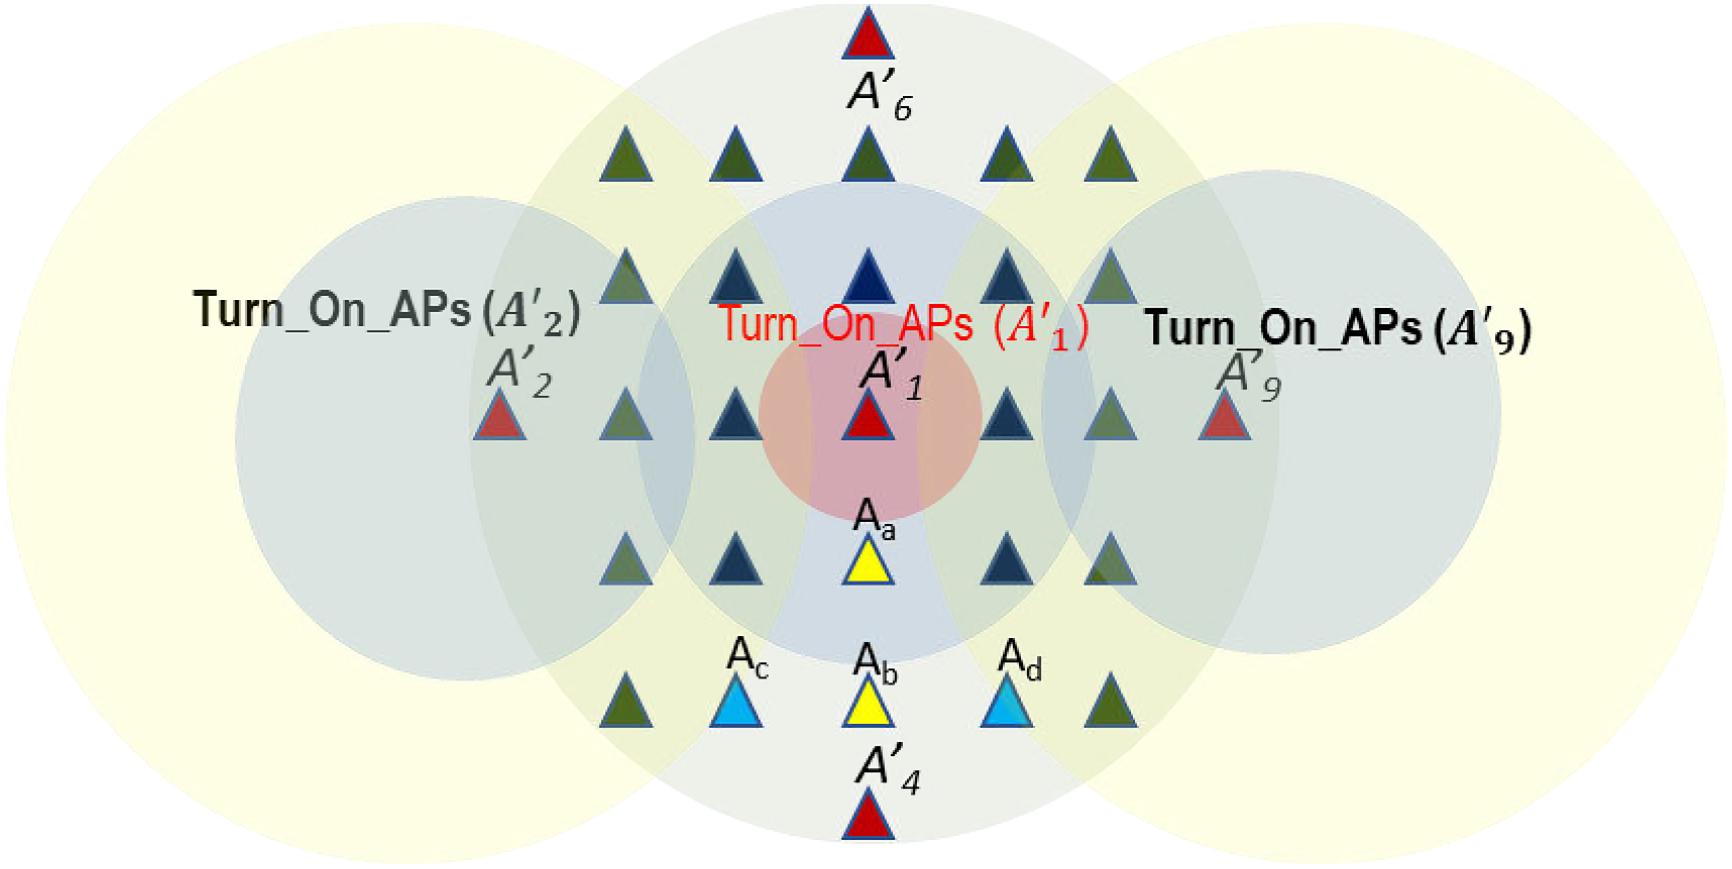
Figure 7 shows the congested A'1. The , and L is the list of APs in the crowns for l = 1 and l = 2. The algorithm found that only A'4 and then the yellow APs (Lp) of L were turned on. Let us note that A'1 remains turned on, but it will not be congested because the traffic was balanced.
Fig. 7.

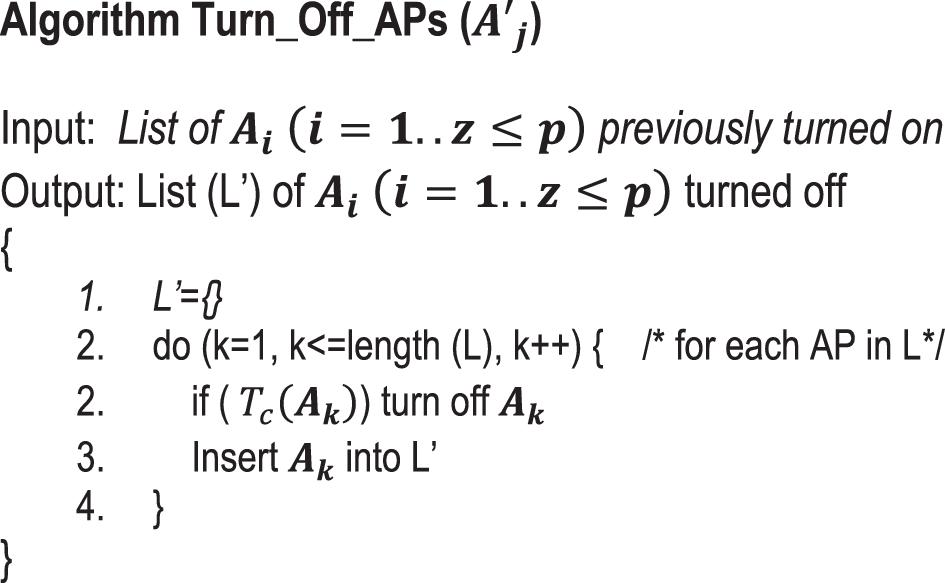
If an A'j has not carried traffic during some established number of ti, it is supposed that it will not continue carrying traffic during another established number of ti, and then it will be turned off. Once the protocol for turning off APs detects the above condition, the algorithm Turn_Off_APs will determine the APs in the crowns that have not carried traffic during some established number of ti and proceed to turn them off. An alternative consists of only testing the list (L) previously turned on with the algorithm Turn_On_APs. Let Tc (Ak) be a Boolean function that is true when the traffic carried by Ak is null in an established number of ti. The Turn_Off_APs algorithm uses the idle cycling technique to turn off APs when the traffic transported through them is null. In Fig. 8, the code of that algorithm is shown.
Fig. 8.
The simultaneous application of Algorithm Turn_On_APs could provoke interferences with the APs of A that are simultaneously in the crowns of APs of A′ and that are one-hop neighbors. Let us illustrate that with the example of Fig. 9. Let us suppose that the algorithm is simultaneously executed in the one-hop neighbors: A′1, A′2, and A′9. Then, the Ac is in the crowns (l = 2) of A′1 and A′2, while the Ad is in the crowns (l = 2) of A′1 and A′9. This interference can be solved by applying SDN (Montazerolghaem 2022), installing a WiFi controller in each AP that communicates with a network controller using the OpenFlow (Shi et al. 2021) protocol, and using the corresponding network application. We do not focus on SDN in this work. For that reason, we consider in the list (L) only the APs of A that do not provoke interferences. In our example, those APs are Aa and Ab.
Fig. 9.
3.3. Energy savings formal model
Energy savings (ES) are specified considering the following parameters (eq. 1): (a) the amount of ES due to one AP in A (ESA): the amount of electric power (kWh) that is not consumed in the APs in A while they remain turned off. (b) The amount of ES due to the Ss (ESS): the amount of electric power that is not consumed in the switches while they remain turned off. (c) The amount of ES due to the Rs (ESR): the amount of electric power that is not consumed in the routers s while they remain turned off.
(1)
Associated with each parameter of eq. 1, we make the following considerations and parameters:
•
The number of devices that can be turned on and turned off at the different levels of the architecture of the network in Fig. 1. That is, the number of (z), the number (s) of , and the number (u) of . Those parameters vary along T and the higher s and u, the higher ES. That occurs when the maximum number of network devices is turned off along T.
•
Let Ta, Ts, and Tr be the maximum amount of time the Ai, Si, and Ri, respectively, can be turned off. The longer the Ta, Ts, and Tr, the greater the ES.
•
Let PA, PS, and PR be the supply power of Ai, Si, and Ri, respectively. The higher the PA, PS, and PR, the greater the ES.
Let us consider a set of slots of time t = {t1, t2, …, tn}; we calculate the parameters Ta, Ts, and Tr in base to eq. 2:where Tai (i = 1 . p), Tsh (h = 1 . s), and Trk (k = 1 . r), with p, s, r ≤ n, are the decomposition of Ta, Ts, and Tr in different values of a series mapped (bijective correspondence) on t = { t1, t2, …, tn}. The objective is to find the maximum range of the set of t in which simultaneously the above values of Tai, Tsh, and Trk maximize ES in eq. 3:
(2)
(3)
The complexity of optimizing our objective is that the Ta, Ts, and Tr depend on a high number of physical and communication parameters. We focus on the calculation of Tai, Tsh, and Trk. We define three binary matrices (AE (pxn), SE (sxn), and RE (rxn)) having n columns corresponding to the range (n) of t. In each column is coded the state of the elements of A, S, and R: 0 if the element is turned off and 1 if the element is turned on. The number of rows of the different matrices is the range of the sets A, S, and R, correspondingly.
Matrix AE is obtained by algorithm Turn_On_APs and Algorithm Turn_Off_APs. Thus:
(4)
The value of Tai is calculated by adding the values of the row i of AE in which the Ai was turned off. That is:
(5)
Matrix SE can be obtained by clustering some rows of AE. The determination of the set of rows that can be clustered is done considering the set of rows associated with different Ai connected to a Sh. Thus:
(6)
The value of Tsh is calculated in the same way as Tai. That is:
(7)
The same rationale is done for matrix RE but clustering different elements of R. Thus:
(8)
An important question is how the grouping of the Ai is determined, i.e., how the SE can be calculated from the AE. To answer that question, we consider two general parameters, but we do not theoretically solve the problem because, in general, any clustering algorithmic method can be used to solve it.
Let sehj, ( j = 1, ..., n ) be the leader of a group h, and let be , the rest of the elements of the group ( contains the rows of AE that belong to that group excluding the row of the leader). Then,
(9)
That is, the row h of the matrix SE register, for n slots of t, a 0 if all the clustered Ai were turned off and 1 in the contrary case. Thus, Ts account for the number of intervals of time that all the Ai of the group were turned off and the Sh could be turned off. The objective is to maximize Ts. But it is not the only parameter to optimize; we also need a parameter that accounts for the number of intervals of time (tj) in which the Ai of the group consumed a different amount of energy (several of them were turned on and the rest were turned off). Let dissimilitude (D) be that parameter. To calculate that parameter from matrix AE, we define the following vector:
(10)
And calculate:
(11)
That is, a scalar value that is the sum of all the elements of vector . It follows directly that when the group has only one element, then Dh = 0. Minimizing:
(12)
allows us to obtain clusters of Ai that that consume the same energy in as much time as possible.
The same rationale is used for the calculation of RE from SE. Thus, our optimization problems consist of:
In a period T:
Maximize: Ta, Ts, and Tr.
Minimize: for matrices RE ( rxn ) from SE ( sxn ).
Finally, if we properly dimension the value of T that allows us to find repetitive traffic patterns along the time, we could calculate AE and use it for successive near-future T. We will continuously continue calculating in real time the behavior of traffic to feedback our optimization process with actual traffic traces.
Let us now continue with the example of Fig. 3, in which , and matrix AE is:
(13)
We analyze three possible groupings for calculating matrix SE, and present the values of Tsh and Ts:
a)
We define three groups:
a.
Leader: sehj = 1 (row 1 of SE), , that is, we group APs: A1 and A2,
b.
Leader: sehj = 3 (row 3 of SE), , that is, we group APs: A3 and A4,
c.
Leader: sehj = 5 (row 5 of SE), , that is, we group APs: A5 and A6.
The resulting SE and Ts are:
(14)
Thus, and 6.
b)
We define three groups:
a.
Leader: sehj = 1 (row 1 of SE), , that is, we group APs: A1,
b.
Leader: sehj = 2 (row 2 of SE), , that is, we group APs: A2 and A3,
c.
Leader: sehj = 4 (row 4 of SE), , that is, we group APs: A4, A5, and A6.
The resulting SE and Ts are:
(15)
Thus, and 3.
c)
We define three groups:
a.
Leader: sehj = 1 (row 1 of SE), , that is, we group APs: A1 and A2,
b.
Leader: sehj = 3 (row 3 of SE), , that is, we group APs: A3 and A6,
c.
Leader: sehj = 4 (row 4 of SE), , that is, we group APs: A4 and A5.
The resulting SE and Ts are:
(16)
Thus, and 4.
Option b, which minimizes Dh, is the best. Using the SE for that option, we calculate RE, Trk, and Tr:
(17)
Substituting the power values PA, PS, and PR in the devices, we obtain eq. 18:
(18)
Substituting the values of Ts and Tr, we obtain the value of ES in eq. 19:
(19)
4. Results
We implemented the energy savings method in the UTS network, which was physically segmented into three different buildings: Tekné, Paideía, and Arkhé. The first step we took was planning the APs on the UTS campus. But the planning of wired devices (S′, S, R′, and R) was imposed by Information and Communication Technology technicians at the university.
4.1. Planning of the APs on the UTS campus
The UTS network has 204 APs (z′=|A′|= 41 and z=|A|= 163) at level 2 of the network hierarchy, 13 switches at level 3 (s′=|S′|= 3 and s=|S|= 10), and 2 routers at level 4 (u′=|R′|= 1 and u=|R|= 1). Those devices were distributed in the three UTS buildings, as shown in Table 1.
Table 1.
| Tekné | Paideía | Arkhé | Total |
|---|---|---|---|
| |A′|= 9 | |A′|= 16 | |A′|= 16 | |A′|= 41 |
| |A|= 33 | |A|= 65 | |A|= 65 | |A|= 163 |
| |S′|= 1 | |S′|= 1 | |S′|= 1 | |S′|= 3 |
| |S|= 2 | |S|= 4 | |S|= 4 | |S|= 10 |
We planned the APs of A′ to cover the most frequent trajectories of the critical wireless terminals on every floor of the Tekné, Paideia, and Arkhé buildings. As an example, Fig. 10 shows the planning of three APs of A′ for covering the corridor of the second floor of the Tekné building. The Tekné building has three floors in total, where nine APs of A′ were planned.
Fig. 10.

4.2. Estimation of key parameter values for planning APs of A′
After planning the APs of A′, we dimensioned parameters ti (for every i) and T to plan the APs of A, l, for every k. In general, that dimensioning depended on the traffic load (throughput) on the main devices of the network (APs of the WiFi network, S′, S, R′, and R) and depended on the planning of A′.
The dimensioning of ti was done by observing the variations of the traffic load in the APs of A′. Those variations occurred during the slots of time (it was similar in all buildings) in which one class ended and the next began on workdays. On weekends, that variation is around 20 Mbps because there are no students in the buildings, and it could be supported by APs of A′. We found that the appropriate value of ti was 30 min.
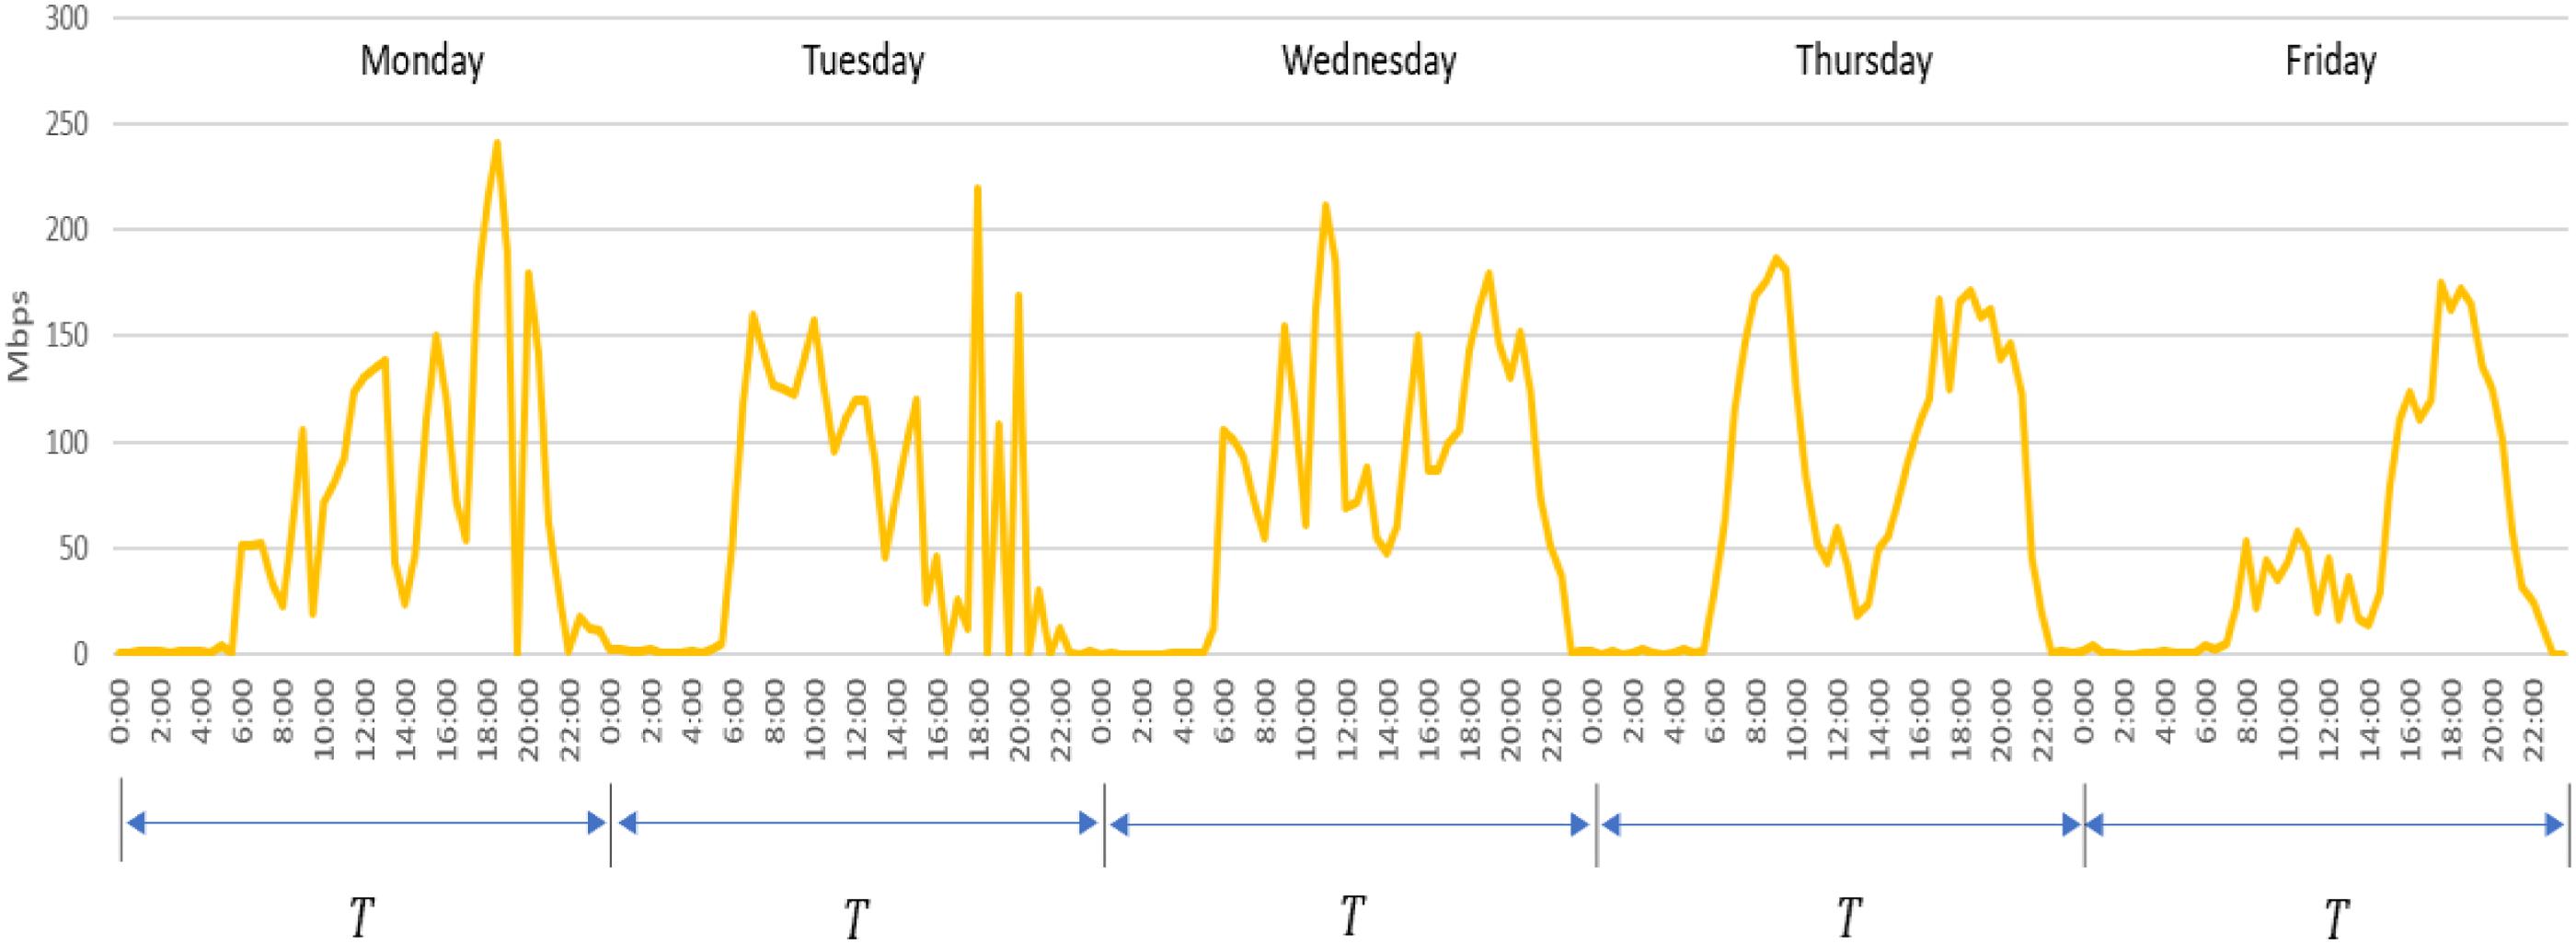
For dimensioning T, we only observed a daily pattern on workdays when the throughput exceeded 50 Mbps. In weekend little traffic load was carried and no pattern was observed. Figure 11 shows the average of the throughput measurements in three APs in the Tekné building (like other buildings) for workdays. Between 06:00 and 22:00 h, the throughput was close to null. Between 06:00 and 22:00 h, the throughput was high. This pattern was repeated daily. The appropriated value of T was 1440 min.
Fig. 11.
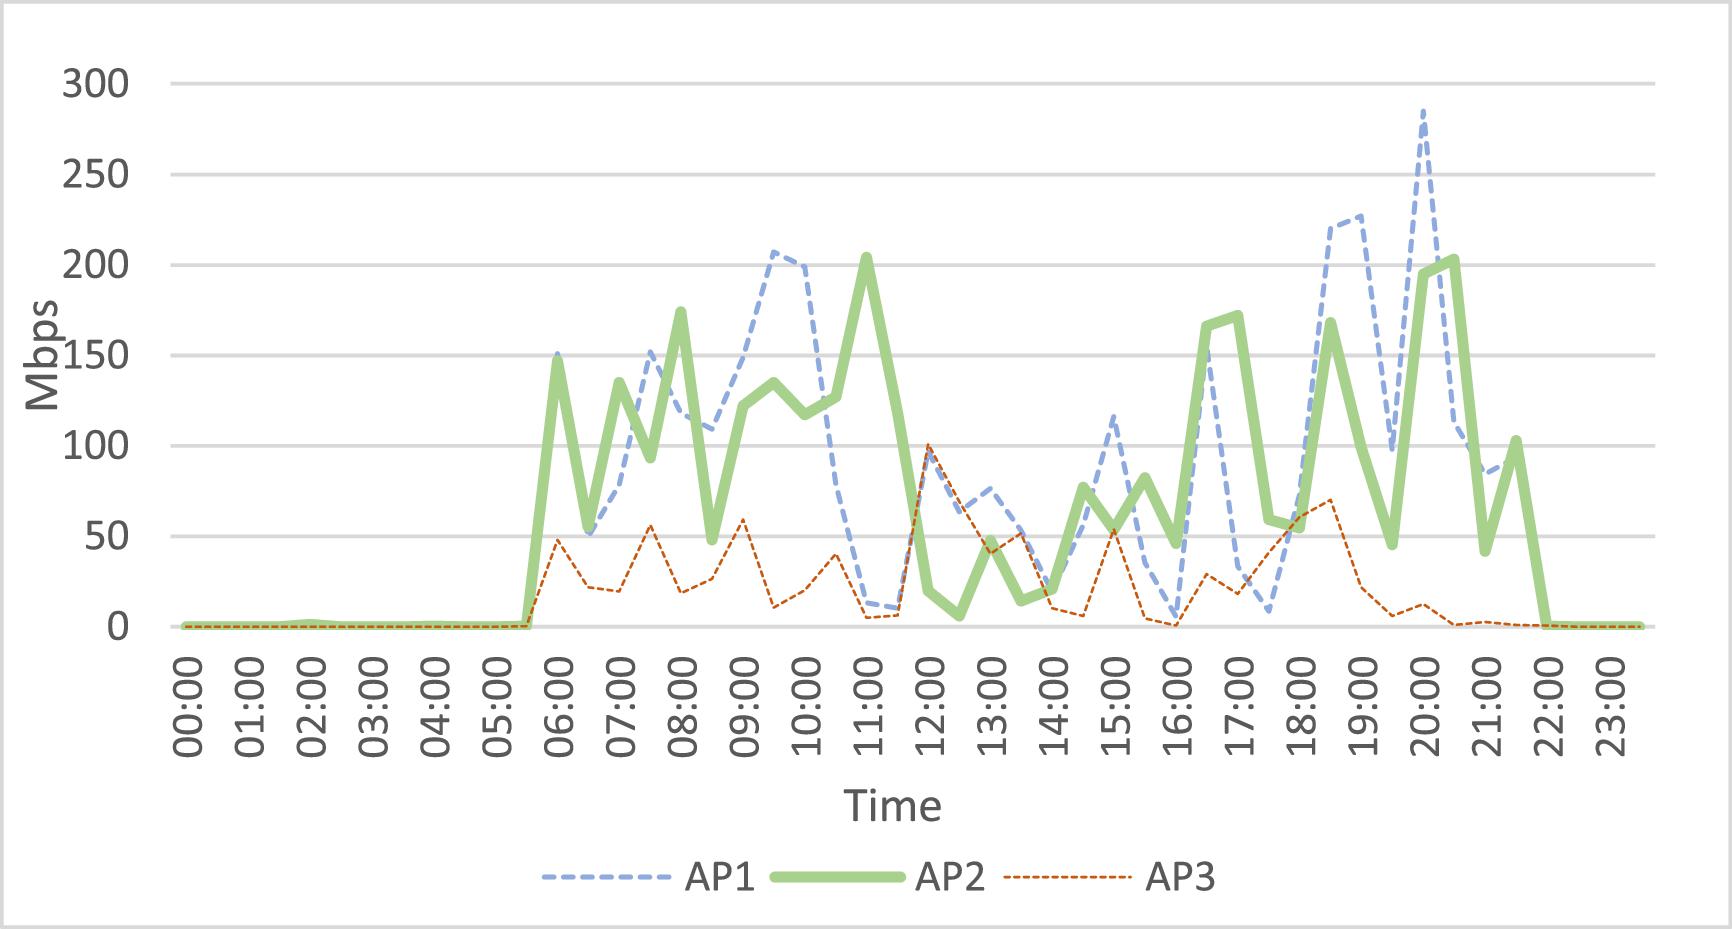
The dimensioning of l and allowed us to balance the traffic load among the APs (A’ and A). The lower the traffic load of APs of A′, the lower the value of , and the lower the value of , the higher the value of l. Thus, both parameters must be determined simultaneously. In the UTS network, it was practical to set dimension l = 1 because the density of APs on campus was low: z − z’ = 163 − 41 = 122 (24 for Tekné building). We used the Unify Cloud Key tool (Naman et al. 2020) in the APs of A′ in the Tekné building floor (the rest of the UTS network behaved in the same way) to dimension , and . In Fig. 12, the throughput variation of those APs is shown: the maximum throughput was 100 Mbps (AP1 and AP2) and 25 Mbps (AP3) but it varied in the time slots 6:00–11:00 h, 11:01–16:00 h, and 16:01–22:00 h. The behavior in those slots suggested us to dimension as a half of the maximum throughput in that slot. That is, 6:00–11:00 h ( and ), 11:01–16:00 ( and ) and 16:01–22:00 ( and ). It was clear that for all the slots, there was an appropriate threshold. But, for A′1 and A′2, the threshold must vary in the different slots. It was possible to do that using SDN technology or by programming and managing scripts on the network devices. We decided to use a threshold of 25 Mbps for all the APs that forced us to turn on A′1, A′2, and A′3, and those were the events we wanted to test.
Fig. 12.
4.3. Determination of power in the UTS network
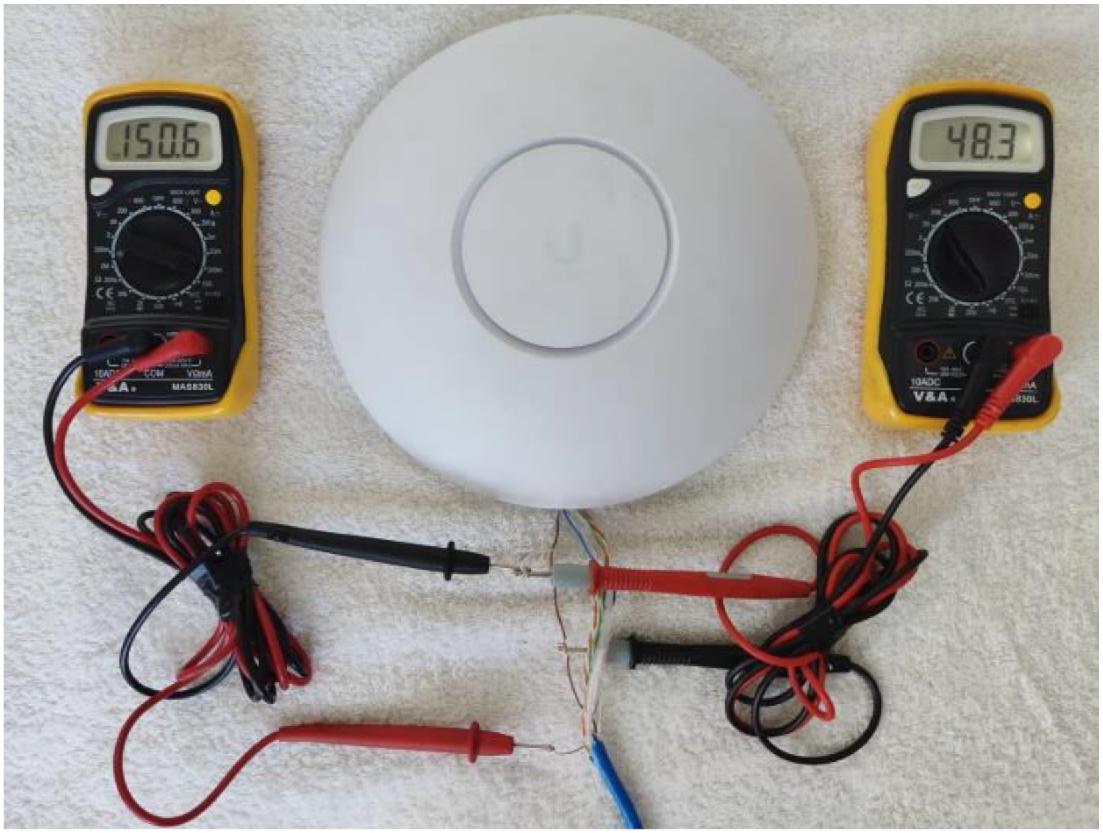
We calculated the power consumed by AP, SW, and R using laboratory tests and comparisons with the manufacturer's specifications. The APs used in the UTS network were UniFi UAP-LR APs and UniFi 6 Long-Range APs. We measured the voltage and current to determine the power consumed by the APs, as shown in Fig. 13. The APs of the UTS worked with the 48 V power over ethernet (PoE) system. The manufacturer specified its maximum power at 18.5 W for high performance, but no specification was made for low performance. The estimated power consumed by APs with low (10 Mbps) or no throughput was 7 W. We took 7 W as the power saved by an AP when it was not turned on.
Fig. 13.
The same process was repeated to determine the power consumed by SW and R. Table 2 shows the equivalent measures for SW and R.
Table 2.
| Type of device | Number of devices | Power (W) |
|---|---|---|
| APs UniFi 6 long-range brand | z = 163 | PA = 7 |
| CISCO 2960 series switches without power over ethernet (PoE) capability | s = 10 | PS = 120 |
| CISCO 2811 series routers without PoE capability | u = 1 | PR = 240 |
4.4. Computation of Ta, Ts, and Tr
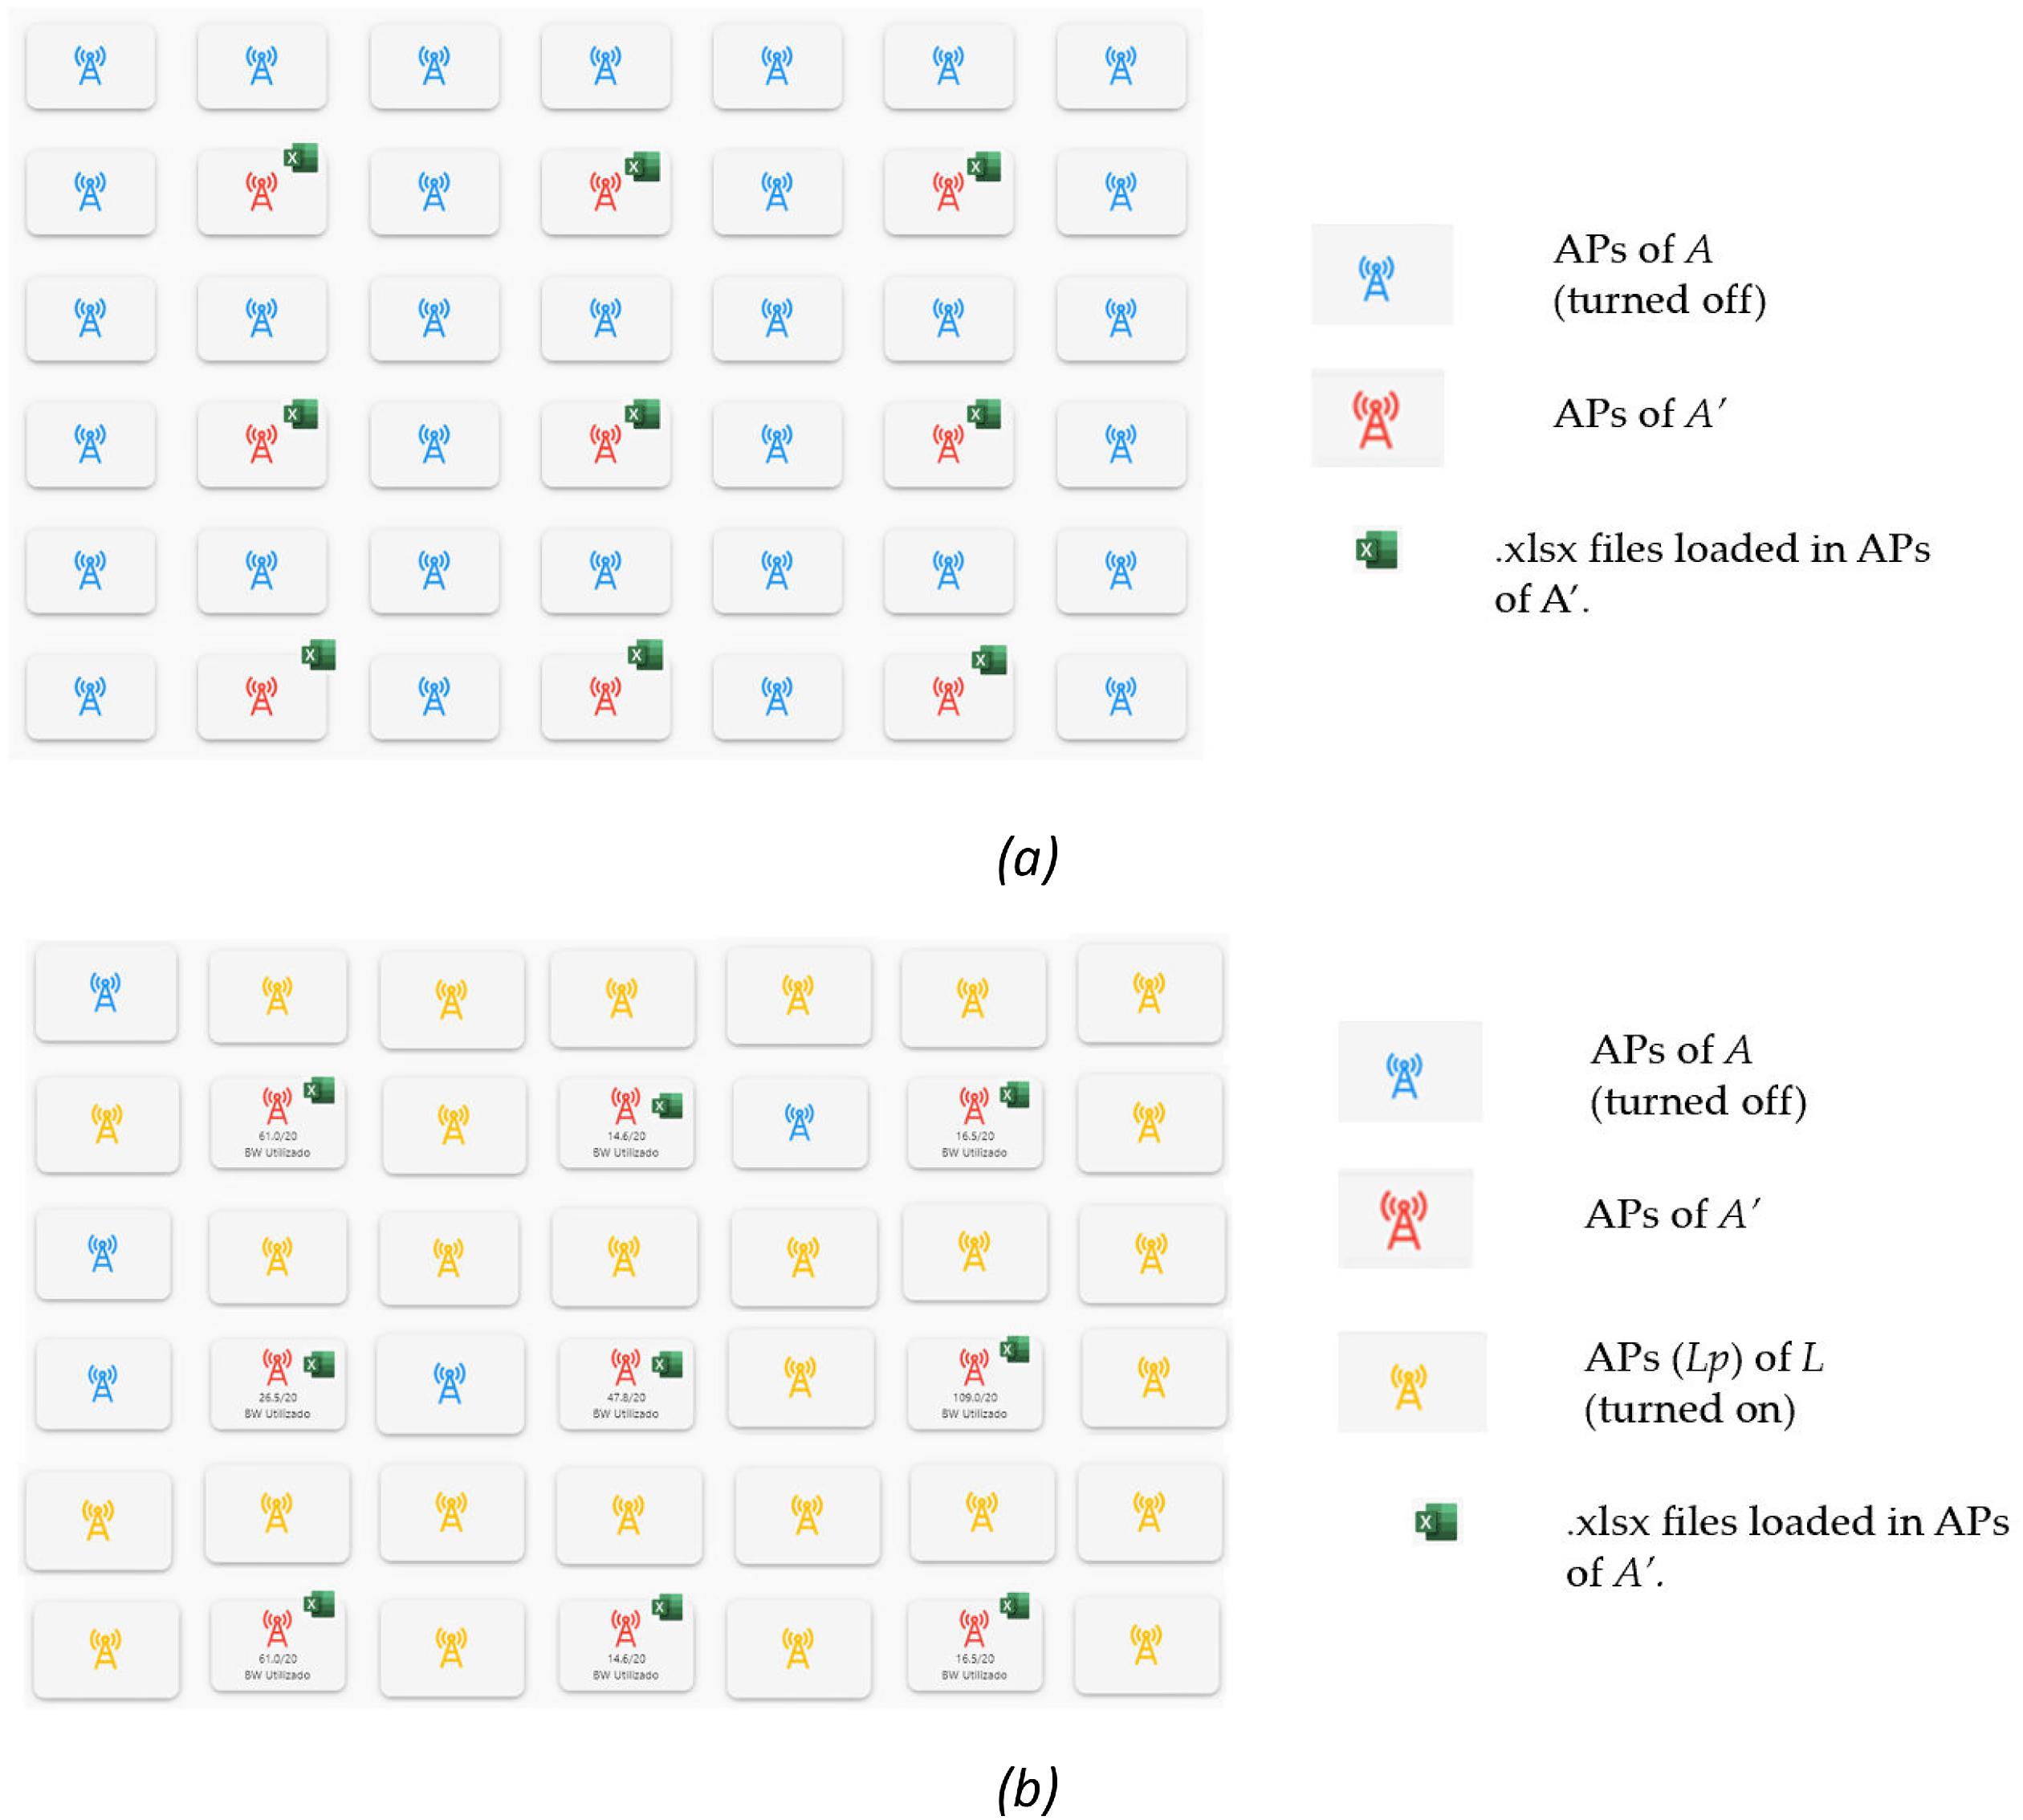
Our model was applied to the UTS network by developing a simulator to implement the Turn_On_APs and Turn_Off_APs algorithms using the Google Flutter Software Development Kit (SDK) (Kishore et al. 2022) as a native desktop application for Microsoft Windows©. Our simulator loaded Microsoft Excel© files (.xslx) with information about the throughput of the network. We carried out a heavy campaign of measurements for 3 months to obtain deep knowledge of the behavior of the UTS network. Figure 14a shows the graphical user interface (GUI) for the Tekné building (the APs were arranged in a rectangular grid). Initially, the 42 APs were turned off (blue), then manually, the | A′' | = 9 APs (red with .xlsx file icon) were turned on. In those APs, the Microsoft© Excel files were loaded. Starting at 00:00 h, Turn_On_APs and Turn_Off_APs algorithms were simulated every half hour. The results are shown in Fig. 14b. By coloring in yellow, the APs (Lp) of L were turned on.
Fig. 14.
The results of the simulations were the AE matrices for the Tekné, Paideía, and Arkhé buildings. The resulting matrices were obtained in an .xlsx format file. Figure 15 shows a graphical representation of the AE matrix for the APs of the Tekné building. Each element of matrix AE is represented by an Excel cell: a white cell if the AP status is turned off and a black cell if it is turned on.
Fig. 15.
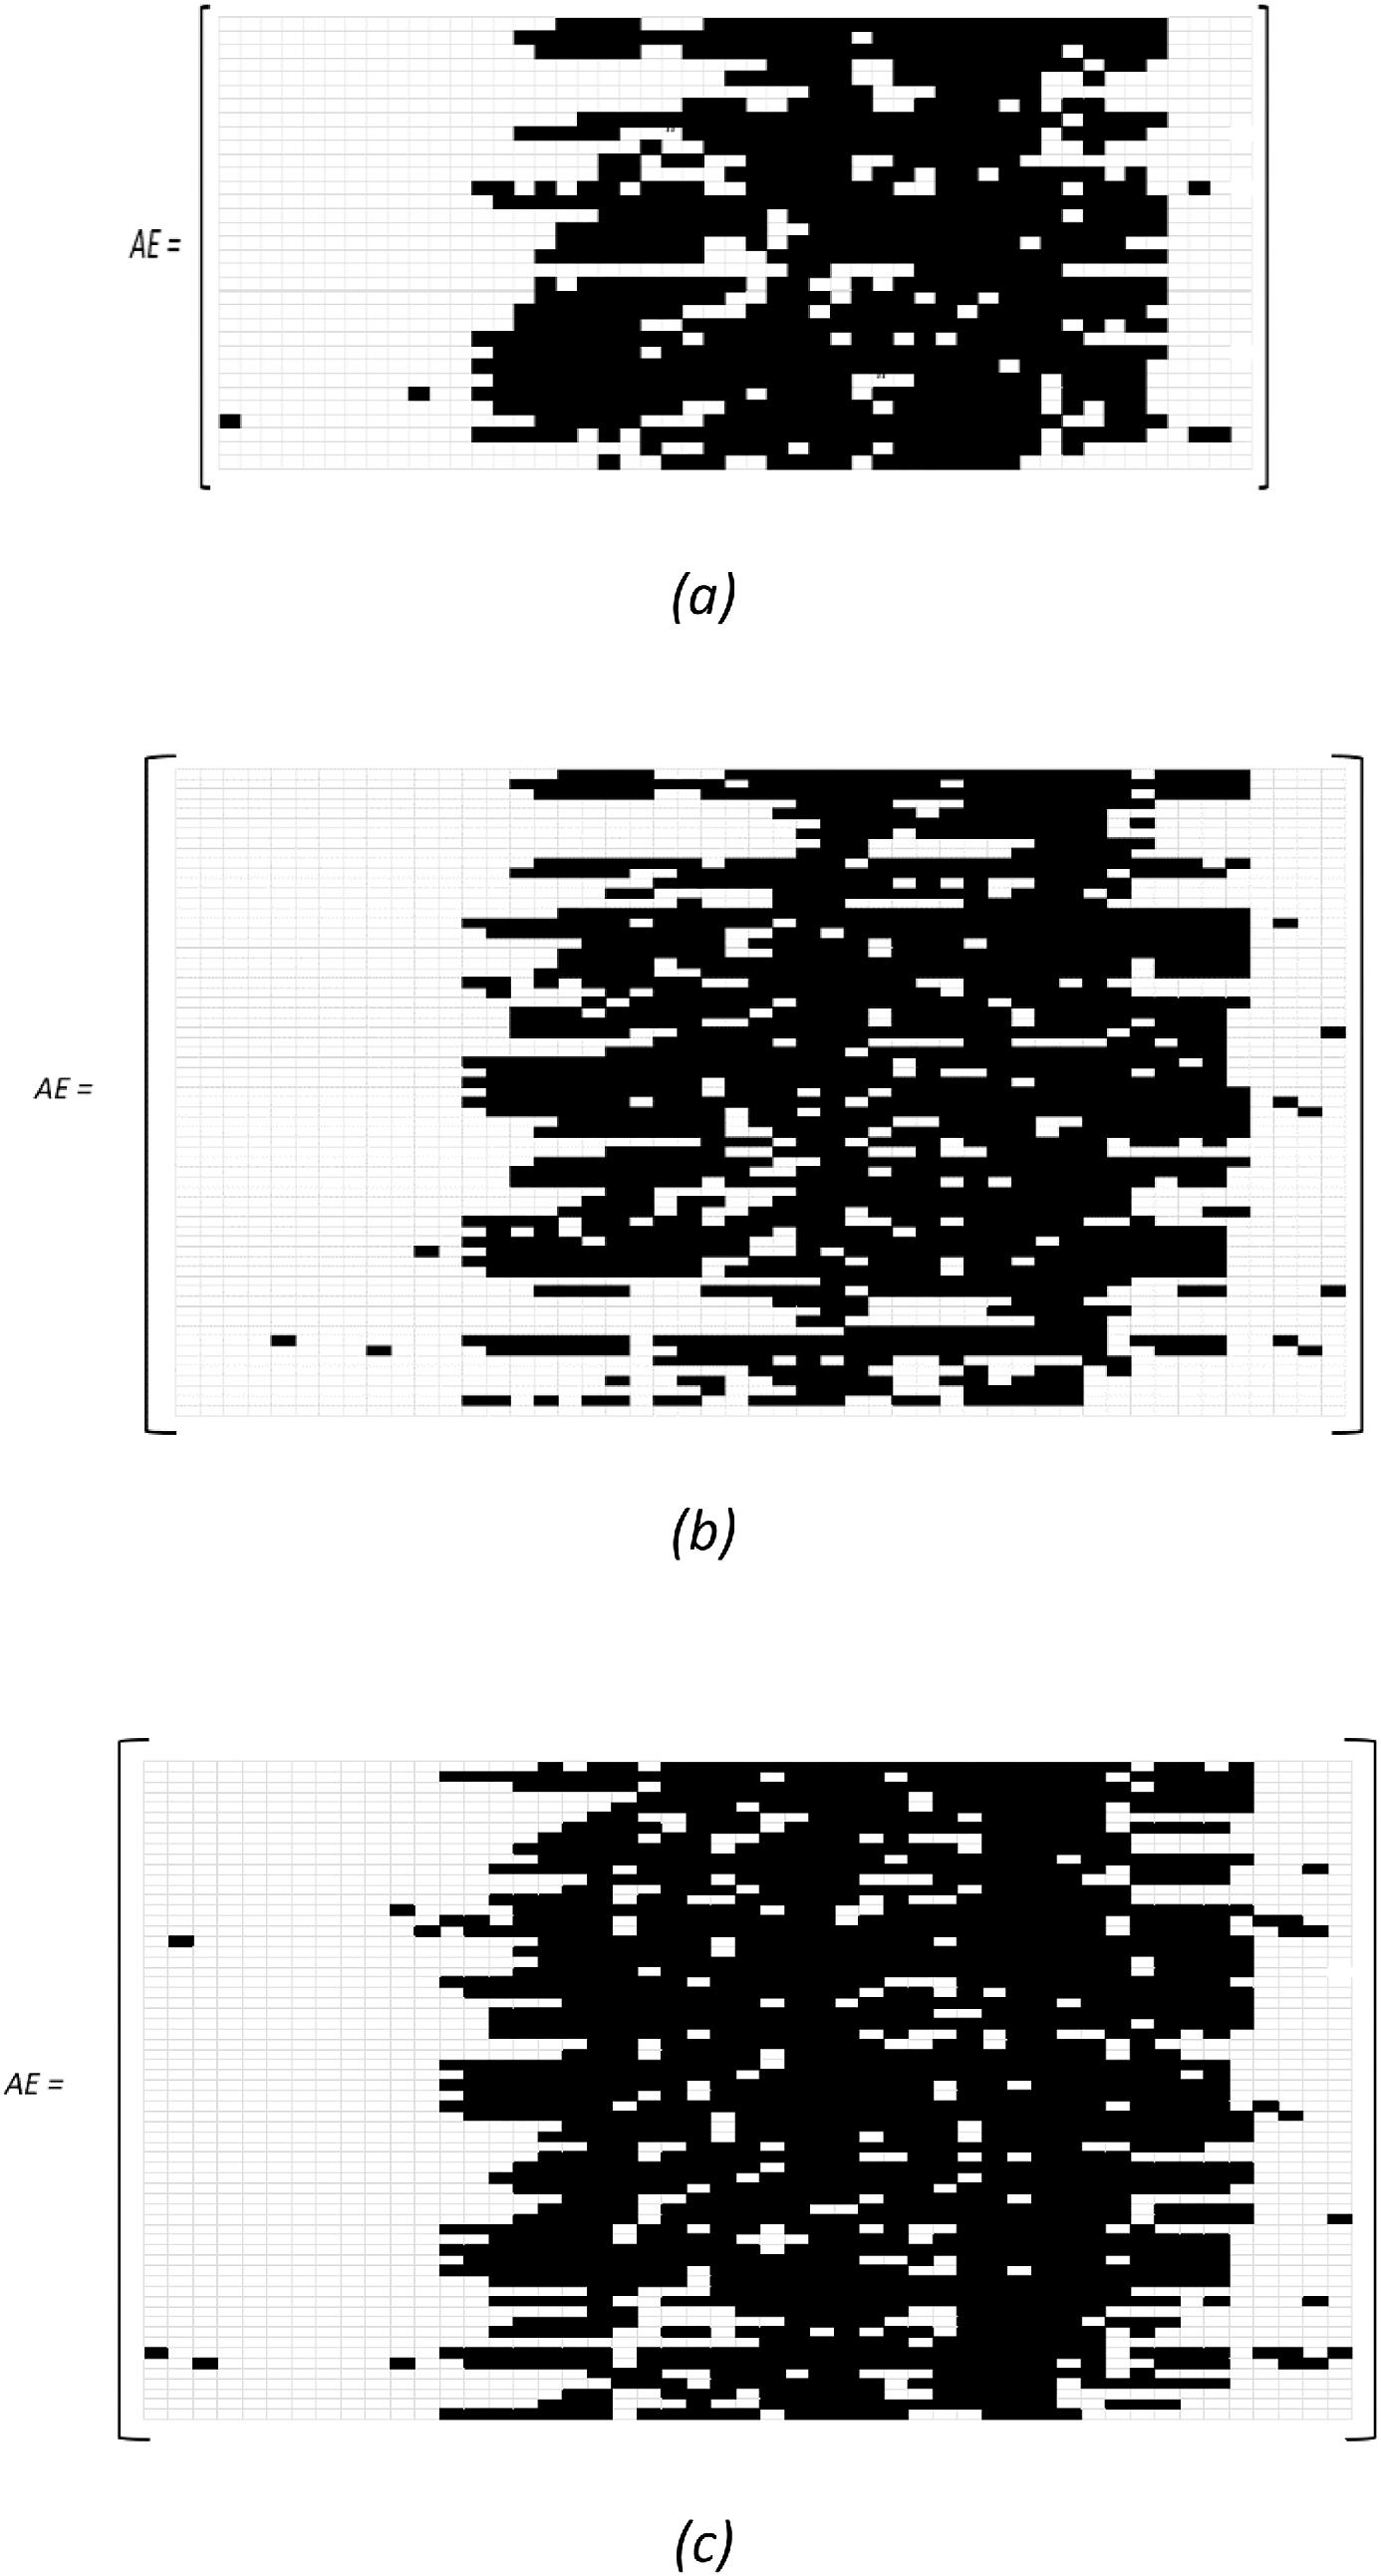
The value of Ta was obtained with the sum of the white cells in the graphical representation of the matrix AE. That is, the sum of the elements of the AE matrix that represent turned-off APs. The calculated value of Ta for the Tekné building network is:
(20)
Table 3 shows the Ta and PA values obtained for each of the networks of the UTS buildings. We calculated the values of ESA from PA, z, and Ta. The values of Ta, Ts, and Tr were obtained considering the time intervals ti = 30 min. To express the values of ESA, ESS, and ESR in kWh, the values of Ta, Ts, and Tr must change and be expressed in hours.
Table 3.
| Tekné | Paideía | Arkhé |
|---|---|---|
| PA = 7 W | PA = 7 W | PA = 7 W |
| Ta = 381 h | Ta = 744 h | Ta = 758 |
| z = 33 | z = 65 | z = 65 |
| ESA = 2.7 kWh | ESA = 5.2 kWh | ESA = 5.3 kWh |
The value of Ta was calculated considering all (z) the APs of A in the networks of each of the UTS buildings. For this reason,
(21)
The ESA value of the UTS network results from the sum of the values of each of the Tekné, Paideía, and Arkhé buildings:
(22)
We used the scikit-learn free software machine learning library for Python for the clustering (Song et al. 2021). This library includes the Ward hierarchical clustering algorithm. Ward's hierarchical clustering method from machine learning allowed us to compute the SE and calculate the values of Ts (Murtagh and Legendre 2014). Ward hierarchical clustering is a type of unsupervised learning algorithm that is used to cluster unlabeled data. The Ward clustering technique is based on the variance or dissimilarity of the data. The results of Ward's hierarchical clustering are presented with a dendrogram. The vertical axis of the dendrogram represents the dissimilarity Dh and the horizontal axis represents the APs of A. Figure 16a shows the dendrogram resulting from the clustering of the APs of A in the Tekné building. The number of intersections of the horizontal dashed line with the dendrogram represents the number of AP groups of A. For the Tekné building, two clusters are taken (S1 and S2), corresponding to the value of |S|= 2. For the first cluster, S1, |A|= 16, and for the second cluster S2, the value |A|= 17. The value |S|= 2 assigned to the Tekné building corresponded to the SW used for each of the groups S1 and S2. Figures 16b and 16c show the dendrograms resulting from the grouping of the APs of A for the Paideía and Arkhé buildings. From the value of |S|= 4, four groups (S1, S2, S3, and S4) were calculated for the Paideía and Arkhé buildings. The horizontal line drawn on the dendrogram intersects the dendrogram at four points.
Fig. 16.
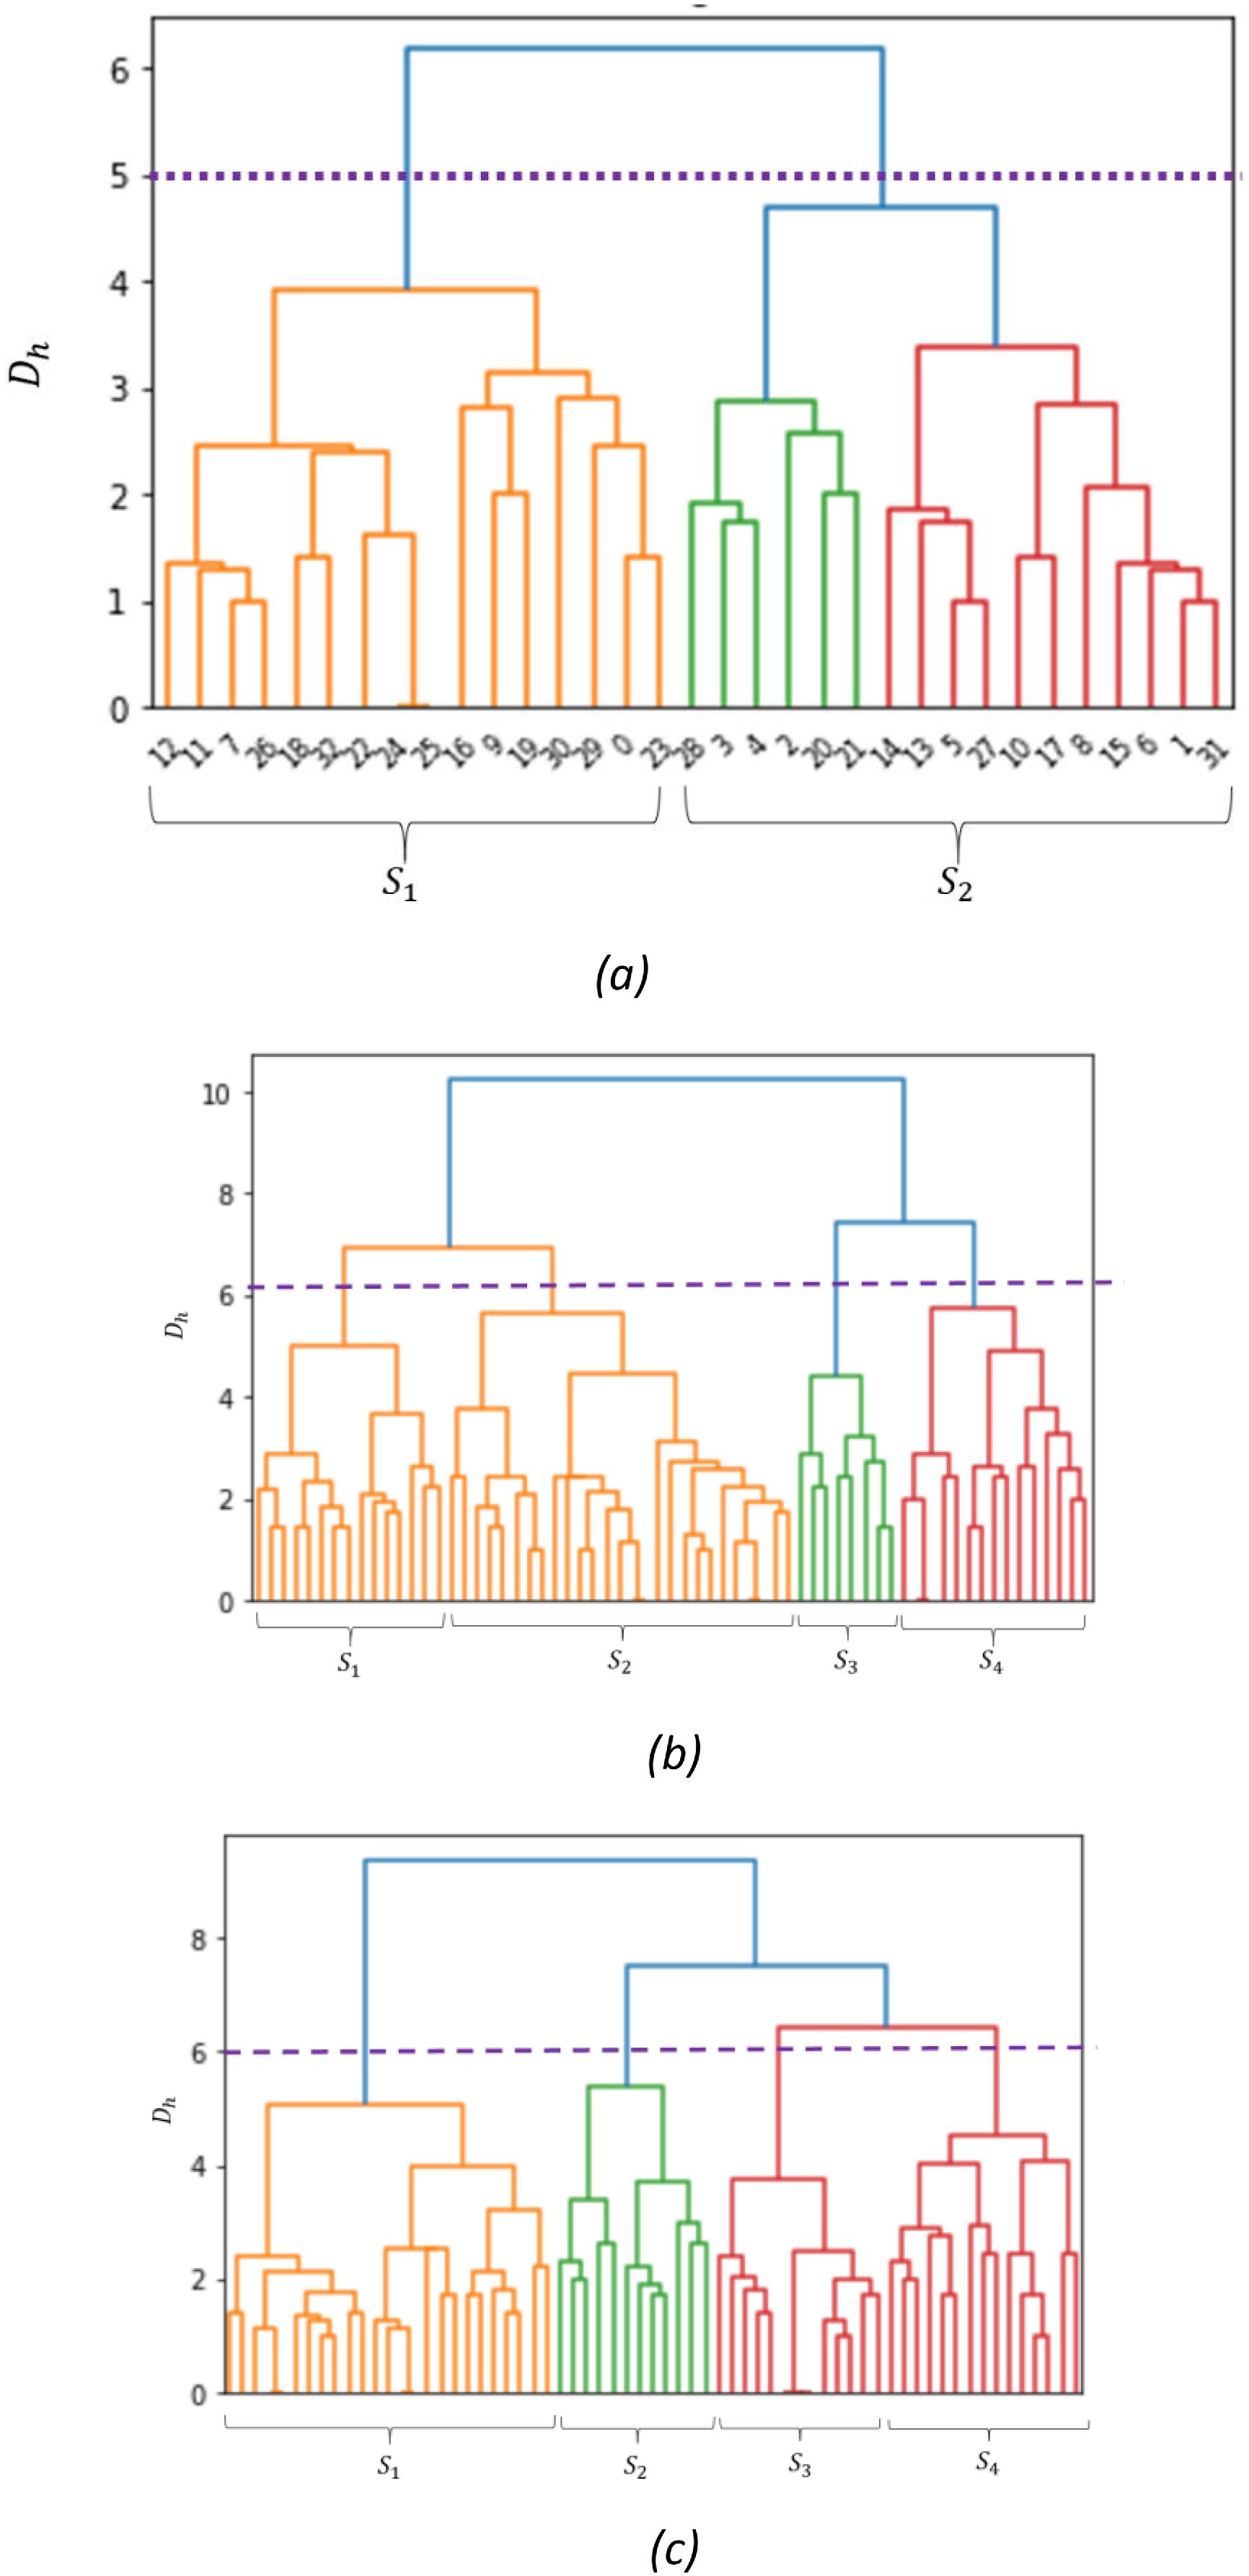
Figure 17 shows the three SE matrices for each of the Tekné, Paideía, and Arkhé buildings.
Fig. 17.

The resulting Ts in hours for each of the Tekné, Paideía, and Arkhé buildings are shown in Table 4.
(23)
Table 4.
| Tekné | Paideía | Arkhé |
|---|---|---|
| Ps = 120 W | Ps = 120 W | Ps = 120 W |
| Ts = 13.5 h | Ts = 28 h | Ts = 23.5 h |
| s = 2 | s = 4 | s = 4 |
| ESS = 1.6 kWh | ESS = 3.4 kWh | ESS = 2.8 kWh |
To calculate Tr, the times of a single router are taken as shown in Fig. 18.
Fig. 18.

The result was Tr = 2 h.
From the power value of PR = 240 W and the value for the = 1, the resulting of ESR is:
(24)
The ES in the network devices was:
(25)
Figure 19 shows the behavior of energy savings during a period of one day with time intervals of half an hour. In slots of low network traffic, energy savings reached 2.6 kW. In high hours where the network traffic is very high, no energy was saved because all the devices were turned on.
Fig. 19.
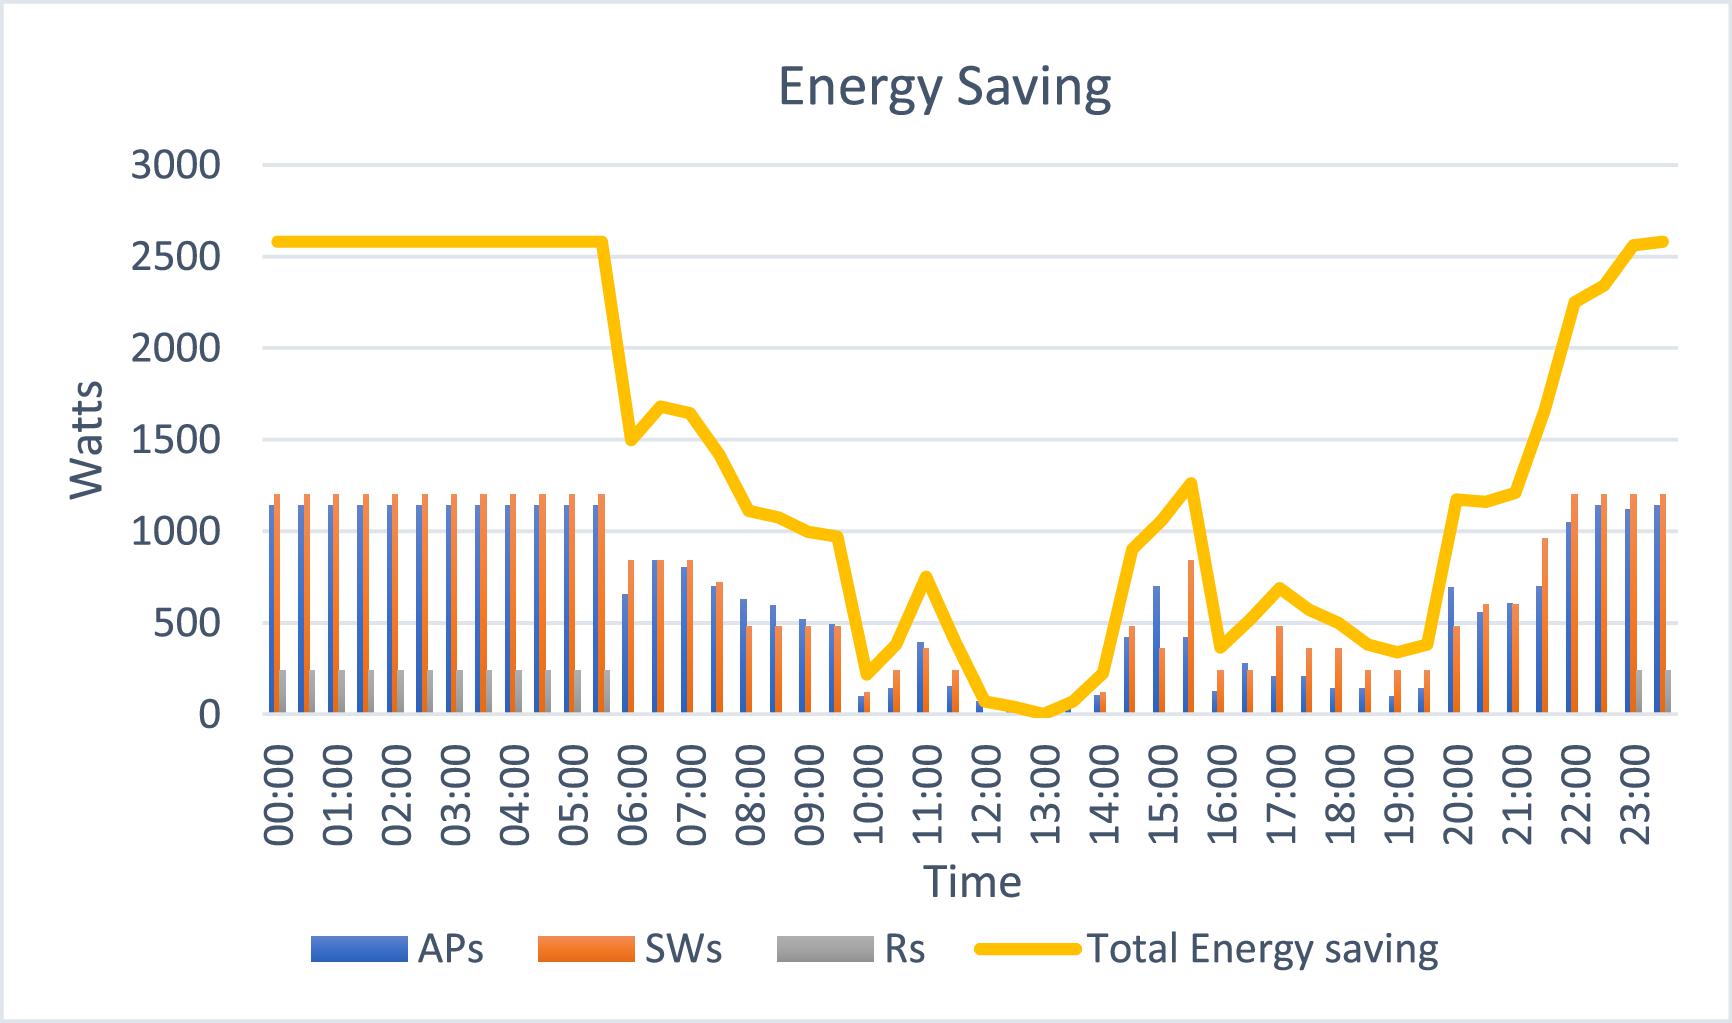
From 00:00 h until 06:00 h, the network throughput is very low, and only A', S', and R' were turned on. The same happens from 20:00 h until the end of the day. In these hours of the day, the energy savings were 2.6 kWh. On the contrary, between 06:00 h and 20:00 h, the network throughput increased, and our model was forced to turn on the A, S, and R, causing a decrease in energy savings. The energy savings in the UTS network in 1 day were 21.5 kWh.
5. Discussion
The energy savings model was analyzed by varying the values of key parameters. Model tests were performed with tivariations and the same daily traffic load in the APs of A′. With ti = 15 min, the value of ES = 21.3 kWh (no change in ES). With ti = 60 min, the value of ES = 18.3 kW. The higher the ti, the lower the ES.
With the value of the parameter T = 1440 min and due to the low traffic load, the energy savings on weekends and student vacations were not included in the model. We analyzed the behavior of the model with l = 1 and varied the parameter . We used the same threshold value for all APs as determined in Section 4.2. Table 5 shows the results of the simulations. With = 15 Mbps and = 20 Mbps, the energy savings decreased considerably. With = 25 Mbps, all APs were forced to be turned on, and the energy savings were 21.5 kWh. With = 50 Mbps, 9 APs never turned on, and with = 100 Mbps, 13 APs were turned on.
Table 5.
| Energy savings | APs turn off | |
|---|---|---|
| 20.1 kWh | 15 Mbps | 0 |
| 20.9 kWh | 20 Mbps | 0 |
| 21.5 kWh | 25 Mbps | 0 |
| 21.9 kWh | 50 Mbps | 9 |
| 22.3 kWh | 100 Mbps | 13 |
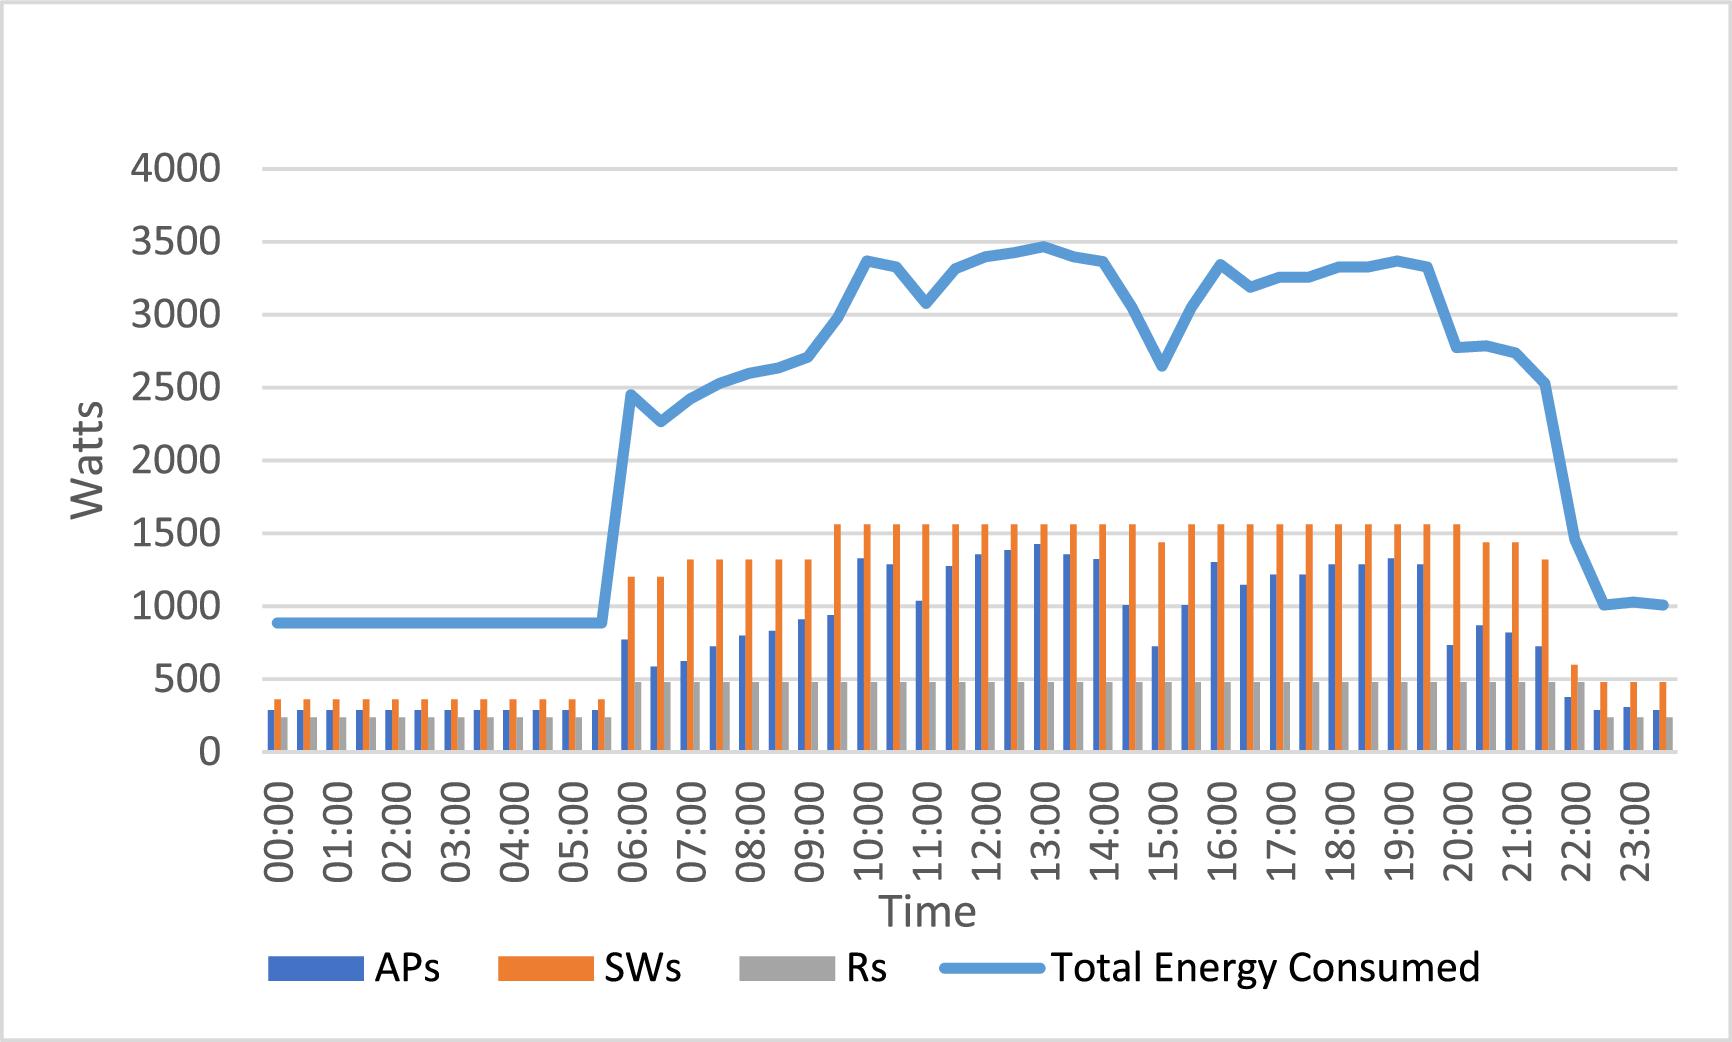
We compared the energy savings with the energy consumed by the APs, SW, and R in the UTS network. Figure 20 shows the energy consumed by each of the network devices and the total energy consumed. In slots of low throughput (from 00:00 to 06:00), the energy consumed was 287 kWh in 41 APs of A′, 360 kWh in 3 SWs of S′, and 240 kWh in 1 R of R′ (total energy consumed in slots of low throughput was 887 kWh). In slots of high throughput (from 13:00 to 14:00 h), the energy consumed was 1428 kWh in the 204 APs, 1560 kWh in the 13 SWs, and 480 kWh in the 2 Rs (total energy consumed in the slots of high throughput was 3468 kWh). When all the devices in the network (AP, SW, and R) were turned on (they did not use our energy savings method), they consumed a total of 84 kWh in a day. When those devices used our energy savings method, they consumed 61.7 kWh in one day (a reduction of 25% was obtained).
Fig. 20.
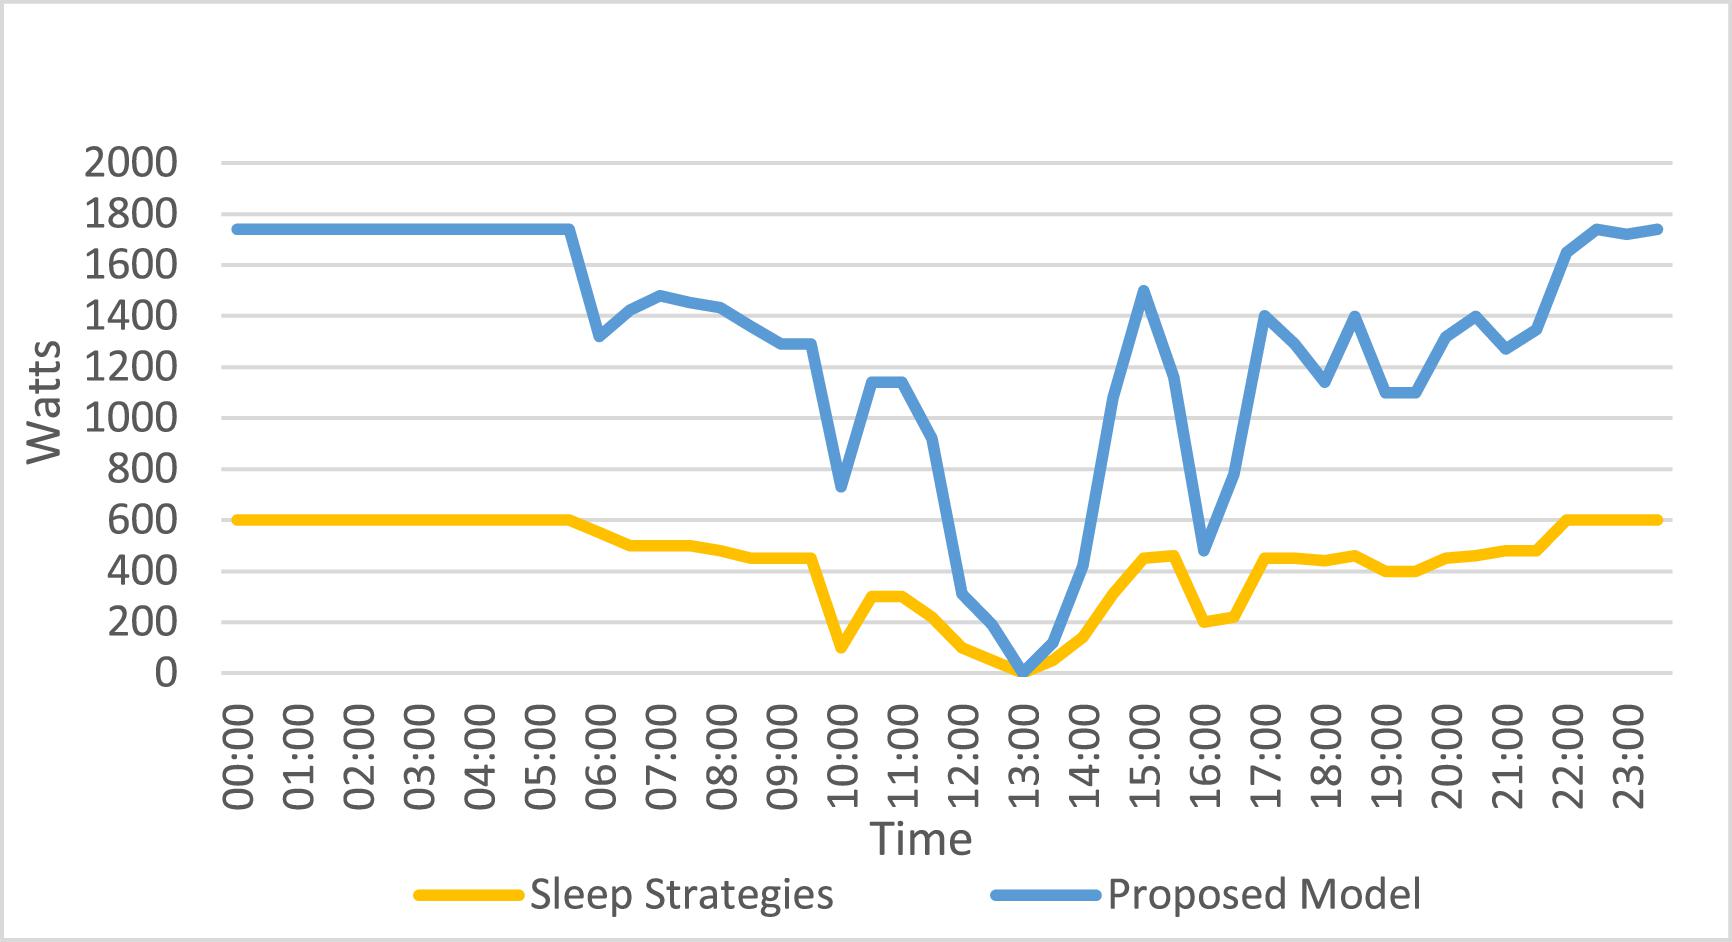
We contrasted our energy savings method with other strategies of energy savings in WiFi networks that suspend or force the devices to sleep (Peng et al. 2015). In Fig. 21, it is shown that in the slots of low throughput (00:00–06:00 h), the energy savings from suspending the APs was 0.6 kWh, and with our model, 1.7 kWh (1.1 kWh more). In slots of high throughput (06:00–12:00 h and 14:00–22:00 h), the proportion of energy savings between the two strategies was approximately the same (1.1 kWh). A particular case occurred at 14:00 h when the energy savings with the two strategies were the same. It was remarkable that while we applied our method to APs, SWs, and R, other methods like Oh et al. (2016) could only force the APs to sleep. Thus, our method can be applied to more devices in the network in an integral way.
Fig. 21.
We contrasted the extra energy consumption of the algorithms of our energy savings method (Turn_On_APs and Turn_Off_APs). They run on a managing server (it could be a SDN server executing those algorithms as network apps) that also executes the needed machine learning tools. The consumption used by the server processor (Oliveira et al. 2021) to implement our model did not exceed 7 W (normal consumption of a single AP). That is, it was negligible.
6. Conclusions
In this paper, we present a novel method for energy savings in dense hierarchical WiFi networks based on idle cycling and machine learning techniques. We specified a mathematical model for optimizing energy savings in APs, SWs, and Rs. Devices within the network were classified into two subsets: (a) devices (APs, SWs, and Rs) that remain always turned on; and (b) those that can be turned on and turned off based on network throughput. We developed a software tool to emulate the energy savings model using data collected from the WiFi network on the UTS campus. To calculate the key parameters, we required information about the number of devices, throughput characteristics, and geographic coverage of the UTS campus WiFi network. Based on this data, we computed the values of ti = 30 min, T = 1440 min, = 25 Mbps, and l = 1. Accurate estimation of these key parameters was crucial, as any inaccuracies could lead to inefficiencies in the energy savings model and impact load balancing across the APs in the WiFi network, ultimately affecting the user experience. We strategically plan the location of the APs of the WiFi network in the emulator through the GUI, using information about the geographic area of the UTS campus. Carrying out field visits and a preliminary study of the essential locations of wireless devices that remain connected to the WiFi network helped us plan the location APs of always connected devices. Inefficiently planning APs of always connected devices' locations could lead to issues related to network performance or availability when implementing our energy savings model.
The execution of the Turn_On_APs and Turn_Off_APs algorithms relied on throughput measurements from the UTS network. We employed the Ward hierarchical clustering technique from machine learning to define groups of APs associated with SWs and groups of SWs associated with R. Dendrograms provided clear graphical representations and were the most suitable choice for our model. Significant energy savings could be achieved using our approach in the UTS campus network. Our model's application to the UTS network showcased energy savings of 21.5 kWh per day. This total value of energy savings per day is the result of the sum of 13.2 kWh by the idle cycle technique and 8.3 kWh by the machine learning clustering technique. By implementing our energy savings model, the UTS WiFi network's consumption was reduced from 84 to 62.5 kWh per day. Finally, we remark that our method can be applied to wide-area campus WiFi networks with a hierarchical topology in which throughput measurements can be constantly read.
As future work, we summarize the following:
•
Implementation of an SDN server: one of the next steps in the evolution of this project would be implementing an SDN server to execute the developed model and control the turned on and turned off network devices such as AP, SW, and Rs. The model implemented in an SDN server would dynamically respond to network throughput changes and improve its efficiency. However, this approach will require time and resources, as it involves finding devices that support current SDN standards and properly programming the servers to run the algorithms.
•
Incorporation of additional network devices: In more complex and robust hierarchical WiFi networks, it is common to have network devices (Layer 3 switches) located between the switches and the routers. These devices can also be turned on or off based on network throughput. It is necessary to include these new devices and improve the energy-saving efficiency of the model in these large networks. For this, measurements of the throughput and power consumed by these devices in the network are required, which UTS currently does not have.
•
Algorithm optimization: By taking information about network throughput over a longer period, developed algorithms can be modified and further improve model efficiency. Increasing these time periods could include the student vacation season, improving the energy savings of our model. Unfortunately, increasing these times implies an increase in costs and resources.
Acknowledgements
The authors would like to thank Unidades Tecnológicas de Santander for their financial and in-kind support in this research.
References
Ashtari S., Abdollahi M., Abolhasan M., Shariati N., Lipman J. 2022. Performance analysis of multi-hop routing protocols in SDN-based wireless networks. Computers & Electrical Engineering, 97: 107393.
Benhamaid S., Bouabdallah A., Lakhlef H. 2022. Recent advances in energy management for Green-IoT: an up-to-date and comprehensive survey. Journal of Network and Computer Applications, 198: 103257.
Bousia A., Kartsakli E., Antonopoulos A., Alonso L., Verikoukis C. 2016. Game-theoretic infrastructure sharing in multioperator cellular networks. IEEE Transactions on Vehicular Technology, 65(5): 3326–3341.
Caballe M.C., Auge A.C., Lopez-Aguilera E., Garcia-Villegas E., Demirkol I., Aspas J.P. 2019. An alternative to IEEE 802.11ba: wake-up radio with legacy IEEE 802.11 transmitters. IEEE Access, 7: 48068–48086.
Casademont J., Lopez-Aguilera E., Paradells J. 2019. Wake-up radio systems for Cooperative-Intelligent Transport Systems architecture. In 2019 7th International Conference on Future Internet of Things and Cloud (FiCloud). pp. 358–363.
Chunyue Z., Tian H., Dong Y., Zhong B. 2021. An energy-saving routing algorithm for opportunity networks based on asynchronous sleeping mode. Computers & Electrical Engineering, 92: 107088.
Davis J.E. 2011. Killing watts: ghost loads at the University of Colorado Colorado Springs. p. 4.
Dhandapani A., Venkateswari P., Sivakumar T., Ramesh C., Vanitha P. 2022. Cooperative self-scheduling routing protocol based IOT communication for improving life time duty cycled energy efficient protocol in SDN controlled embedded network. Measurement: Sensors, 24: 100475.
Esrafilian-Najafabadi M., Haghighat F. 2021. Occupancy-based HVAC control systems in buildings: a state-of-the-art review. Building and Environment, 197: 107810.
Fang L., Xue G., Lyu F., Sheng H., Zou F., Li M. 2018. Intelligent large-scale AP control with remarkable energy saving in campus WiFi system. In 2018 IEEE 24th International Conference on Parallel and Distributed Systems (ICPADS). pp. 69–76.
Fu Y., Wang X. 2022. Traffic prediction-enabled energy-efficient dynamic computing resource allocation in CRAN based on deep learning. IEEE Open Journal of the Communications Society, 3: 159–175.
García Baquerizo G., P. J., Suárez A., Macias E., Salas E. 2019. Hardware mechanism for energy saving in WiFi access points. Sensors, 19(21): 4745.
Garcia-Morales J., Femenias G., Riera-Palou F. 2020. Energy-efficient access-point sleep-mode techniques for cell-free mmWave massive MIMO networks with non-uniform spatial traffic density. IEEE Access, 8: 137587–137605.
He P., Almasifar N., Mehbodniya A., Javaheri D., Webber J.L. 2022. Towards green smart cities using Internet of Things and optimization algorithms: a systematic and bibliometric review. Sustainable Computing: Informatics and Systems, 36: 100822.
Hetting C. 2022. University of Michigan deploys colossal wi-fi 6E campus network. Wi-Fi NOW Global. Available from https://wifinowglobal.com/news-and-blog/university-of-michigan-deploys-colossal-wi-fi-6e-campus-network/.
Ho T.-V., Deville Y., Bonaventure O. 2014. Multi-objective traffic engineering for data center networks. Computer Networks, 65: 167–182.
Igual J., Catalan M., Catalan-Cid M., Vazquez-Gallego F., Fernandez J., Munoz R., et al. 2022. Demonstration and evaluation of precise positioning for connected and automated mobility services. In 2022 Joint European Conference on Networks and Communications & 6 G Summit (EuCNC/6 G Summit). pp. 267–272.
Jalalian A., Yousefi S., Kunz T. 2023. Network slicing in virtualized 5 G core with VNF sharing. Journal of Network and Computer Applications, 215: 103631.
Jimenez J.M., Romero O., Lloret J., Diaz J.R. 2019. Energy savings consumption on public wireless networks by SDN management. Mobile Networks and Applications, 24(2): 667–677.
Kishore K., Khare S., Uniyal V., Verma S. 2022. Performance and stability comparison of react and flutter: cross-platform application development. In 2022 International Conference on Cyber Resilience (ICCR). pp. 1–4.
Lloret J., Sendra S., Macias-Lopez E. 2019. Editorial: advances in green communications and networking. Mobile Networks and Applications, 24(2): 653–656.
Manjate J.A., Hidell M., Sjodin P. 2018. Can energy-aware routing improve the energy savings of energy-efficient ethernet? IEEE Transactions on Green Communications and Networking, 2(3): 787–794.
Marrero D., Macías E., Suárez Á., Santana J.A., Mena V. 2019. Energy saving in smart city wireless backbone network for environment sensors. Mobile Networks and Applications, 24(2): 700–711.
Montazerolghaem A. 2022. Software-defined internet of multimedia things: energy-efficient and load-balanced resource management. IEEE Internet of Things Journal, 9(3): 2432–2442.
Murtagh F., Legendre P. 2014. Ward's hierarchical agglomerative clustering method: which algorithms implement Ward's criterion? Journal of Classification, 31(3): 274–295.
Naman D., Abdulwahab M., Ibrahim A. 2020. RADIUS authentication on Unifi Enterprise System controller using zero-handoff roaming in wireless communication. Journal of Applied Science and Technology Trends, 1(3): 118–124.
Number of Internet Users 2016. Internet live stats. (s. f.). Recuperado 5 de febrero de 2023. Available from https://www.internetlivestats.com/internet-users/.
Oh H., Newaz S.H.S., Park S., Choi J.K. 2016. Maximizing energy efficiency in off-peak hours: a novel sleep scheme for WLAN access points. In NOMS 2016 - 2016 IEEE/IFIP Network Operations and Management Symposium. pp. 342–348.
Oliveira T.F., Xavier-de-Souza S., Silveira L.F. 2021. Improving energy efficiency on SDN control-plane using multi-core controllers. Energies, 14(11): 3161.
Onik M., Al-Zaben N., Phan Hoo H., Kim C.-S. 2017. MUXER—a new equipment for energy saving in ethernet. Technologies, 5(4): 74.
Parwez M.S., Rawat D.B., Garuba M. 2017. Big data analytics for user-activity analysis and user-anomaly detection in mobile wireless network. IEEE Transactions on Industrial Informatics, 13(4): 2058–2065.
Peng H., Wang W., Wang C., Chen G., Zhang Y. 2015. A SDN-based energy saving strategy in wireless access networks. China Communications, 12(8): 132–145.
Qu J. 2022. Research on energy saving of computer rooms in Chinese colleges and universities based on IoT and edge computing technology. Heliyon, 8(10): e10970.
Ruiz M.A.G. (s. f.). LA OPORTUNIDAD DEL ESTÍMULO FISCAL A LA EFICIENCIA ENERGÉTICA EN LA REHABILITACIÓN DE INMUEBLES PARA LOGRAR LA SOSTENIBILIDAD EN LA VIVIENDA. 20.
Shi Z., Tian Y., Wang X., Pan J., Zhang X. 2021. Po-Fi: facilitating innovations on WiFi networks with an SDN approach. Computer Networks, 187: 107781.
Sidam A., Koutarapu P., Methuku M., Vuyyala S. 2022. A comparative analysis on benefits of unscheduled automatic power save delivery over legacy power save mode in IEEE 802.11 wireless networks. In 2022 9th International Conference on Computing for Sustainable Global Development (INDIACom). pp. 551–555.
Silva P., Almeida N.T., Campos R. 2019. A comprehensive study on enterprise wi-fi access points power consumption. IEEE Access, 7: 96841–96867.
Song J., De Veciana G., Shakkottai S. 2021. Online learning for hierarchical scheduling to support network slicing in cellular networks. Performance Evaluation, 152: 102237.
Suárez A., Elbatsh K.A., Macías E. 2010. Gradient RSSI filter and predictor for wireless network algorithms and protocols. Network Protocols and Algorithms, 2(2): 1–26.
Traunmueller M.W., Johnson N., Malik A., Kontokosta C.E. 2018. Digital footprints: using WiFi probe and locational data to analyze human mobility trajectories in cities. Computers, Environment and Urban Systems, 72: 4–12.
Tripathi Y., Prakash A., Tripathi R. 2022. A novel slot scheduling technique for duty-cycle based data transmission for wireless sensor network. Digital Communications and Networks, 8(3): 351–358.
UniFi—PoE Availability and Modes. (s. f.). Ubiquiti Support and Help Center. Recuperado 5 de febrero de 2023. Available from https://help.ui.com/hc/en-us/articles/115000263008-UniFi-PoE-Availability-and-Modes.
Wang H., Xie J., Han T. 2017. V-handoff: a practical energy efficient handoff for 802.11 infrastructure networks. In 2017 IEEE International Conference on Communications (ICC). pp. 1–6.
Xu F., Hu X., Luo S., Shang J. 2020. An efficient indoor wi-fi positioning method using virtual location of AP. International Journal of Geo-Information, 9(4): 261.
Yang Y., Liu Z., Zhu H., Guan X., Chan K.Y. 2023. Energy minimization by dynamic base station switching in heterogeneous cellular network. Wireless Netw, 29(2): 669–684.
Youngseok L., Kyoungae K., Yanghee C. 2002. Optimization of AP placement and channel assignment in wireless LANs. In 27th Annual IEEE Conference on Local Computer Networks, 2002. Proceedings. LCN 2002. pp. 831–836.
Yu H., Cheung M.H., Iosifidis G., Gao L., Tassiulas L., Huang J. 2017. Mobile data offloading for green wireless networks. IEEE Wireless Communications, 24(4): 31–37.
Information & Authors
Information
Published In

FACETS
Volume 9 • 2024
Pages: 1 - 19
Editor: Philippe Lavoie
History
Received: 11 September 2023
Accepted: 16 November 2023
Version of record online: 9 May 2024
Copyright
© 2024 The Author(s). This work is licensed under a Creative Commons Attribution 4.0 International License (CC BY 4.0), which permits unrestricted use, distribution, and reproduction in any medium, provided the original author(s) and source are credited.
Data Availability Statement
All relevant data are within the paper.
Key Words
Sections
Subjects
Plain Language Summary
Energy savings in the consumption of electronic devices used in WiFi networks
Authors
Author Contributions
Conceptualization: RA, AS
Data curation: RA, AS
Formal analysis: RA, AS
Funding acquisition: RA, AS
Investigation: RA, AS
Methodology: RA, AS
Project administration: RA, AS
Resources: RA, AS
Software: RA, AS
Supervision: RA, AS
Validation: RA, AS
Visualization: RA, AS
Writing – original draft: RA, AS
Writing – review & editing: RA, AS
Competing Interests
The authors have declared that no competing interests exist.
Funding Information
Unidades Tecnológicas de Santander
Metrics & Citations
Metrics
Other Metrics
Citations
Cite As
Ricardo Alvarado and Alvaro Suárez. 2024. A novel energy-saving method for campus wired and dense WiFi network applying machine learning and idle cycling techniques. FACETS.
9: 1-19.
https://doi.org/10.1139/facets-2023-0164
Export Citations
If you have the appropriate software installed, you can download article citation data to the citation manager of your choice. Simply select your manager software from the list below and click Download.
Cited by
1. Machine Learning for Interference Management in Dense Wireless Networks
