Open access

Contingent strategies of risk management by snowshoe hares

Publication: FACETS
19 August 2019

Abstract

Prey individuals employ several adaptive behaviours to reduce predation risk. We need to learn how those behaviours interact in an overall strategy of risk management, how strategies vary with changing conditions, and whether some behaviours might compensate for others. I addressed these issues with manipulative experiments evaluating how snowshoe hares’ (Lepus americanus) vigilance varies with their giving-up densities (GUDs) in artificial food patches. I tested whether the results, collected when there was no evidence of predation, were congruent with an earlier study under higher predation. When predator sign was common, vigilance depended directly on habitat. But when risk was low, habitat’s influence on vigilance was indirect. Hares were least vigilant during the new moon where the distance to escape habitat was far, but only in open risky habitat. Hares were more vigilant during the full moon, but only at stations far from escape habitat. Moon phase and additional cover had no effect on GUDs that were highest at open risky stations far from escape habitat. The results suggest that reduced risk allowed hares to allocate less time to vigilance, but they needed to forage for similar amounts of food during each moon phase to maintain their energetic state.

Graphical Abstract

Introduction

Prey individuals can use a variety of behavioural options to reduce risks of predation while foraging. Prominent among them are (i) time allocation (when and how long to forage), (ii) space use (habitat and patch selection), (iii) apprehension (detecting risk by being alert or vigilant), and (iv) foraging tenacity (capability to maintain feeding rates in the presence of predation risk) (Fraser and Gilliam 1987; Brown and Kotler 2004; Morris and Vijayan 2018). The forager’s use of each mechanism will depend on the lethality of predators and the probability of encountering them (Brown 1999; Dupuch et al. 2014), the forager’s marginal value of energy (Brown 1988; McArthur et al. 2014; Monclús et al. 2015; Bannister and Morris 2016), the pattern of risk through time (Lima and Bednekoff 1999; Higginson et al. 2012), the density and distribution of competing individuals (China et al. 2008; Morris 2009; Dupuch et al. 2014), and trade-offs between the quality of resources and the risks of harvesting them (Lima and Dill 1990; McArthur et al. 2014).
The existence of multiple options, and their dependence on numerous features of the foragers and their environment, suggests flexible foraging strategies that are contingent on the temporal and spatial dynamics of risk (Gigliotti and Diefenbach 2018). If we are to test underlying theory, sort through the many possible ways that different behaviours might interact (Kotler et al. 2016), and evaluate why they do or do not change through time, then we need replicated studies that measure multiple risk-reduction options (e.g., Altendorf et al. 2001). Such studies are plagued by logistical constraints, difficulties in analysis, and interpretations of data in the context of numerous possible strategies. One way to overcome some of these limitations is to design experiments that can estimate behaviours, such as apprehension, indirectly from foraging data (Dall et al. 2001; Kotler et al. 2010). A better option is to merge those experiments with direct observations on foraging animals.
Experiments on risk management by snowshoe hares (Lepus americanus) illustrate that, indeed, it is possible to assess space use, time allocation, vigilance, and foraging tenacity directly and simultaneously (Morris and Vijayan 2018). The experiments revealed that snowshoe hares used vigilance and foraging tenacity as their main mechanisms to manage risk. The hares’ use of a limited suite of possible behaviours suggests that risk-management strategies may be relatively simple and possibly constant. If this optimistic outcome is generally true, then we should be able to gain general insights into risk management by measuring only key mechanisms in well-designed experiments. However, if strategies are variable and context dependent, then we must broaden our focus to assess the panoply of potential strategies, but with the goal of associating them with a mechanistic theory of risk management. With these points in mind I ask, “Do snowshoe hares employ similar strategies of risk management across a wide range of conditions? If not, are the malleable and contingent options that hares use to manage risk consistent with expectations from theory?”
I begin with a short summary of cogent theory that can guide experiments assessing how time allocation and vigilance interact to reduce predation risk. I give a brief overview of why snowshoe hares are suitable for testing the theory. I then describe the field and statistical design of a foraging experiment aimed at testing whether the hares’ risk-management strategy is more or less stereotyped through time and space or if the hares mix, match, and trade-off options against one another. The results reveal a variety of main effects and interactions that at first sight might appear at odds with theory. I demonstrate that the results are nevertheless completely consistent with theoretical predictions and conclude by revisiting the fit of data with general concepts of risk management.

Conceptual context

Assume that time-limited individuals forage in a manner that maximizes the rate of energy gain. If they do so, then quitting-harvest rates (QHR) in any given resource patch will equal the combined costs associated with energy devoted to foraging, the risk of being killed while in the patch, and the missed opportunities of not spending time on other activities related to evolutionary fitness (Brown 1988). Thoughtful experiments can control for both the energetic cost of foraging and missed opportunities. They enable an assessment of how effective time allocation and vigilance are at reducing predation costs. More specifically, if vigilance reduces mortality risk for any individual (i), then its optimal vigilance is given by (Brown 1999):
ui*=miFfibi(Fe)kibi
(1)
Equation (1) demonstrates that an individual’s optimal vigilance will increase with the rate at which it encounters predators (m), its expected fitness (F) if it survives the foraging bout, and how lethal (1k) the predator is (Brown 1999; Kotler and Brown 2017). Optimal vigilance will decrease with the effectiveness of vigilance at reducing risk (b), harvest rates that can be obtained in the absence of vigilance (f) and the marginal value of fitness in terms of energy (Fe) . Equation (1) thus specifies how time allocation and vigilance can balance the risks and benefits of foraging (Brown 1999). A forager’s harvest rate declines proportional to the amount of vigilance (1 − u)f (Houston et al. 1993; Brown 1999), so eq. (1) can also be used to predict the expected trade-offs between foraging and vigilance.
The consequences of trade-offs are easily understood by considering a forager exploiting safe versus risky patches. Its harvest rate declines with the amount of time that it forages in a patch. To maximize energy gain, the forager should exploit both patches to the same QHR (Charnov 1976; Brown 1988). Imagine that the forager attains that equilibrium by allocating more vigilance to the riskier patch. Increased vigilance reduces the harvest rate. Thus, when the individual ceases to forage, the safer of the two patches will contain less food (the giving-up density (GUD), Brown 1988) than will the risky one.
Now contemplate a scenario under which foragers in a low energetic state harvest the minimum amount of food required for survival. The forager’s high marginal value of energy reduces vigilance (eq. (1)). Such foragers are likely to allocate a minimal amount of vigilance while securing the minimum amount of food to survive (fixed energy demand) or, if their state is perilously low, forego risk allocation altogether (the Stalingrad effect, Brown et al. 1997; fixed amount foraging). Both effects will be reinforced if encounters with danger, and the risk associated with those encounters, are low. Suppressed vigilance allows the foragers to exploit both patches with similar efficiency. The forager will allocate foraging time more equally to each patch and the GUDs will converge.
Many studies of predation risk do not integrate the additional potential risk imposed by competing individuals. Time allocated to interactions with competitors is likely to further reduce harvest rates and thereby increase the cost of vigilance (e.g., (1 − u)αf, where 0 ≤ α ≤ 1 represents the competitive effect associated with time lost from foraging). Assuming that competition is costly, increased encounter rates with competitors will intensify vigilance. It is thus important to limit experiments to relatively short periods of time (18 d in this study). Changes in density associated with longer-term studies might complicate the ability to ascribe foraging behaviour to its root cause. The more important point is that competition can create patterns of vigilance and time allocation that otherwise might be attributed to predation (apparent predation risk, Morris 2009; Halliday and Morris 2013; Morris et al. 2017).

Materials and methods

Study system

I searched for consistency in risk management with controlled experiments on snowshoe hares foraging on jack-pine (Pinus banksiana) boughs (Morris 2005) during winter in northern Ontario, Canada. Predation risk for snowshoe hares is more intense in winter than during other seasons (Griffin et al. 2005). Hares forage singly, learn quickly to exploit resource patches, and travel among patches along well-used runways. Hares are a suitable model for studying risk management because they have easily recognized vigilant behaviours (Morris and Vijayan 2018) in response to high mortality from numerous mammalian and avian predators (Krebs et al. 2014) in a stressful landscape of fear (Boonstra et al. 1998; Sheriff et al. 2009). Fear in northern Ontario is induced by a variety of common predators including lynx (Lynx canadensis), coyotes (Canis latrans), wolves (C. lupus), red foxes (Vulpes vulpes fulva), fishers (Martes pennanti), pine martens (M. americana), mink (Neovison vison), and large owls (e.g., Strix nebulosi, S. varia, and Bubo virginianus) whose abundances vary through space and over time.
My design mimics that of Morris and Vijayan (2018) who quantified hare foraging on pine boughs placed in an open field versus thick alder habitats while wildlife cameras recorded the hares’ behaviour. The nutritional quality of jack-pine boughs, a favoured food of hares in winter (Bergeron and Tardif 1988), declines from the farthest tip towards the base (Palo et al. 1992; Hodson et al. 2010). Boughs thus represent a depletable resource patch with diminishing returns to browsers such as snowshoe hares. The diameter of the residual stem at the point of browse yields a reliable and repeatable estimate of the hares’ GUD (Morris 2005; Hodson et al. 2010; Morris and Vijayan 2018). The GUDs, in combination with time-synchronized photos, yield the basic data required to assess risk management and possible trade-offs between time allocation and vigilance.
Snowshoe hares living in 20-year-old cutovers and small overgrown farm fields regularly used several different runways to cross the sharp ecotone along an abandoned 1.5-km long logging road (= open-trail habitat) separating dense 4-m tall alder (Alnus viridis) and red pine (P. resinosa) “shrublands” growing on each side. I selected eight of these runways as experimental stations and placed one pair of identical foraging patches along the runway on each side of the ecotone between habitats (one patch in each habitat at each station, illustrated in Fig. S1). I manipulated risk in four different ways. (i) Distance: I subdivided the eight stations into two equal-sized groups representing four where the farthest distance from the “open” trail and adjoining dense habitat was between 3 and 5 m (near) versus the remaining four where the distance was between 7 and 15 m (far). (ii) Habitat: I evaluated hare foraging (GUDs) and vigilance (images recorded by remote cameras) in each foraging patch. (iii) Cover: I created four different risk treatments in the open-trail habitat by placing equal amounts of natural cover overhead of the patches (top), on the sides parallel to the hare runway (side), on both the side and top (both), or >5 m away from the patch (none). (iv) Moon phase: I assessed all three factors during the full moon (risky) and subsequent new moon (less risky). Snowshoe hares combat reduced winter survival during the full moon (Griffin et al. 2005) by occupying dense and putatively safer habitats (Gilbert and Boutin 1991; Gigliotti and Diefenbach 2018), but not in all studies (e.g., Griffin et al. 2005).

Field methods and data collection

I pounded metal t-bar fence posts through the snow pack and into frozen earth in the open habitat during late January 2018. I located the four posts at the corners of a 1-m square centred at 1.5 m from the ecotone. I strung a 6 mm polypropylene rope from post to post at 1.25-m height and used it to suspend alder branches providing overhead cover. I drove a fifth post into the ground at the ecotone and used it to mount two time-synchronized covert motion-detecting cameras (Reconyx “RapidFire PC90”, Homen, Wisconsin, USA). I placed the cameras back-to-back with equal fields of view to obtain exclusive images of hares in each habitat (Morris and Vijayan 2018).
I cut 160 1.5-m-long terminal alder branches for use as cover treatments (20 branches at each station). I arranged the boughs as treatments by either interweaving them on top of the suspension rope, imbedding the butt ends securely into snow to create a 1-m line of equally spaced branches on opposing sides of the support frame, or by sticking them in the snow between 5 and 10 m distance from the foraging station (for the control none treatment). I placed all 20 boughs on top of the suspension rope for the top treatment, 10 boughs on top and 5 boughs on each side for the both treatment, and 10 boughs on opposing sides for the side treatment. I provide photographs of the none and side treatments in Figs. S2 and S3).
I also cut 200 50-cm-long terminal boughs from 10–15-year-old jack-pine stands (∼20 km from the experimental site) 2 d before initiating each moon-phase treatment (400 boughs total) and stored them in an unheated shed. I measured the diameter at the base of 320 boughs with a vernier caliper (0.01 mm accuracy; mean = 7.375 mm, SD = 0.86) after excluding damaged or abnormally large (>10 mm) or small boughs (<5 mm) and any with cones. I marked each measured bough individually with a small piece of numbered orange flagging tape that I secured to the base with a thumbtack. I randomized the boughs among paired foraging patches and created two foraging patches per station by firmly implanting (5–10 cm) the base of two boughs into snow in each habitat at 1.5-m distance from the cameras. I placed the boughs in the open habitat in the center of the 1-m square treatment plots. Snow completely obscured the flagging-tape labels from foraging hares. I placed the boughs on opposite sides of the hare runway (∼20 cm apart). All patches were in place by early afternoon before hares began to forage. I allowed hares to forage on the boughs overnight and collected the residual boughs well after foraging ceased in the morning of the next day. I replaced the boughs with new ones, took the foraged boughs to my field office, and measured the diameter of each one at the point of browse (again with 0.01 mm accuracy). On some occasions, hares consumed all vegetation distal to a bulge in the stem near the base that had a greater diameter than the bough’s basal diameter. I recoded the cut points of these 13 boughs as equal to the basal diameter. I confirmed that hares were the only browsers consuming the stems by identifying tracks in the snow (that also reveal the presence of predators), characteristic bite angles associated with hare foraging, and by searching for other species in each of the more than 25 000 photographs recorded by the cameras.
I standardized all open stations 1 d before each experimental period with the both treatment, and allowed hares to forage on identical patches with two unmarked boughs in each habitat. I checked to ensure that hares foraged at each station before randomizing the treatments. I collected all of the browsed boughs and replaced them with the individually marked experimental ones. I wore large snowshoes during all fieldwork to minimize compression of the snow pack.
It is possible, given the spatial scale of my experiments, that an individual hare could visit more than one station during a single night of foraging. The potential for this effect to influence results is small because, (i) previous research documented that different stations were exploited simultaneously by different hares (Morris and Vijayan 2018), (ii) hares with individually recognizable phenotypes used only a single station, and (iii) even if a hare did visit more than one station, the effect on GUDs would require that it was the final forager to visit each one, and the effect on vigilance would be devalued by numerous images of other hares.
I set the cameras to record consecutive photographs with a 5 s delay. I viewed each photograph at the end of the experiment and recorded hare images as belonging to one of five classes of mutually exclusive behaviours: alert—head-up posture with ears pointing forward; vigilant—ears pointing forward while standing upright on only the back legs or sitting with an elevated posture and rigid front legs; feeding—clipping pine boughs, head-down searching for pine needles and stems or with food in the forager’s mouth; not-feeding—no clear evidence that the hare had food in its mouth or was actively searching for food in the patch; and partial image—images in which the portion of the hare in the camera’s field of view did not allow an unambiguous assignment to other categories. I calculated a single variable for “vigilance” as the sum of alert plus vigilant images because both revealed highly observant and apprehensive nonfeeding hares. I tallied images with two or more hares separately and scored their respective behaviours. I also counted all images that recorded one hare chasing or jumping over another.
Although my camera data must be highly correlated with the amount of time that hares spend in the foraging patches, they cannot be used easily to calculate QHRs, such as those generated from best-fit harvest curves (Morris 2014) or solution of Holling’s disc equation (Holling 1965; Kotler and Brown 1990; Brown 1999). The number of images of feeding hares should nevertheless approximate the total time allocated to foraging, and the difference in the number of images of foraging hares in paired patches should provide a reliable estimate of differences in foraging time. I used these differences, and the mean diameter of the two boughs at point of browse (GUD), to test the underlying relationships between QHRs and GUDs that emerge from the trade-offs between vigilance and time allocation imbedded in eq. (1) (e.g., if the GUDs in two patches are equal, then the QHR will be lower in the patch with the most images of foraging hares (more time spent foraging for the same net harvest)). All animals were cared for in accordance with the guidelines of the Canadian Council on Animal Care and all methods were approved by Lakehead University’s Animal Care Committee.

Experimental and statistical design

I allocated the four cover treatments (top, side, both, none) to the eight stations in a randomized double Latin square that accommodated my equal numbers of stations categorized as near and far. Each station received a different treatment on each of four consecutive days. I initiated the experiment 1 d before the 31 January 2018 full moon and repeated the entire design starting on 13 February 2018 (2 d prior to the subsequent new moon). Mean minimum and maximum temperatures were lower during the full-moon experiment (−27.9 and −16.6 °C, respectively) than during the new-moon experiment (−14.5 and −2.0 °C, respectively; temperatures recorded 35 km away by Environment Canada station ZTB, data downloaded from climate.weather.gc.ca/climate_data/ on 19 March 2018).
I was concerned that snowfall during the first night of the experiment on 30 January 2018 might have biased hare feeding strategies so I extended the experiment 1 d by repeating the 30 January treatment on 3 February 2018. I replicated this 5 d design during the new moon, then excluded the first day of each moon phase from analysis. Doing so yielded identically balanced designs for both treatment and pretreatment foraging during the two moon phases. The repeated measures of GUDs and vigilance across days maximized my ability to infer the direct and interactive effects of habitat, treatments, and moon phase on risk management by snowshoe hares.
I analyzed vigilance with a repeated-measures mixed-effects model (dependent variable = square root of (number of alert plus vigilant images + 0.5); repeated measure = day; fixed effects = habitat, distance, moon phase, and treatment nested within habitat; random intercept = camera (to control for the possible effect of differences in cover that might obscure distant hares); covariate = square root of (total images of hares + 0.5); all fixed effects except treatment and the covariate fully crossed; denominator degrees of freedom (df) adjusted with Satterthwaite’s approximation; post hoc least significant difference (LSD) comparisons among fixed effects). I included all two- and three-way interactions (for all but treatment nested within habitat) in an initial model and used Akaike’s Information Criterion for finite sample sizes (AICc) to choose the most parsimonious of alternative models (lowest AICc, if ΔAICc < 2 I chose the model with fewest parameters, (Burnham and Anderson 2002)). I repeated the analysis and model selection using only data from the open-trail habitat so I could unambiguously assess the main effect of treatment and its potential interactions.
I used two similar repeated-measures mixed-effects models and AICc to assess differences in GUDs (dependent variable = mean cut-point diameter; fixed covariate = square root of (number of alert plus vigilant images + 0.5); random covariate = mean basal diameter of the two boughs; random effect = camera). I did not include an intercept for camera because there should not be a consistent difference in the ability of the cameras to record foraging within resource patches. I used the most parsimonious models from the four mixed-effects analyses as inferential tools to evaluate potential relationships between vigilance and GUDs.
I completed my analyses with paired t tests comparing the number of images with feeding hares between full- and new-moon phases and between near and far stations. I repeated the tests with Morris and Vijayan’s (2018) data on the number of hares foraging on pine boughs in alder and open habitats. I evaluated whether these differences corresponded with the trade-offs predicted by eq. (1).
All analyses were conducted with SPSS 25 and Minitab 18 software. I report statistical comparisons as either marginal means or differences in the marginal mean values ± their respective standard errors. I compared relative effect sizes of significant main effects by calculating the ratio of the variance accounted for by the effect to that of the effect plus its error variance (partial eta2, ηp2 ) from the ANOVA tables (using the worksheet provided by Lakens 2013; 90% confidence intervals from Uanhoro 2017). Although useful for comparing main effects within each model, the ηp2 values that I report here are “accurate” only for a fully fixed-effects model. They should not be interpreted as general statements on the proportional variances accounted for by the mixed-effects models or those expected in other studies with different designs.
I illustrate the significant results of the most parsimonious models with boxplots of the models’ predicted values. Presentation of raw scores would misinterpret statistical significance because they do not include the marginal effects of other terms in the models.

Results and discussion

The risk of predation was higher in 2010 than in 2018

Although we did not quantify numerous field signs of predators in 2010 (Morris and Vijayan 2018), predation risk was undoubtedly high. Tracks of mammalian predators were common and our wildlife cameras captured multiple images of lynx as well as a red fox. Additional evidence of high predation risk was revealed at two different foraging stations where hares were killed by avian predators immediately following the experiments (Morris and Vijayan 2018). Comparable signs of predators were virtually nonexistent in 2018. A single set of tracks revealed that a wolf had crossed the open trail while I was placing cameras prior to the experiment. I observed no other predator tracks during or after the experiment ended (zero mammalian predators), and no evidence of hare attacks (blood or talon or feather imprints in snow) from owls or hawks. Predation risk was clearly much lower in 2018 than in 2010.

Vigilance

The cameras recorded 25 692 images of hares in 25 421 photographs during the 8 d of the 2018 experiment. Of these, 15 064 (58.6% of all hares) revealed foraging hares and 1407 (0.055%) revealed alert or vigilant hares.

Vigilance varied with moonlight and distance

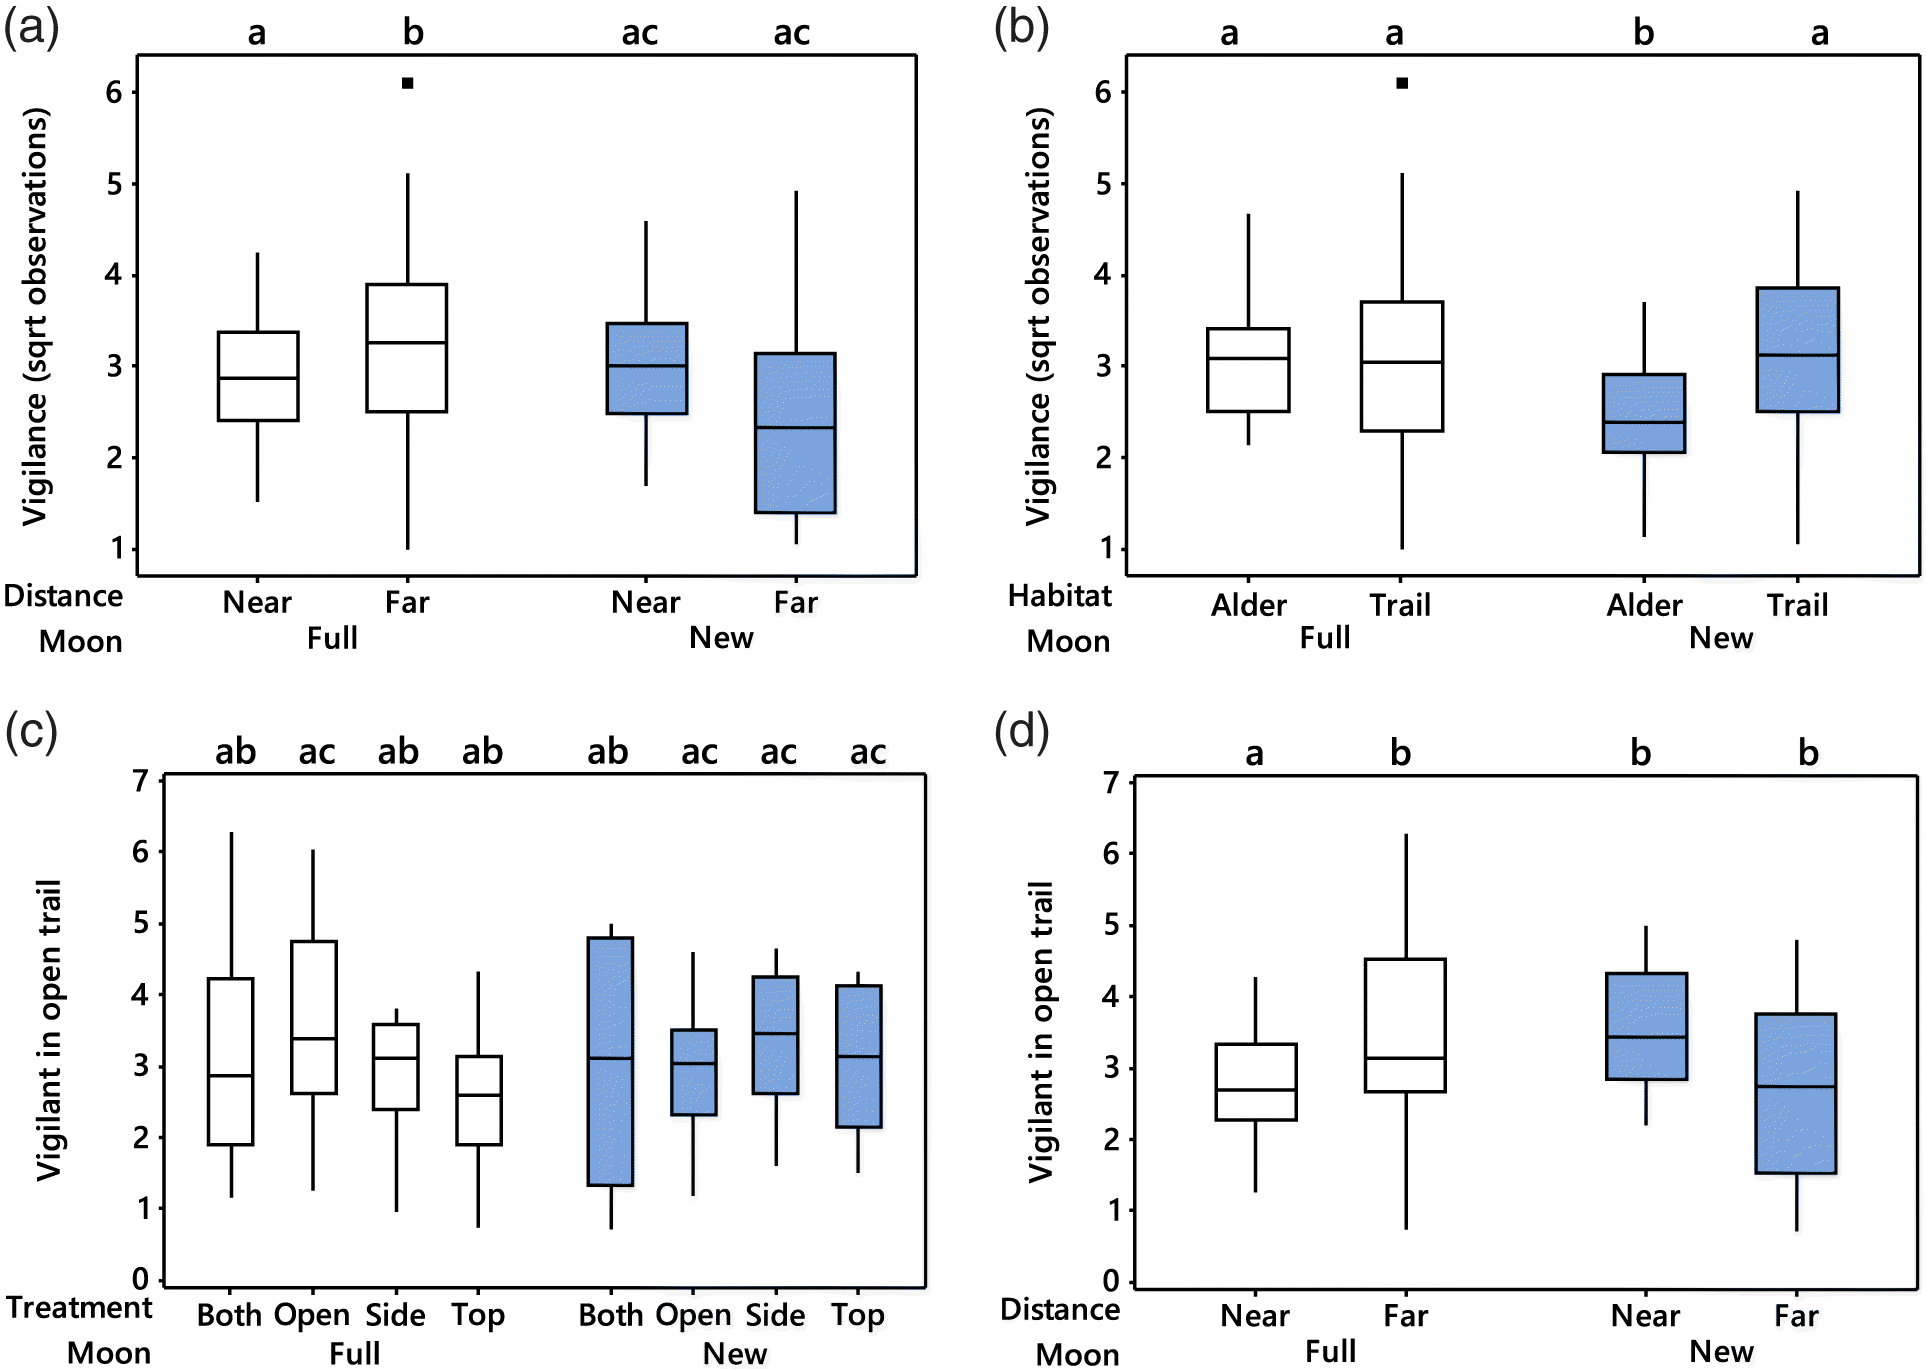
Only three terms in the final two-habitat model for vigilance were statistically significant (Table 1). The number of hare images recording alert or vigilant behaviour increased with the total number of hares observed (F1,68.99 = 172.34, p < 0.001). Hares were more alert or vigilant during the full moon, but only when foraging at far stations (moon × distance interaction; F1,79.97 = 27.33, p < 0.001; Fig. 1a). Hares were least vigilant in the dense alder habitat and especially so during the new moon (habitat × moon interaction; F1,79.71 = 11.05, p = 0.001; Fig. 1b). The effect of distance on vigilance during different moon phases was twice as large as that caused by habitat ( ηp2  = 0.25 vs. 0.12).
Fig. 1.
Fig. 1. Boxplots illustrating significant interactions in model-predicted vigilance (square root of the number of vigilant observations) of snowshoe hares between habitat and moon phase (a), distance and moon phase (b and c), and between four treatments and moon phase (d) in northern Ontario, Canada. Panels (a) and (b) represent analyses including dense escape and open-trail habitats, panels (c) and (d) represent analyses in only open-trail habitat. Letters above boxes represent nonoverlapping 95% confidence intervals. Boxes represent the interquartile ranges (IQR), the medians are located at the vertical lines, whiskers correspond to the lower and upper ranges (1.5 IQR), and filled black squares identify data values beyond (1.5 IQR).
Table 1.
Table 1. Sources and statistical significance of fixed effects retained in repeated-measures mixed-effects models for vigilance and mean cut-point diameters (GUD) of foraging hares in northern Ontario, Canada.
SourceNumerator dfDenominator dfF-ratiop ( ηp2 ; CI: 90)
Vigilance (n = 128)
Intercept151.1027.75<0.001
Habitat112.542.550.135
Moon phase180.631.440.234
Distance113.101.620.226
Habitat × moon phase179.7111.050.001 (0.12; 0.03–0.24)
Moon phase × distance179.9727.32<0.001 (0.25; 0.13–0.37)
Hares168.99172.34<0.001
Mean cut-point diameter (GUD) (n = 126)
Intercept146.58533.98<0.001
Habitat18.8411.460.008 (0.56; 0.12–0.73)
Distance18.8024.860.001 (0.74; 0.34–0.84)
Habitat × distance18.786.270.034 (0.42; 0.02–0.64)
Vigilance157.3754.56<0.001

Note: GUD, giving-up density; df, degrees of freedom; CI, confidence interval.

Addition of cover had a minor impact on vigilance

Treatment effects emerged only in analyses evaluating vigilance in the open-trail habitat and revealed a rather complex dependence on moon phase (treatment × moon interaction; F3,16.27 = 16.27, p = 0.025, Table 2, Fig. 1c). The interaction between treatment and moon phase in the open paled in comparison with the interaction of moon phase with distance ( ηp2  = 0.20 vs. 0.85, Table 2). Hares were least vigilant in the open when near to escape habitat, but again only during the full moon (moon × distance interaction, F1,5.17 = 28.98, p = 0.003, Table 2, Fig. 1d).
Table 2.
Table 2. Sources and statistical significance of fixed effects retained in repeated-measures mixed-effects models for vigilance and mean cut-point diameters (GUD) of hares foraging in open-trail habitat in northern Ontario, Canada.
SourceNumerator dfDenominator dfF-ratiop ( ηp2 ; CI: 90)
Vigilance (n = 64)
Intercept114.4013.800.002
Treatment37.721.080.411
Moon phase14.285.980.067 (0.58; 0–0.76)
Distance15.581.610.255
Treatment × moon phase316.274.070.025 (0.20; 0–0.43)
Treatment × distance36.751.320.343
Moon phase × distance15.1729.000.003 (0.85; 0.38–0.91)
Treatment × moon phase × distance316.441.580.232
Hares129.5983.51<0.001
Mean cut-point diameter (GUD) (n = 62)
Intercept123.81188.88<0.001
Distance15.1110.930.021 (0.68; 0.09–0.81)
Treatment327.412.170.114
Vigilance133.8229.45<0.001

Note: GUD, giving-up density; df, degrees of freedom; CI, confidence interval.

GUDs

I recovered all 320 foraged pine boughs and their accompanying individualized labels. I was thus able to unambiguously assign the cut-point diameter of each bough with its basal diameter.

Hares foraged more intensely when close to escape habitat

All terms retained in the final model were statistically significant (Table 1). Mean cut-point diameters increased with the number of vigilant images (F1,57.37 = 54.56, p < 0.001). Cut-point diameters were larger (GUDs smaller) at stations close to escape habitat than at those farther away, but this difference depended on habitat (habitat × distance interaction; F1,8.8 = 6.27, p = 0.034; Fig. 2a). Even so, the direct effect of distance trumped that of habitat and its interaction ( ηp2  = 0.74 vs. 0.56 and 0.42, respectively, Table 1). Mean cut points were smallest (GUDs largest) in the open-trail habitat at stations far from escape habitat. The predominant effect of distance from safety emerged clearly when examining open-trail habitat alone. Cut points were largest at stations near to escape habitat (F1,5.11 = 10.93, p = 0.021, Table 2, Fig. 2b). Treatments had no significant effect on GUDs.
Fig. 2.
Fig. 2. Boxplots of model-predicted mean cut-point diameters of pine boughs browsed by snowshoe hares illustrating: a significant interaction between habitat and maximum distance to escape habitat (a) and a significant difference between near and far stations (open-trail habitat only) (b) in northern Ontario, Canada. Letters above boxes represent nonoverlapping 95% confidence intervals. Boxes represent the interquartile ranges (IQR), the medians are located at the vertical lines, whiskers correspond to the lower and upper ranges (1.5 IQR), and filled black squares identify data values beyond (1.5 IQR).

Number of feeding hares

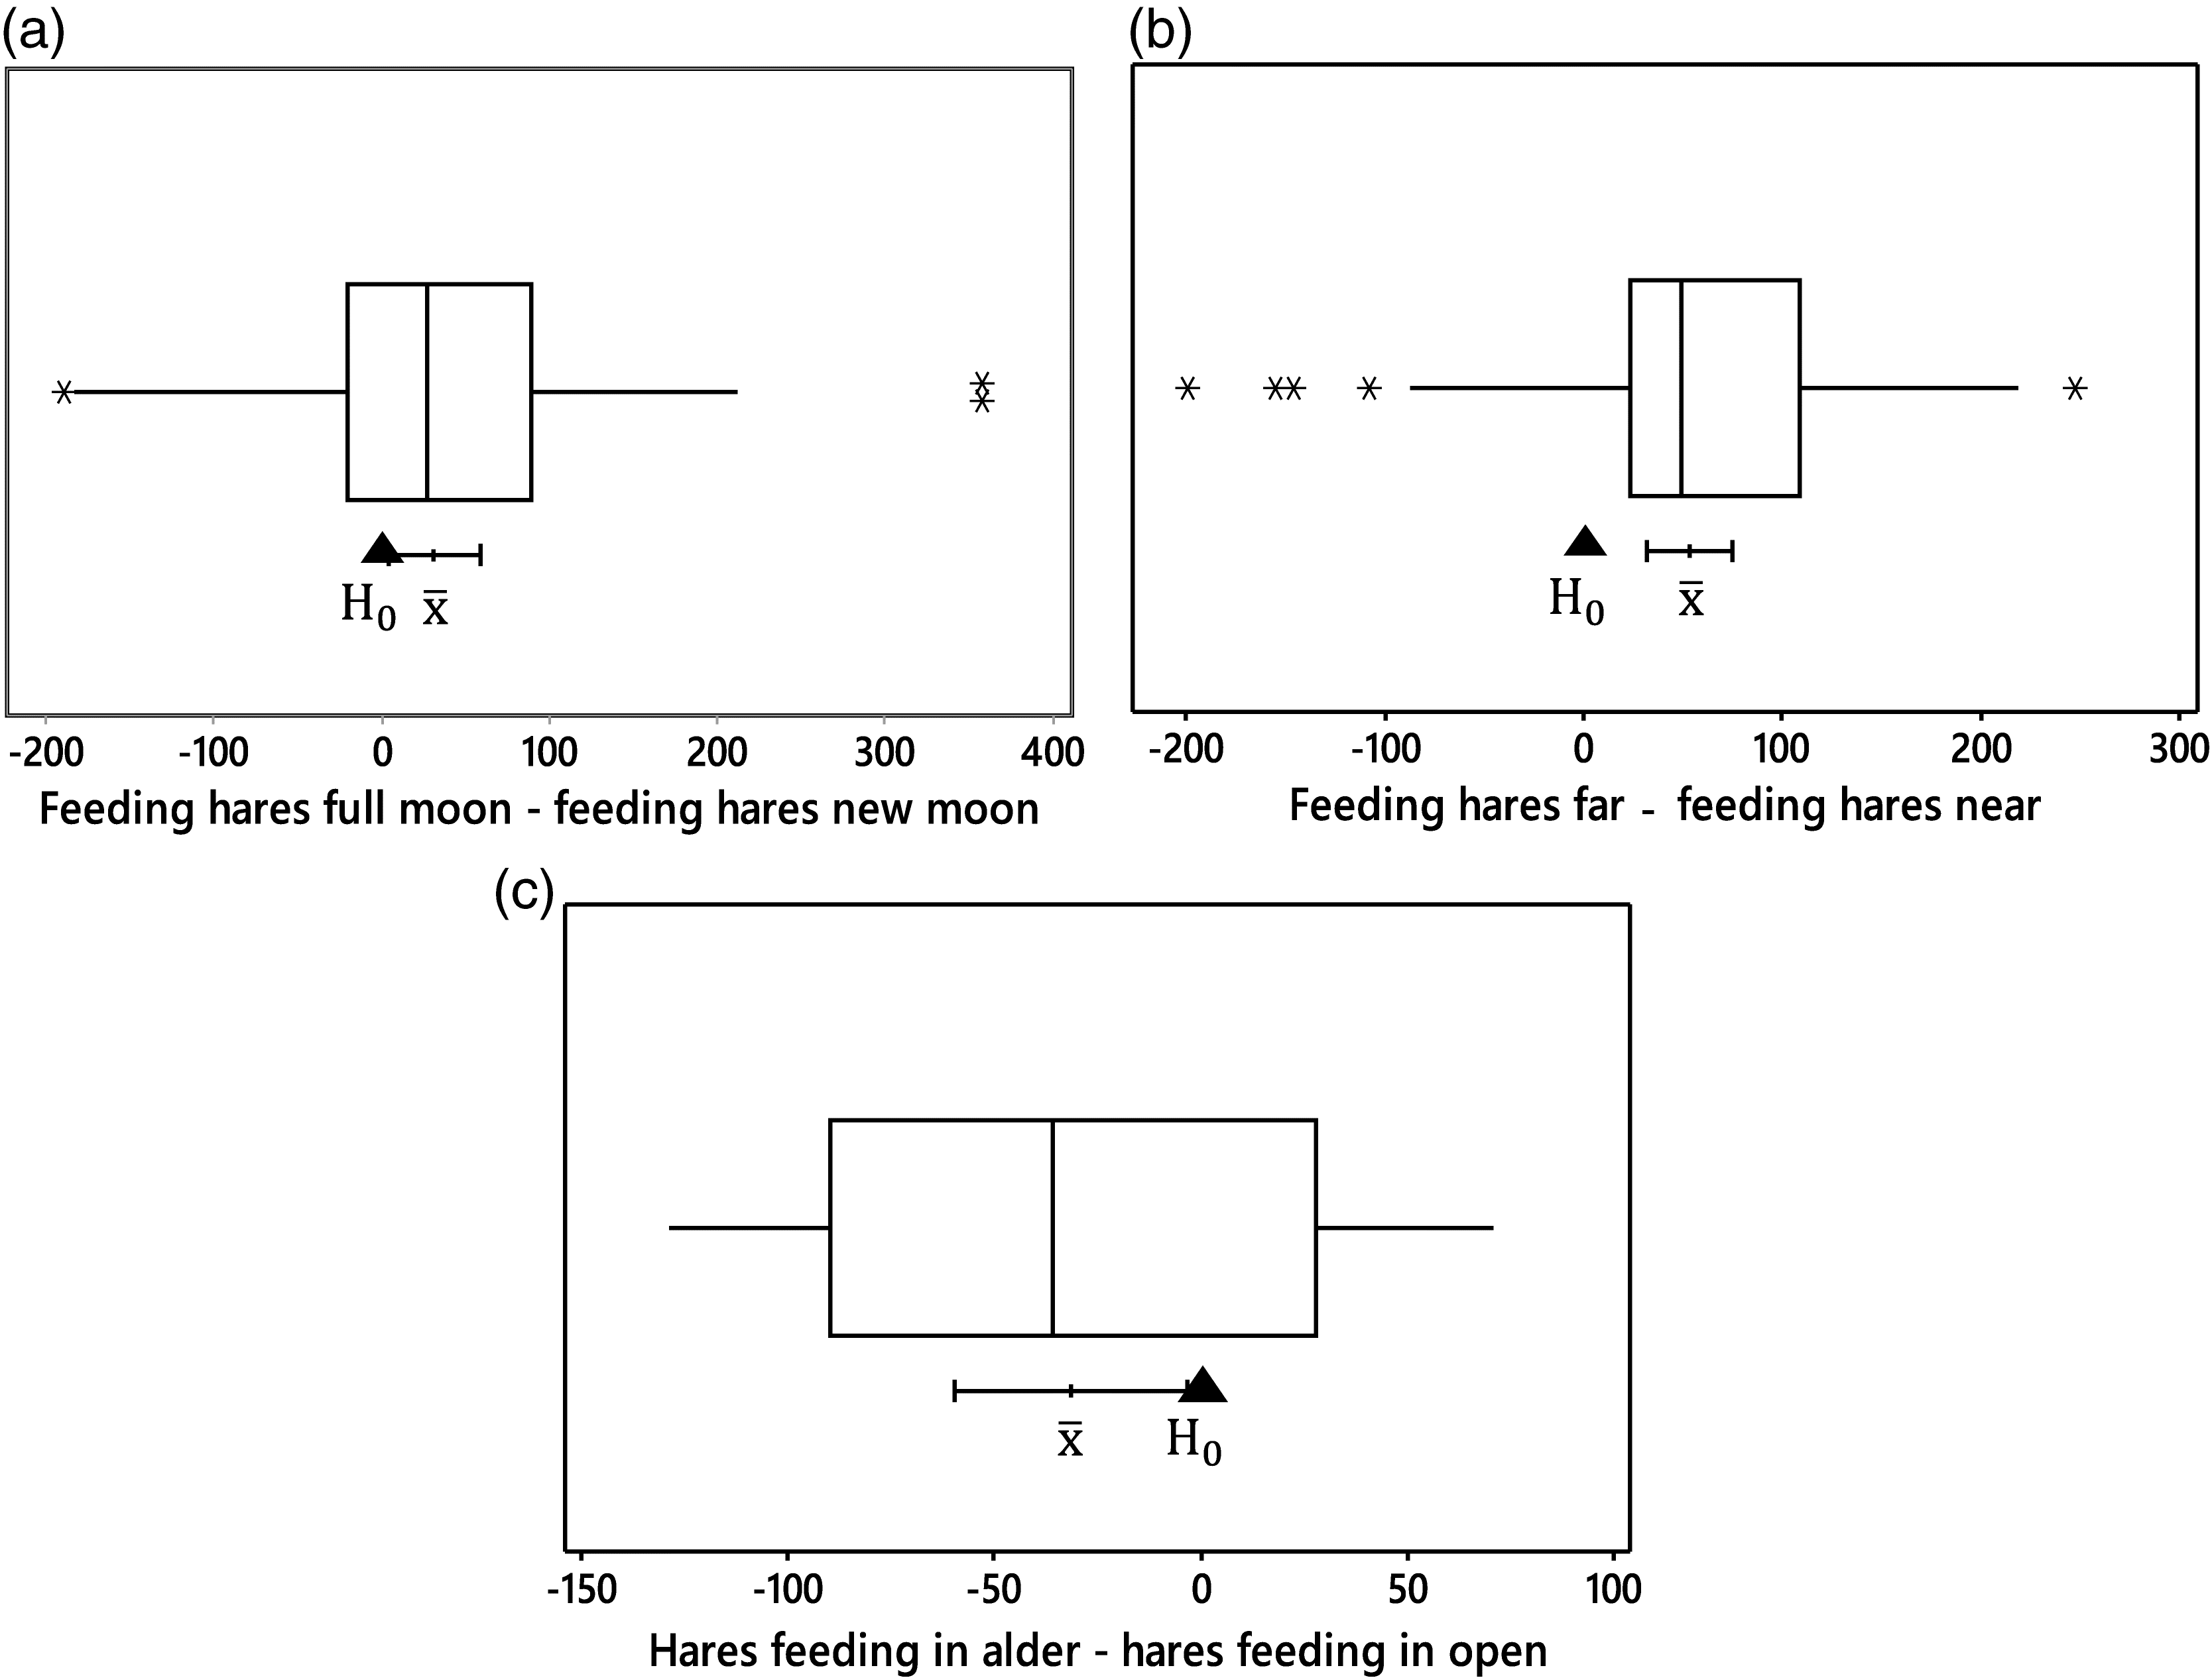
There were more images of hares feeding during the full moon than there were during the new moon (paired-t = 2.28; p = 0.026, N = 64; Fig. 3a). There were also more images of foraging hares at near stations than there were at far stations (paired-t = 4.87; p < 0.001, N = 64; Fig. 3b). More hares foraged in the open than in the alder habitat during Morris and Vijayan’s (2018) 2010 experiment (paired-t = −2.32; p = 0.031, N = 20; Fig. 3c).
Fig. 3.
Fig. 3. Results of paired t tests evaluating differences in the number of hares feeding in artificial resource patches during the full versus new moon in February 2018 (a), at stations near versus far from escape habitat in February 2018 (b), and in dense alder versus adjacent open-trail habitat in late December 2010 (c). Boxes represent the interquartile ranges (IQR), the medians are located at the vertical lines, whiskers correspond to the lower and upper ranges (1.5 IQR), and asterisks identify data values beyond (1.5 IQR).

Risk varied through space and time

Risk management by vigilance and time allocation, as illustrated by snowshoe hares, is not nearly as complex as it could be. The marginal effects of habitat and distance on vigilance were only apparent in the context of the full versus new moon. Meanwhile, moon phase had no overall detectable direct or indirect effect on GUDs and the main effects of habitat and distance depended on their interaction. These results are a rather stark contrast to the significant differences in vigilance between habitats reported in an earlier study of snowshoe hares foraging pine boughs in open versus alder habitats in the same area (Morris and Vijayan 2018). Hares in that study were most vigilant in dense alder habitat, opposite to my results demonstrating least vigilance there, but only during the new moon; strategies of risk management thus change through time.
Morris and Vijayan (2018) attributed high vigilance in dense habitat as a trade-off between the ability to elude or escape from predators through the maze of stems and branches afforded by alder and reduced sight lines in the alder that limited visibility required to detect predators. My treatments were designed to test this hypothesis. I reasoned that hares would be most vigilant in the open when their sight lines were restricted by my palisades of alder branches. I included a control and two additional treatments (top and both) to the side treatment in an attempt to clarify how various types of cover alter vigilance and time allocation. Although treatment was included in the two analyses restricted to tests in the open-trail habitat, its only significant effect was on vigilance through a complex interaction with moon phase. If sight lines modulate vigilance, then why was vigilance “reversed” in 2018 and without clear effects of my treatments?
The explanation appears to rest with differences in risk between 2010 and 2018. The clear reduction in predator activity between years suggests that hares were more vigilant and trepidatious toward predators in 2010 than in 2018. Comparison of camera images between the two study periods confirms the prediction. Fully 20% (1043 of 5344) of the images from 2010 revealed alert or vigilant behaviour compared with only 5% (1407 of 25692) in 2018. The proportion of photographs with two or more hares (3% in 2010 vs. 1% in 2018), as well as that of chases (36 in 2010 vs. 14 in 2018), was also strikingly higher in 2010. It is thus reasonable to attribute the higher vigilance observed in 2010 to a higher risk of predation. That risk was exacerbated by heightened competition that reduced the hares’ foraging efficiency.

Hares adjust their vigilance and foraging to match risk

Relationships between risk and its management through trade-offs between vigilance and time allocation by snowshoe hares in 2010 might appear inconsistent with theory. Hares were significantly more vigilant in the alder than in the open habitat. Increased vigilance should normally reduce the efficiency of resource harvest (increase GUD). Mysteriously, there was no difference in GUDs between habitats. The mystery is resolved when one considers that risk of mortality in a habitat must also include what happens after the prey detects a predator. Alder is escape habitat for hares. They evade predators by zig-zagging through its dense tangle of branches. Improved sight lines in the open allow hares to more easily detect approaching predators. But the net effectiveness of their vigilance is reduced because the probability of capture during flight is higher there than in the alder. Hares should be more prone to fleeing and forage more apprehensively, and thus less efficiently, in the open habitat. My data support the hypothesis. The proportion of images with hares foraging in alder was less than in the open (Fig. 3c).
China et al. (2008) proposed a novel safety in numbers hypothesis (e.g., Treisman 1975, Bednekoff and Lima 1998) for desert gerbils that might also help to explain hare foraging. The gerbils prefer semi-stabilized dunes where winds redistribute food daily (Kotler et al. 1993). As population sizes increase, competition associated with high density in the rich semi-stabilized habitat causes individuals to shift habitat use towards poorer stabilized dunes. The resulting increase in density there dilutes predation risk for each individual. Reduced risk lowers the value of vigilance, yields more opportunity for foraging and other activities, and promotes additional immigration. Simultaneously, this so-called “risk pump” necessarily drains safety from the semi-stabilized dunes, promoting even more immigration. The system finally attains equilibrium at high density when the GUDs converge (but not vigilance).
Might winter-foraging snowshoe hares pump safety from one habitat to another? Perhaps. My observations of similar GUDs, but divergent vigilance between habitats, is consistent with the risk-pump hypothesis. Hares use vigilance to manage risk from both predators and competing hares. So in order for a risk pump to operate, the reduction in predation risk must outweigh all additional density-dependent costs associated with competition for shared resources.
If we truly understand the trade-offs between vigilance and time allocation, then we must be able to explain patterns of vigilance during the different moon phases in 2018. Two hypotheses are consistent with those patterns.
First, bright moonlight should improve the effectiveness of vigilance as prey scan their surroundings for threats. Hares in the open habitat confirmed this expectation during the full moon by reducing the number of vigilant scans, especially so at near stations where they could quickly dart into the safety of alder (Fig. 1d). Even so, net risk typically intensifies for nocturnally foraging prey as the moon waxes towards full (Gilbert and Boutin 1991; Kotler et al. 2010; Gigliotti and Diefenbach 2018), so hares were more vigilant at stations where traversing the open habitat took them far from safety (Fig. 1a) and made them more visible to predators. Second, the hares’ energetic state was almost certainly lower during the cold nights of the full moon relative to those during the new moon. If hares require more energy during cold temperatures, then both vigilance and QHRs should be reduced (eq. (1)). Neither hypothesis is exclusive of the other, both are likely, and both predict my observation that there were more images of hares foraging during the full than during the new moon (Fig. 3a).
My data allow one final test. There was no simple difference in vigilance between near and far stations, but GUDs were lower at near stations than at far ones. Hares at near stations should have a lower QHR revealed by fewer images of foraging hares. Once again, data agree with the prediction. There were fewer images of foraging hares at near than at far stations (Fig. 3b).
Critics might wonder whether patterns of vigilance and foraging were related to concomitant changes in predator and hare density. The experimental design and field observations suggest otherwise. Significant population changes were unlikely given the short 18 d duration of the study, and the number of mammalian predators was effectively zero during the entire experiment.
It thus appears that hares tune their foraging to match the effectiveness of vigilance at reducing risk in different contexts and conditions. Gigliotti and Diefenbach (2018) reached a similar conclusion: flexible behaviour allows hares to match risk avoidance with local conditions. Vigilance alone cannot ameliorate risk that effects changes in apprehension revealed by GUDs (Dall et al. 2001; Kotler et al. 2010). Interactions of foraging and vigilance with habitat, moon phase, and distance from escape habitat highlight a sophisticated risk-management strategy contingent on changes in risk and opportunity. That strategy is nevertheless completely consistent with Brown’s (1999) theory of optimal trade-offs between vigilance and time allocation.
The agreement between theory and observation in snowshoe hares highlights the importance of adaptive risk management in natural populations. Hares merge their demand for energy with patterns of vigilance and time allocation in a way that maximizes overwinter survival. Their foraging strategy must necessarily impinge on subsequent population dynamics (Hik 1995) and their numerical interactions with other species. Hare foraging behavior thus adds to a growing body of knowledge gained from clever experiments that documents risk management as a major structuring force in the spatial dynamics and coexistence of species (e.g., Kotler et al. 2010; Camp et al. 2017). Any study of prey foraging that fails to include an assessment of the trade-offs is likely to misrepresent risk management and its important role in the dynamics of populations and communities.

Acknowledgements

I thank Canada’s Natural Sciences and Engineering Research Council for its ongoing support of my research program in evolutionary ecology. Candid comments and suggestions from B. Kotler and anonymous reviewers helped me improve this contribution. This project was conducted under an Ontario Ministry of Natural Resources Wildlife Scientific Collector’s Authorization.

References

Altendorf KB, Laundré JW, López González CA, and Brown JS. 2001. Assessing effects of predation risk on foraging behavior of mule deer. Journal of Mammalogy, 82: 430–1439.
Bannister AE, and Morris DW. 2016. Habitat selection reveals state-dependent foraging trade-offs in a temporally autocorrelated environment. Israel Journal of Ecology and Evolution, 62: 162–170.
Bednekoff PA, and Lima SL. 1998. Re-examining safety in numbers: interactions between risk dilution and collective detection depend upon predator targeting behaviour. Proceedings of the Royal Society B: Biological Sciences, 265: 2021–2026.
Bergeron J-M, and Tardif J. 1988. Winter browsing preferences of snowshoe hares for coniferous seedlings and its implication in large-scale reforestation programs. Canadian Journal of Forestry Research, 18: 280–282.
Boonstra R, Hik D, Singleton GR, and Tinnikov A. 1998. The impact of predator-induced stress on the snowshoe hare cycle. Ecological Monographs, 68: 371–394.
Brown JS. 1988. Patch use as an indicator of habitat preference, predation risk, and competition. Behavioral Ecology and Sociobiology, 22: 37–47.
Brown JS. 1999. Vigilance, patch use and habitat selection: foraging under predation risk. Evolutionary Ecology Research, 1: 49–71.
Brown JS, and Kotler BP. 2004. Hazardous duty pay and the foraging cost of predation. Ecology Letters, 7: 999–1014.
Brown JS, Kotler BP, and Mitchell WA. 1997. Competition between birds and mammals: a comparison of giving-up densities between crested larks and gerbils. Evolutionary Ecology, 11: 757–771.
Burnham KP, and Anderson DR. 2002. Model selection and multimodel inference: a practical information-theoretical approach. Springer, New York, New York.
Camp MJ, Shipley LA, Johnson TR, Olsoy PJ, Forbey JS, Rachlow JL, and Thornton DH. 2017. The balancing act of foraging: mammalian herbivores trade-off multiple risks when selecting food patches. Oecologia, 185: 537–549.
Charnov E. 1976. Optimal foraging, the marginal value theorem. Theoretical Population Biology, 9: 129–136.
China V, Kotler BP, Shefer N, Brown JS, and Abramsky Z. 2008. Density-dependent habitat and patch use in gerbils: consequences of safety in numbers. Israel Journal of Ecology and Evolution, 54: 373–388.
Dall SRX, Kotler BP, and Bouskila A. 2001. Attention, ‘apprehension’ and gerbils searching in patches. Annales Zoologici Fennici, 38: 15–23.
Dupuch A, Morris DW, and Halliday WD. 2014. Patch use and vigilance by sympatric lemmings in predator and competitor-driven landscapes of fear. Behavioral Ecology and Sociobiology, 68: 299–308.
Fraser DF, and Gilliam JF. 1987. Feeding under predation hazard: response of the guppy and Hart’s rivulus from sites with contrasting predation hazard. Behavioral Ecology and Sociobiology, 21: 203–209.
Gigliotti LC, and Diefenbach DR. 2018. Risky behavior and its effect on survival: snowshoe hare behavior under varying moonlight conditions. Journal of Zoology, 305: 27–34.
Gilbert BS, and Boutin S. 1991. Effect of moonlight on winter activity of snowshoe hares. Arctic and Alpine Research, 23: 61–65.
Griffin PC, Griffin SC, Waroquiers C, and Mills LS. 2005. Mortality by moonlight: predation risk and the snowshoe hare. Behavioral Ecology, 16: 938–944.
Halliday WD, and Morris DW. 2013. Safety from predators or competitors? Interference competition leads to apparent predation risk. Journal of Mammalogy, 94: 1380–1392.
Higginson AD, Fawcett TW, Trimmer PC, McNamara JM, and Houston AI. 2012. Generalized optimal risk allocation: foraging and antipredator behavior in a fluctuating environment. American Naturalist, 180: 589–603.
Hik DS. 1995. Does risk of predation influence population dynamics? Evidence from cyclic decline of snowshoe hares. Wildlife Research, 22: 115–129.
Hodson J, Fortin D, and Bélanger L. 2010. Fine-scale disturbances shape space-use patterns of a boreal forest herbivore. Journal of Mammalogy, 91: 607–619.
Holling CS. 1965. The functional response of predators to prey density and its role in mimicry and population regulation. Memoirs of the Entomological Society of Canada, 97: 5–60.
Houston AI, McNamara JM, and Hutchinson JMC. 1993. General results concerning the trade-off between gaining energy and avoiding predation. Philosophical Transactions of the Royal Society B: Biological Sciences, 341: 375–397.
Kotler BP, and Brown JS. 1990. Mechanisms of coexistence of optimal foragers as determinants of local abundances and distributions of desert granivores. Journal of Mammalogy, 80: 361–374.
Kotler BP, and Brown JS. 2017. Fear and loathing on the landscape: what can foraging theory tell us about vigilance and fear? Animal Sentience, 15(5): 2017.083.
Kotler BP, Brown JS, and Subach A. 1993. Mechanisms of species coexistence of optimal foragers: temporal partitioning by two species of sand dune gerbils. Oikos, 67: 548–556.
Kotler BP, Brown JS, Mukherjee S, Berger-Tal O, and Bouskila A. 2010. Moonlight avoidance in gerbils reveals a sophisticated interplay among time allocation, vigilance and state-dependent foraging. Proceedings of the Royal Society B: Biological Sciences, 277: 1469–1474.
Kotler BP, Morris DW, and Brown JS. 2016. Direct behavioral indicators as a conservation and management tool. In Conservation behavior. Edited by O Berger-Tal and D Saltz. Cambridge University Press, Cambridge, UK. pp. 307–351.
Krebs CJ, Boonstra R, Boutin S, Sinclair ARE, Smith JNM, Gilbert BS, and Martin K, et al. 2014. Trophic dynamics of the boreal forests of the Kluane Region. Arctic, 67: 71–81.
Lakens D. 2013. Calculating and reporting effect sizes to facilitate cumulative science: a practical primer for t-tests and ANOVAS. Frontiers in Psychology.
Lima SL, and Bednekoff PA. 1999. Temporal variation in danger drives antipredator behavior: the predation risk allocation hypothesis. American Naturalist, 153: 649–659.
Lima SL, and Dill LM. 1990. Behavioral decisions made under the risk of predation: a review and prospectus. Canadian Journal of Zoology, 68: 619–640.
McArthur C, Banks PB, Boonstra R, and Forbey JS. 2014. The dilemma of foraging herbivores: dealing with food and fear. Oecologia, 176: 677–689.
Monclús R, Anderson AM, and Blumstein DT. 2015. Do yellow-bellied marmots perceive enhanced predation risk when they are farther from safety? An experimental study. Ethology, 121: 831–839.
Morris DW. 2005. Habitat-dependent foraging in a classic predator-prey system: a fable from snowshoe hares. Oikos, 109: 239–254.
Morris DW. 2009. Apparent predation risk: tests of habitat selection theory reveal unexpected effects of competition. Evolutionary Ecology Research, 11: 209–225.
Morris DW. 2014. Can foraging behavior reveal the eco-evolutionary dynamics of habitat selection?. Evolutionary Ecology Research, 16: 1–18.
Morris DW, and Vijayan S. 2018. Trade-offs between sight lines and escape habitat determine spatial strategies of risk management by a keystone herbivore. FACETS, 3: 338–357.
Morris DW, Holt RD, and Kotler BP. 2017. Apparent competition. Reference Modules in Life Sciences. Elsevier, Oxford, UK.
Palo T, Bergström R, and Danell K. 1992. Digestibility, distribution of phenols, and fiber at different twig diameters of birch in winter. Implication for browsers. Oikos, 65: 450–454.
Sheriff MJ, Krebs CJ, and Boonstra R. 2009. The sensitive hare: sublethal effects of predator stress on reproduction in snowshoe hares. Journal of Animal Ecology, 78: 1249–1258.
Treisman M. 1975. Predation and the evolution of gregariousness. I. Models for concealment and evasion. Animal Behaviour, 23: 779–800.
Uanhoro JO. 2017. Effect size calculations [online]: Available from effect-size-calculator.herokuapp.com/.

Supplementary materials

Supplementary Material 1 (PDF / 1213 KB)

Information & Authors

Information

Published In

cover image FACETS
FACETS
Volume 4Number 1June 2019
Pages: 407 - 422
Editor: Brock Fenton

History

Received: 5 December 2018
Accepted: 8 May 2019
Version of record online: 19 August 2019

Data Availability Statement

The datasets generated during and (or) analysed during the current study are available from the Dryad Digital Repository: https://doi.org/10.5061/dryad.6569787.

Key Words

  1. foraging
  2. giving-up density
  3. predation
  4. risk management
  5. snowshoe hare
  6. vigilance

Sections

Subjects

Plain Language Summary

How do snowshoe hares manage the risk of being eaten?

Authors

Affiliations

Douglas W. Morris [email protected]
Department of Biology, Lakehead University, Thunder Bay, ON P7B 5E1, Canada

Author Contributions

All conceived and designed the study.
All performed the experiments/collected the data.
All analyzed and interpreted the data.
All contributed resources.
All drafted or revised the manuscript.

Competing Interests

The author has declared that no competing interests exist.

Metrics & Citations

Metrics

Other Metrics

Citations

Cite As

Export Citations

If you have the appropriate software installed, you can download article citation data to the citation manager of your choice. Simply select your manager software from the list below and click Download.

Cited by

1. Sex‐dependent habitat selection modulates risk management by meadow voles
2. Individual snowshoe hares manage risk differently: integrating stoichiometric distribution models and foraging ecology

View Options

View options

PDF

View PDF

Get Access

Media

Media

Other

Tables

Share Options

Share

Share the article link

Share on social media