Development of an age-adjusted, activity-based contact probability model for infectious diseases
Abstract
The COVID-19 pandemic highlighted the importance of gathering restrictions in slowing the spread of communicable disease. Many restrictions on activities were applied without identifying how effective the restrictions might be in curtailing disease spread. We present a model that estimates the probability of contacting an infected individual as a function of prevalence and self-reported or hypothesized activities. The model incorporates an age adjustment factor to account for differences between the age demographics of infected versus activity participants. The age adjustment factor was important to include when the difference in prevalence between age groups was sufficiently large, and prevalence and activity group sizes were moderate. We applied our contact probability model to two scenarios to demonstrate how the model may inform the development of public health measures. Our model presents a method for estimating contact probability that could be adopted by jurisdictions considering facility closures or group size limits, or for individuals evaluating their own behaviours in future outbreaks or pandemics.
Graphical Abstract
1. Introduction
The Coronavirus of 2019 (COVID-19) pandemic—which exceeded 6.96 million deaths globally as of October 2023 (World Health Organization 2023)—highlighted the importance of social behaviour and compliance with public health restrictions in determining an individual’s probability of contracting a communicable disease. Reducing contacts with others through physical distancing and refraining from attending large gatherings were shown to dramatically reduce the transmission of the Severe Acute Respiratory Syndrome Coronavirus 2 (SARS-CoV-2), the virus that causes COVID-19 (Lewnard and Lo 2020; Quilty et al. 2020; Champredon et al. 2021). Raising public awareness of factors that contribute to disease spread and quantifying the personal risk of being exposed to diseases could encourage compliance with government policies aimed at mitigating transmission. Suitable risk assessment and communication tools could facilitate knowledge translation and inform policy decisions with respect to managing communicable disease transmission (Chatterjee et al. 2020).
In the early phases of the pandemic, jurisdictions introduced behavioural restrictions designed to limit contact with infected individuals, such as closing bars, reducing seating capacity at restaurants and entertainment venues, and limiting visitors at long-term care facilities. Activity restrictions were modified later in the pandemic to account for participant vaccination status, via the so-called vaccine passport (McPhee-Knowles et al. 2022). In addition to policies, risk assessment applications were developed throughout the pandemic to explore the outcomes of SARS-CoV-2 infections on a patient or a population (Brown University—Alpert Medical School 2020; Johns Hopkins Bloomberg School of Public Health 2020; Parajuli et al. 2020; Chen et al. 2021; O'Keefe et al. 2021), the likelihood of contracting SARS-CoV-2 associated with a single activity (National Institute on Ageing 2021), or strategies to mitigate SARS-CoV-2 transmission (Miller et al. 2022).
We designed a model to provide decision makers with information on the potential effectiveness of targeted behavioural restrictions. Our model estimates an individual’s probability of physically contacting an infected person as a function of the prevalence in their location and of the (likely multiple) activities in which they engaged in the 14 days prior to the date of assessment. Age of activity participants plays a crucial role in determining contact patterns, and accounting for age-dependent contact patterns is essential when considering the spread of COVID-19 in non-household settings (Davies et al. 2020). However, the context of the contacts is also important. Consider the probability of contact within a bar: in some jurisdictions, children are not allowed, so this not only means contact with an infected child should not be possible, but the general behavioural correlations between children and adults (i.e., children and their caretakers) would not apply to this activity.
A comparable model is the COVID-19 Missed Infection Calculator developed by Defence Research and Development Canada (DRDC) for the Canadian Armed Forces (Guillouzic et al. 2022), which estimates the probability of one or more individuals with undetected infections being in a group. The calculator has the added complexity of accounting for quarantining and testing practices, though it treats each member of the group as coming from a homogeneous population. In contrast, our contact probability model predicts the probability of contact (rather than infection) over multiple activities, and accounts for demographic differences among group members and the population.
The Public Health Agency of Canada (PHAC) Gathering Risks Model: On-line calculator (Champredon et al. 2021) uses a mathematically similar approach to the contact model to quantify the likelihood that an infectious individual is present at a gathering. The PHAC model recommends using the relative risk of infection for participants compared to the population to account for population heterogeneity. Our contact probability model includes a similar modification through the inclusion of an age adjustment factor (described below) but predicts the probability of contact with an infected person, and accounts for prior behaviours leading up to the grouping event.
2. Methods
2.1. Model overview
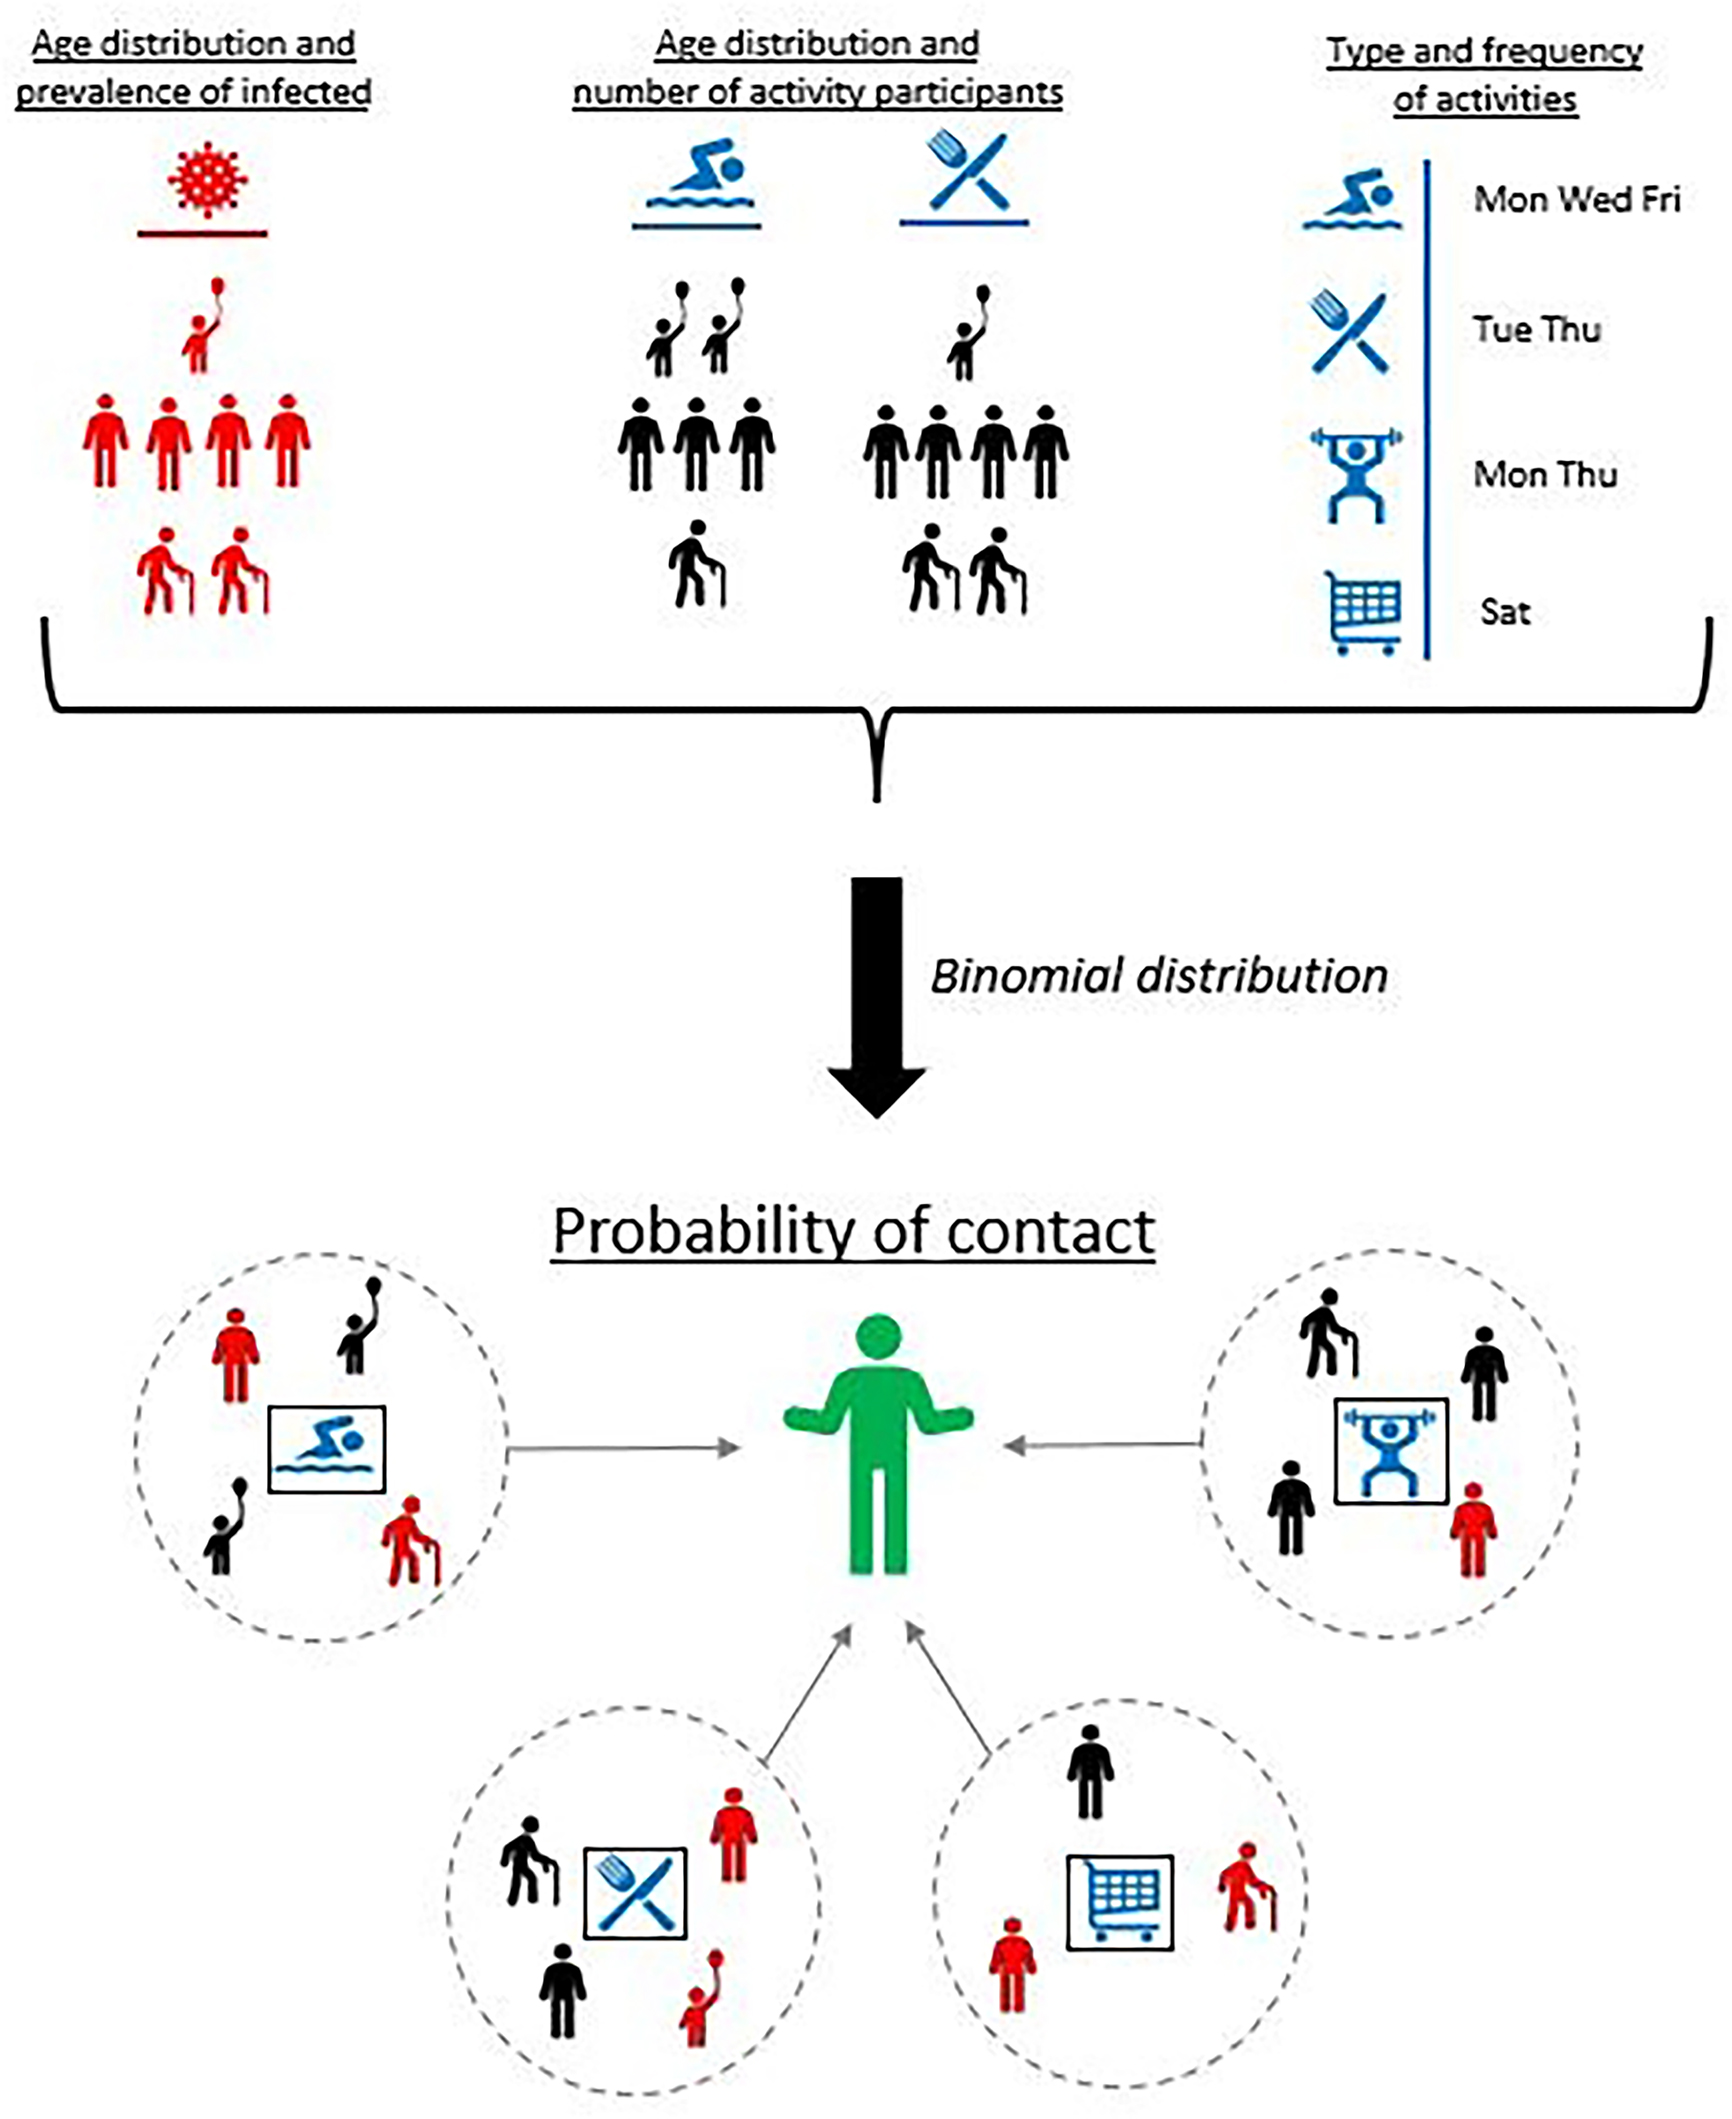
Our model answers the question “what is the probability an individual has contacted at least one infected person in the previous 14 days?” We assumed the individual participated in a series of activities prior to evaluation, and each activity provided an independent opportunity to contact an infected person from the population. Importantly, our model did not address the probability of a person becoming infected, as it did not consider disease transmission. We defined “contact” as a situation where viral transmission was equivalent to the definition of a “close contact” used by public health officials in the Yukon Territory, Canada (Government of Yukon 2022a), which incorporated a time and distance measure (e.g., 15 min or more spent within 2 m of an infectious individual). We chose 14 days because the COVID-19 incubation period ranged from 1 to 14 days (Public Health Agency of Canada 2021), though any length of time could be used.
The contact model estimated probabilities of contact for each activity in which the individual participated. The number and nature of encounters with other people could vary between activities. For each person encountered during a given activity, there was a constant, activity-specific probability that the encountered person was infected. In the model, the total probability of contact with an infected person across all locations and activities was a function of the
•
number of people encountered in at activity;
•
number of activities;
•
age demographic of people participating in the activities;
•
age demographic of infected people in the population; and
•
prevalence of disease in the regions visited by the individual prior to the assessment.
We assumed encounters with infected people participating in the same activity could be treated as a series of Bernoulli events. This simplifying assumption ignored correlations between the infection status of cohorting individuals (Mossong et al. 2008; Prem et al. 2017; Davies et al. 2020). The contact model used activity-specific age distributions and infection age distributions to incorporate the effect of heterogeneous participation (See Section 2.3).
2.2. Prevalence estimate
The contact model required accurate estimates of point prevalence, which is the fraction of the population infected at a given time. We used a separate, publicly available model developed by DRDC to estimate the point prevalence of individuals infected with SARS-CoV-2 (Horn et al. 2022). The model provided prevalence estimates for provinces and territories in Canada, and accounted for asymptomatic cases and unreported infections.
Our contact model uses a single value for prevalence. One could use the prevalence estimate on the day of assessment or a weighted average over the previous 14 days if prevalence varied widely in the 14 days prior to assessment, or if multiple jurisdictions were visited (as may occur if the individual was travelling).
2.3. Age profile of activities
Activities in the model were based on those affected by Yukon public health orders during the COVID-19 pandemic: post-secondary schooling, visiting bars, personal care (e.g., hair salons), shopping, fitness centres, religious ceremonies, seated dining, attending small indoor gatherings, attending large indoor gatherings, healthcare visits, visiting long-term care facilities, childcare (daycares), and primary and secondary schooling (Table 1).
Table 1.
| Activity | Number of encounters | Participant proportions (age groups) | Age adjustment factor |
|---|---|---|---|
| Primary/secondary schooling (Statistics Canada 2013, 2021a) | 20 | 93/7/0/0/0 | 0.75 |
| Childcare (daycare) (Government of Ontario 2022) | 20 | 86/11/3/0/0 | 0.77 |
| Long-term care facility (Ontario Centre for Learning, Research and Innovation in Long-Term Care 2018; Statistics Canada 2018; Canadian Institute for Health Information 2019) | 5 | 0/34/8/12/46 | 0.79 |
| Healthcare (Statistics Canada 2017a; Canadian Institute for Health Information 2019, 2020, 2022) | 5 | 3/40/13/23/21 | 0.84 |
| Seated dining | 4 | 21/54/13/8/4 | 1.00 |
| Small indoor gathering | 5 | 21/54/13/8/4 | 1.00 |
| Large indoor gathering | 10 | 21/54/13/8/4 | 1.00 |
| Religious occasion/ceremony (Statistics Canada 2017b; Pew Research Center 2022) | 10 | 8/60/15/11/6 | 1.03 |
| Gym/fitness (Rizzo 2021) | 10 | 16/67/10/5/2 | 1.10 |
| Shopping (Global Travel Retail Magazine 2022) | 3 | 8/75/9/5/3 | 1.12 |
| Personal care (SEO Design Chicago 2021; Statistics Canada 2021b; Innovation, Science and Economic Development Canada 2022) | 2 | 8/71/18/3/0 | 1.13 |
| Bar (Statista 2020) | 10 | 0/78/12/7/3 | 1.16 |
| Post-secondary schooling (National Center for Education Statistics 2019, 2020; McChesney and Bichsel 2020; Statistics Canada 2021c) | 20 | 22/76/2/0/0 | 1.19 |
Note: Proportions for different ages are divided by slashes: ages 0–19/20–59/60–69/70–79/80+. Age distribution for SARS-CoV-2 prevalence used to calculate age adjustment factors was from BC Centre for Disease Control (2020) for the week of 25–31 October 2020.
One key feature of our contact model was adjusting the probability of contacting an infectious person based on the ages of activity participants. We defined the age profile using five age categories: 0–19, 20–59, 60–69, 70–79, and 80+. For each age group, the point prevalence pj was calculated aswhere is an index over the age categories, p is the population point prevalence, cj is the fraction of reported cases in the population occurring in age group j, and nj is the fraction of the total population in age group j. Implicit in eq. 1 is the assumption that the age distribution of total infected people—detected or not—is the same as the distribution of reported cases.
(1)
The point prevalence pa for a given activity was then obtained by doing a weighted average over the five age categories:where aj is the typical fraction of participants at that activity within age group j andCombining eqs. 1 and 2 yieldedwhere fa is called the age adjustment factor for the activity and was defined as
(2)
(3)
(4)
(5)
This factor helped account for age groups—and their associated prevalence—being over- or under-represented in any given activity compared to the general population. Age adjustment factors less than 1 result in a point prevalence estimate pa that is less than the population prevalence, making it less likely to contact an infected individual in the corresponding activity setting compared to the whole population. Conversely, age adjustment factors larger than 1 lead to an increased probability of contact.
We calculated and report in Table 1 an age adjustment factor for SARS-CoV-2 using eq. 5 for each type of activity mentioned at the beginning of this section. The age distribution of infections (cj) was derived from the BC Centre for Disease Control (2020) for 25–31 October 2020 (when the contact model was first implemented), and the Yukon population distribution from Statistics Canada (2021b) was used for nj. Pre-pandemic behaviour data (i.e., group sizes and age distributions) for activities considered in the model were based on limited literature values, and some of the values were based on reasonable guesses. For instance, in a daycare setting, 86% of attendees were assumed to be children (age group 0–19), 11% were assumed to be working adults (age group 20–59), and 3% were assumed to be of retirement age (age group 60–69)—corresponding to a1 = 0.86, a2 = 0.11, a3 = 0.03, and a4 = a5 = 0 (Government of Ontario 2022). These or other literature values should be used with care, as pre-pandemic values may not have been applicable even when available (Davies et al. 2020) because of changes in behaviours in the first year of the pandemic (2020).
Age adjustment factors in Table 1 ranged from a minimum of 0.75 (primary schooling) to 1.19 (post-secondary schooling). Activities with higher proportions of adult participants (age 20–59) had higher age adjustment factors, reflecting the higher SARS-CoV-2 prevalence in adults at the stage of the pandemic during which this model was developed. Only activities based on the Canadian population age distribution (Statistics Canada 2021b)—seated dining and small or large indoor gatherings—resulted in age adjustment factors of 1.0. The lowest adjustment factors—those less than 0.8—were obtained by either concentrating people in the 0–19-year-old category (childcare facilities; primary/secondary schooling) or those aged 80+ (long-term care facilities).
2.4. Probability of contact
Since contacts at an activity were modelled as a series of Bernoulli events, the probability of having k contacts with infected individuals when participating in activity a with n other people was calculated using the binomial mass function:
(6)
In practice, we were only interested in the probability of having one or more contacts, which was equal towhere na is the number of people typically encountered at an activity (one less than the group size).
(7)
For each assessed individual, the overall probability of contact Pi was calculated assuming the activities in which they participated were independent. Consequently, the probability of not having any contact with an infected individual over all activities waswhere the product is over all applicable activities (represented by the set A), and where each activity may appear more than once if the individual participated in it multiple times.
(8)
To assess the importance of the age adjustment factor fa, it was helpful to consider the special case where it had the same value for all activities, in which case eq. 8 simplifies towhere ne is the total number of people encountered at activities summed over all activities, in other wordsand where the dependence of Pi on the three remaining variables is written explicitly. (With fa = 1, eq. 9 further simplifies to the expression that Champredon et al. (2021) provide for the risk of introduction in the context of recurrent gatherings.) In this case, the relative difference in the estimate of probability of contact with and without the age adjustment factor is given by
(9)
(10)
(11)
Decision makers are likely to consider the age adjustment factor to be significant if neither nor is too small.
3. Example scenarios
Policymakers, as part of their decision-making process, may be interested in understanding the impact of different activities when deciding whether restrictions should be applied with the overall goal of controlling a communicable disease. This information would be considered alongside other effects, such as the impact on citizens’ personal freedoms and the need to prevent healthcare systems from collapsing, as was seen in the early days of the COVID-19 pandemic. Section 4 presents two scenarios related to this. The first one, in Section 4.2, relates to capacity restrictions on restaurants. The second one, in Section 4.3, demonstrates how the contact model could inform a decision maker on the impact that restricting a range of various activities could have on the total probability of contact. The scenarios utilize and compare three different age distributions: "Population" refers to the age distribution of the 2020 Yukon population, "Low %adult" assigns 25% of activity participants to adults with the remainder distributed to other age categories proportional to the Yukon population, and "High %adult" assigns 80% of activity participants to adults with the remainder distributed to other age categories proportional to the Yukon population. Variations in the activity age distribution were focused on the adult age category because it had the highest proportion of known infections, and hence would have the largest impact on the results.
For the second scenario, we used a pre-pandemic transportation survey done in Kingston, Ontario (R.A. Malatest and Associates Ltd. 2019) that provided a count of activity participants, a list of activities performed, the relative likelihood of performing those activities, and the mean number of activities performed per day. We subsetted the list of potential activities provided in the Kingston report to include shopping, personal, dining, recreation, and work. We used the sample values in Table 1 for shopping and dining, and equated “healthcare” and “gym” in Table 1 to the “personal” and “recreation” activities in the Kingston report.
We used eqs. 1–7 to create an age adjustment factor and probability of contact for the “work” activity that did not appear in Table 1. The 2021 census (Statistics Canada 2022) was used to create the age distribution for the Kingston population. People aged 20–59 years were assumed to make up 90% of activity participants, with 5% in each of the 0–20 and 60–69-year-old age categories. The age distribution of infections was assumed to be the same as in Section 2.3, which led to an age adjustment factor of 1.29. Assuming a prevalence of 1% and a small office setting of approximately five encounters during the day, the daily contact probability was 6.3% for the new “work” activity.
A simulation was used to examine the impact of reducing each of the five activities in turn. Each of the Kingston residents was assumed to do a number of activities drawn from a Poisson distribution with a mean of 2.98 (the mean number of activities stated in the Kingston report). Individuals assigned more than five activities from the random draw were treated as if they participated in five activities. The specific activities performed by an individual were then selected randomly from the list of activities considered, based on the relative frequency provided in the Kingston survey. People were not allowed to perform the same activity twice in the simulation since it covered a single day. The probability of contact for each individual’s set of activities was calculated using eq. 8, and the mean probability of contact across the whole population was recorded.
Afterwards, the probability of contact for a given activity was set to zero to mimic the effect of restricting that activity, and the simulation rerun. (We did not want to increase the probability of doing other activities due to an activity restriction, so the probability of contact was manually set to zero instead of the probability of performing the activity.) The mean probability of contact across the whole population excluding the restricted activity was calculated and repeated for each restricted activity.
4. Results
4.1. Impact of age
Figure 1 shows combinations of prevalence, number of encounters, and age adjustment factors for which the age adjustment factor significantly affected the results. Significance was defined as the absolute value of the relative difference given by eq. 11 being larger than or equal to a user-defined minimum δPi, min, and the probability of contact given by eq. 9 being no smaller than another user-defined minimum Pi, min = 10%. As seen in Fig. 1, the age adjustment factor had a significant impact for intermediate values of prevalence and number of encounters (shaded areas). When the prevalence and the number of encounters were small (below shaded areas), the probability of contact was smaller than Pi, min and hence unlikely to be of practical concern. When they were large (above shaded areas), the probability of contact was very close to 1, which limited the relative difference δPi to a value smaller than δPi, min and made the impact of the age adjustment factor on the probability of contact negligible.
Fig. 1.
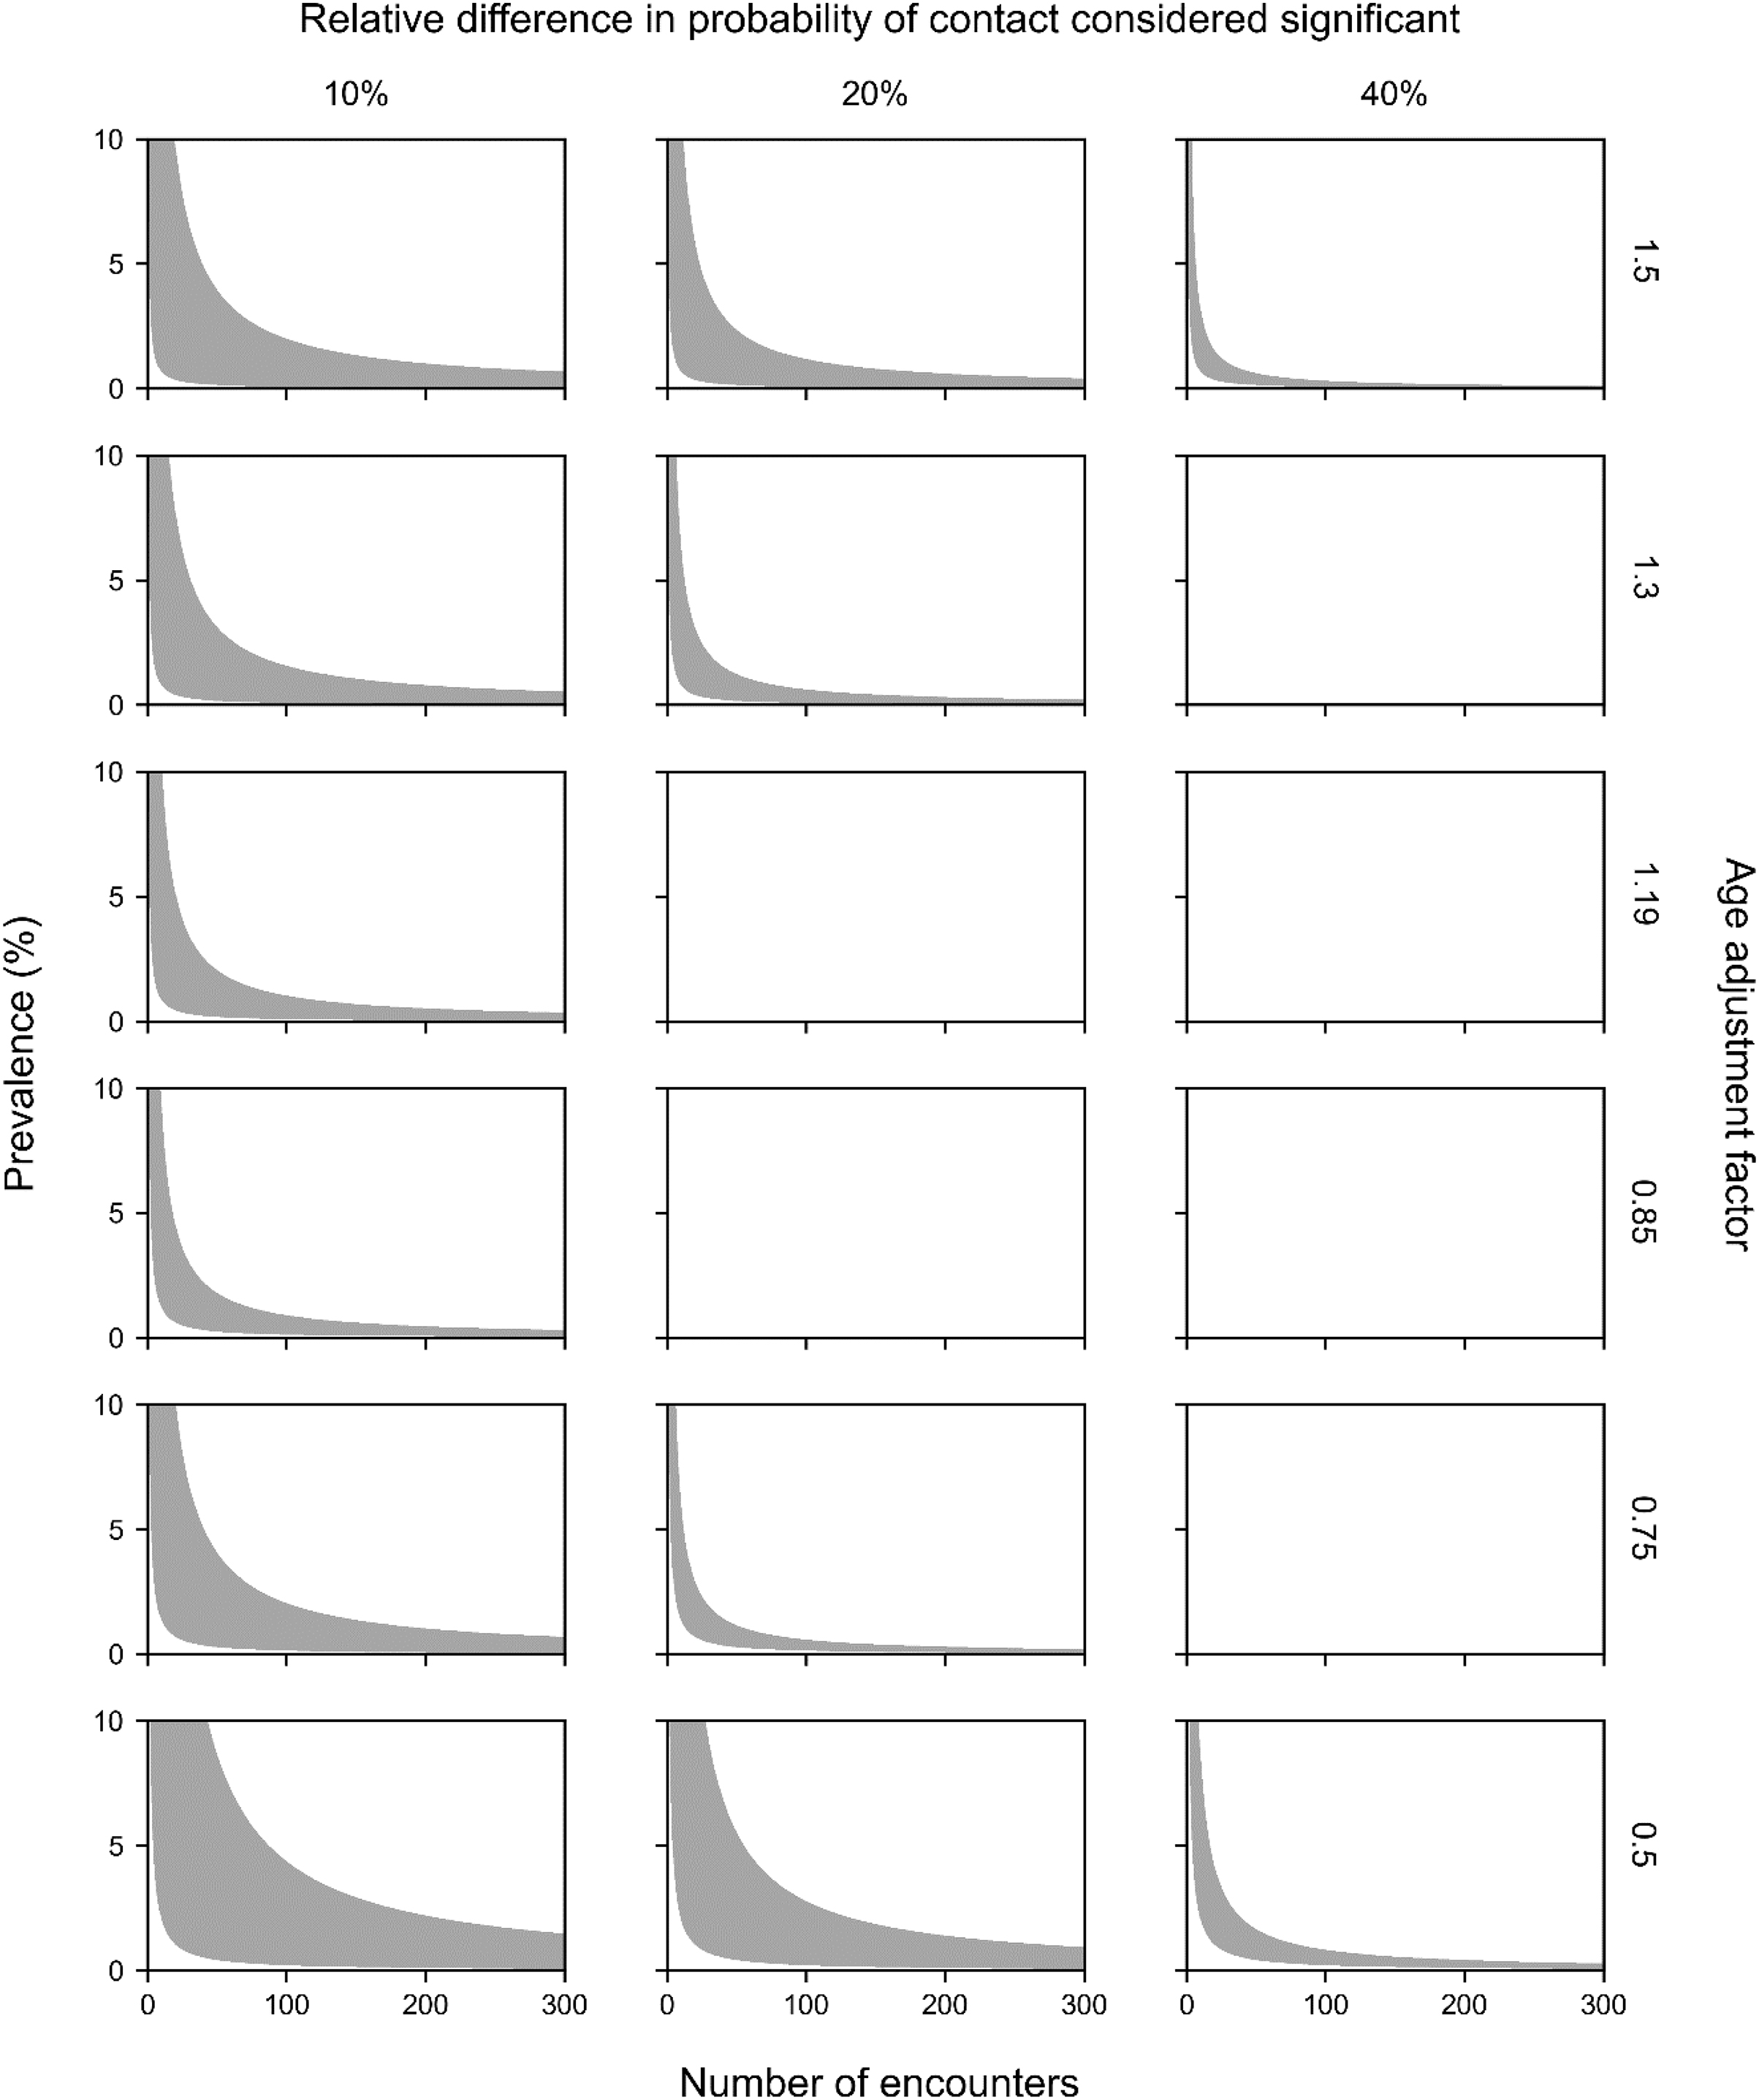
Age adjustment factors further from 1 (i.e., with an age distribution further from the population age distribution) created larger areas of significance in Fig. 1. The age adjustment factor did not have a symmetrical effect on the significance area: the area increased faster as fa decreased below 1 than when it increased above 1. This is due to the probability of contact in eq. 9 varying nonlinearly with the age adjustment factor fa.
The sample age adjustment factors in Table 1 varied between 0.75 and 1.19. Assuming the same 10% minimum contact probability (Pi, min), the age adjustment factor could produce differences of up to 20% in the probability of contact. Based on the sample values for age adjustment factor and number of encounters in Table 1, the activities that contributed the most to the probability of contact were post-secondary schooling, childcare, primary/secondary schooling, bars, and gym/fitness centres. For a given prevalence, group size was more important than the age adjustment factor in determining the probability of contact. The largest possible age adjustment factor (1.34) occurs in a situation where the only age group present is 20–59, corresponding to the age group with the highest prevalence.
4.2. Scenario: seated dining restrictions
4.2.1. Table size limit
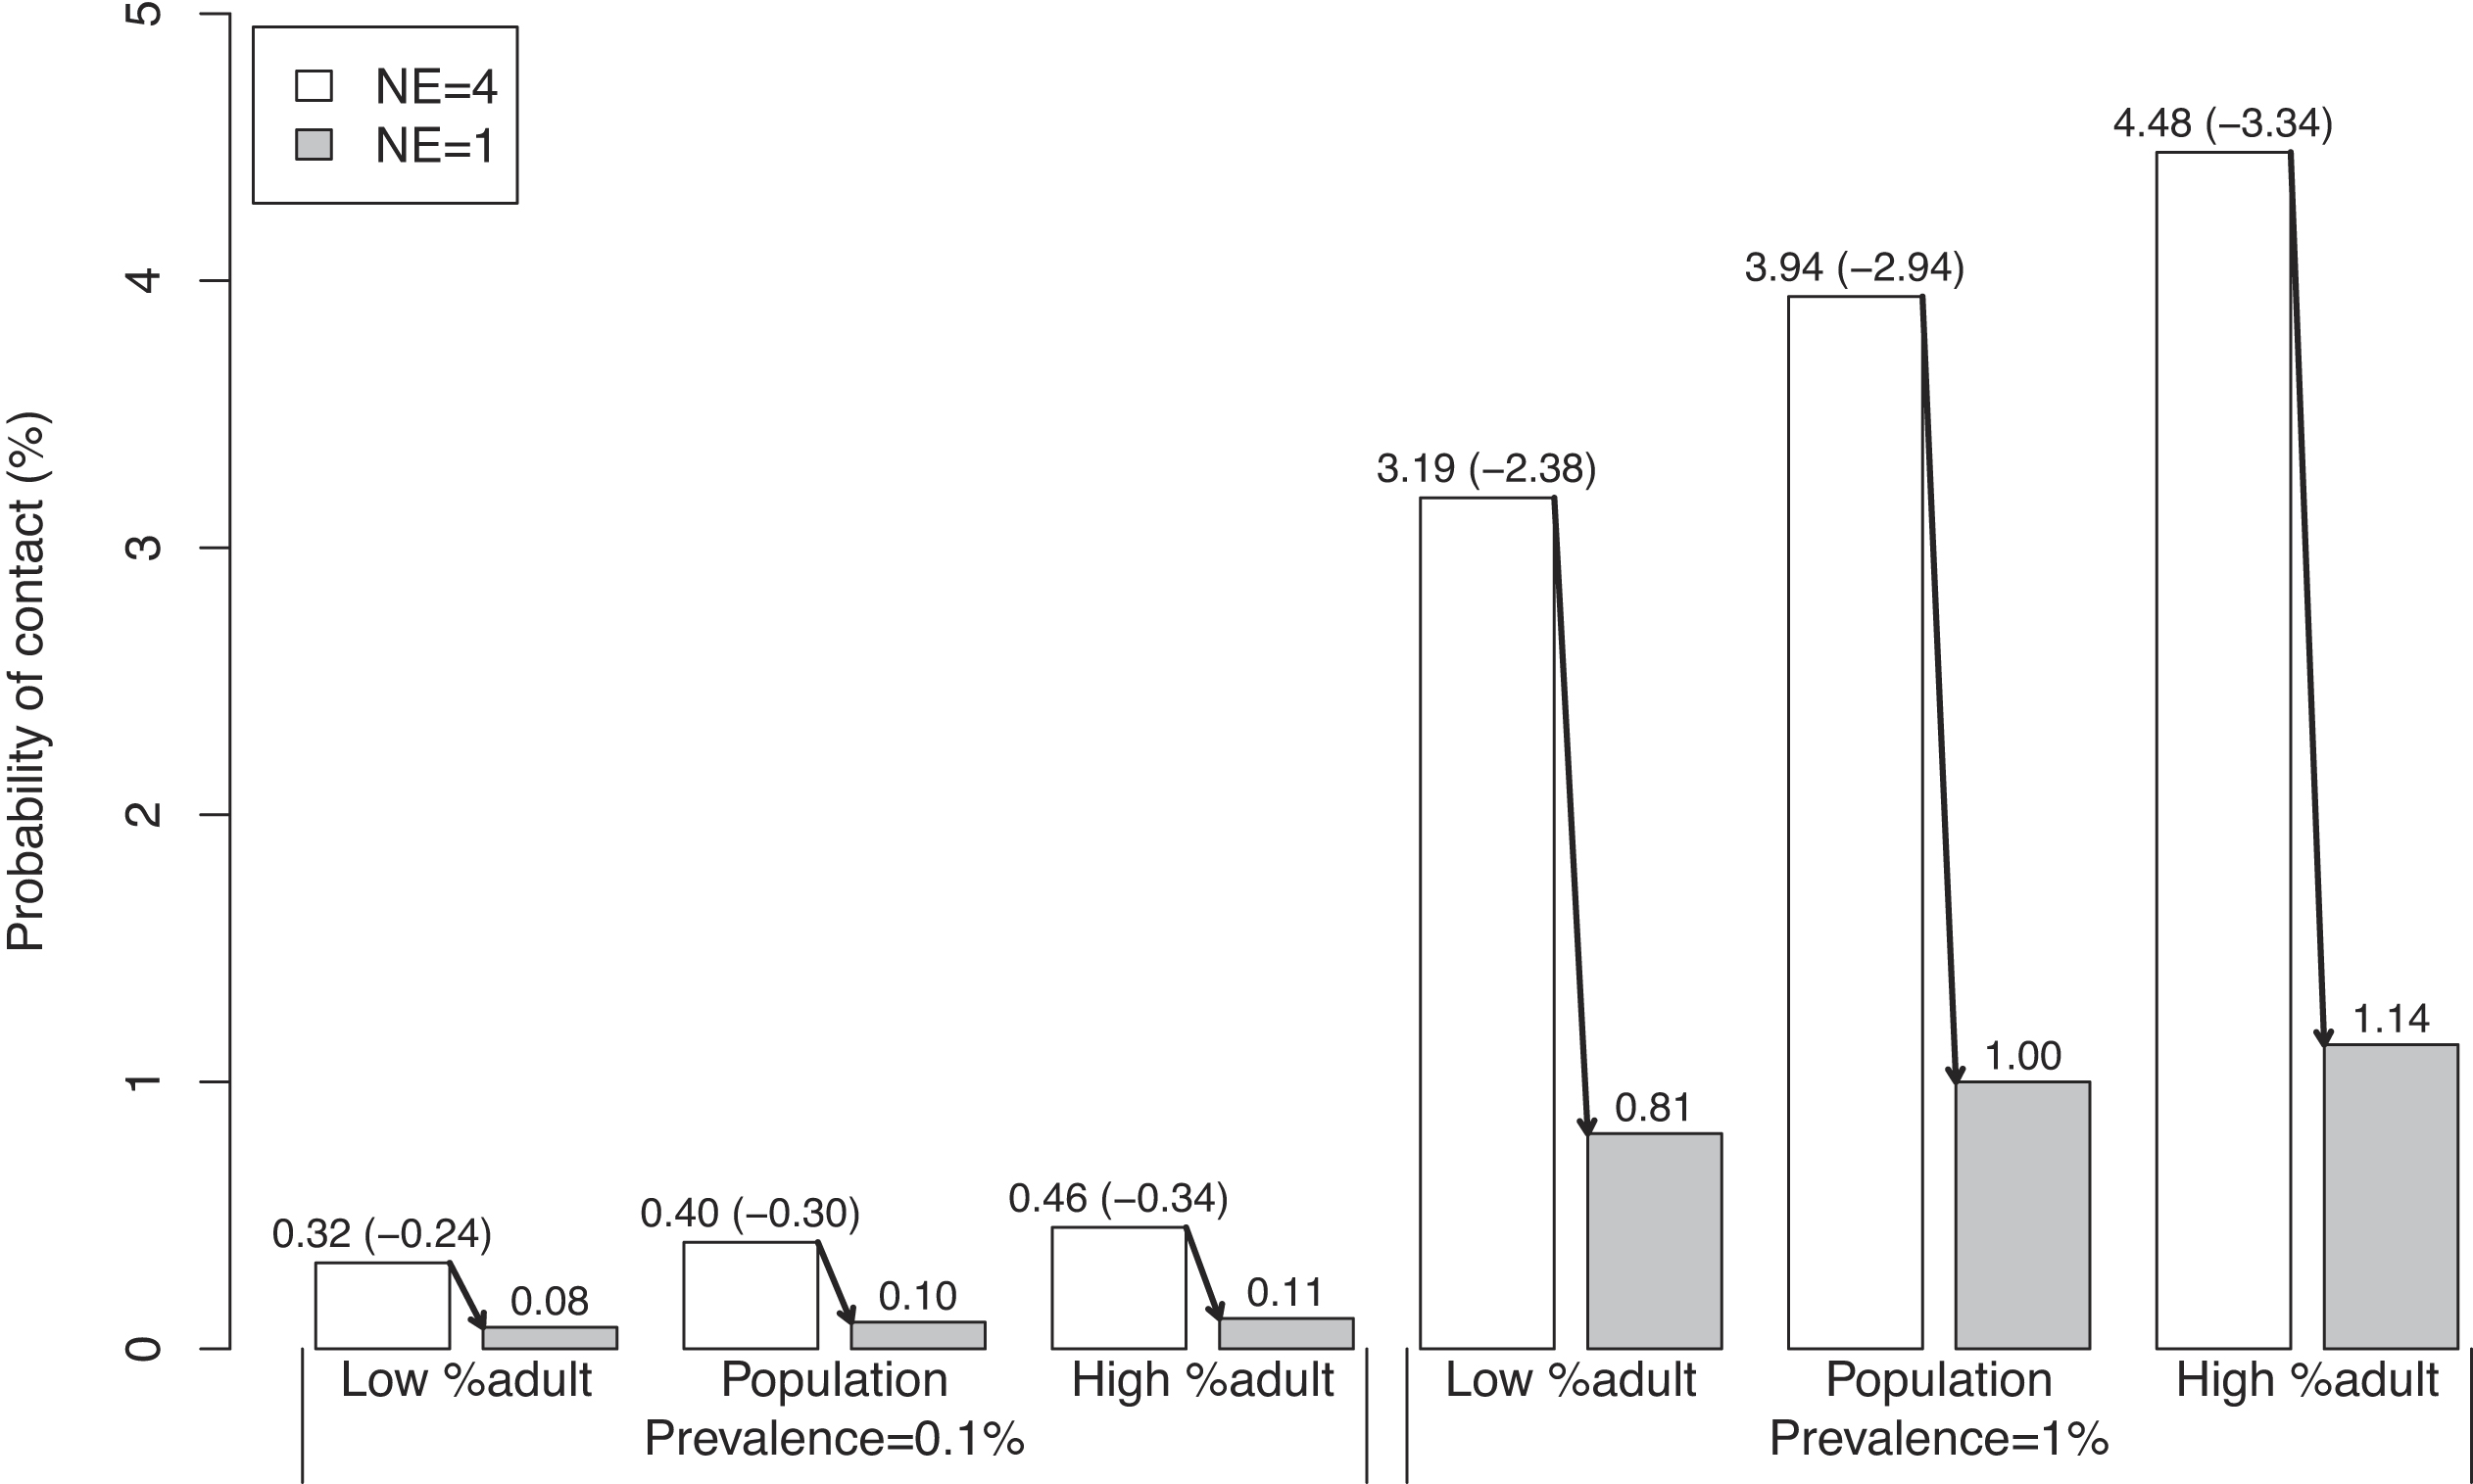
This policy option restricts the number of people that could be seated at a table, from five people (na = 4) to two people (na = 1). Inherent in this scenario is the assumption that people at different tables are not in contact with each other.
As expected, the four-fold reduction in the number of people encountered when dining led to a four-fold reduction in the probability of contact (Fig. 2). For instance, for a prevalence of 1% and the same age distribution as in the population, the contact probability decreased four-fold from 3.2% to 0.8%. Similarly, increasing prevalence from 0.1% to 1% led to a ten-fold increase in the probability of contact. The linearity between prevalence and number of encounters on the one hand, and the probability of contact on the other hand, held when the probability of contact was not too large (discussed further in Section 4.2.2). The probability of contact also varied linearly with the age adjustment factor, but the impact was more limited because of the smaller range of parameter values (0.81–1.14).
Fig. 2.
4.2.2. Regulating restaurant capacity
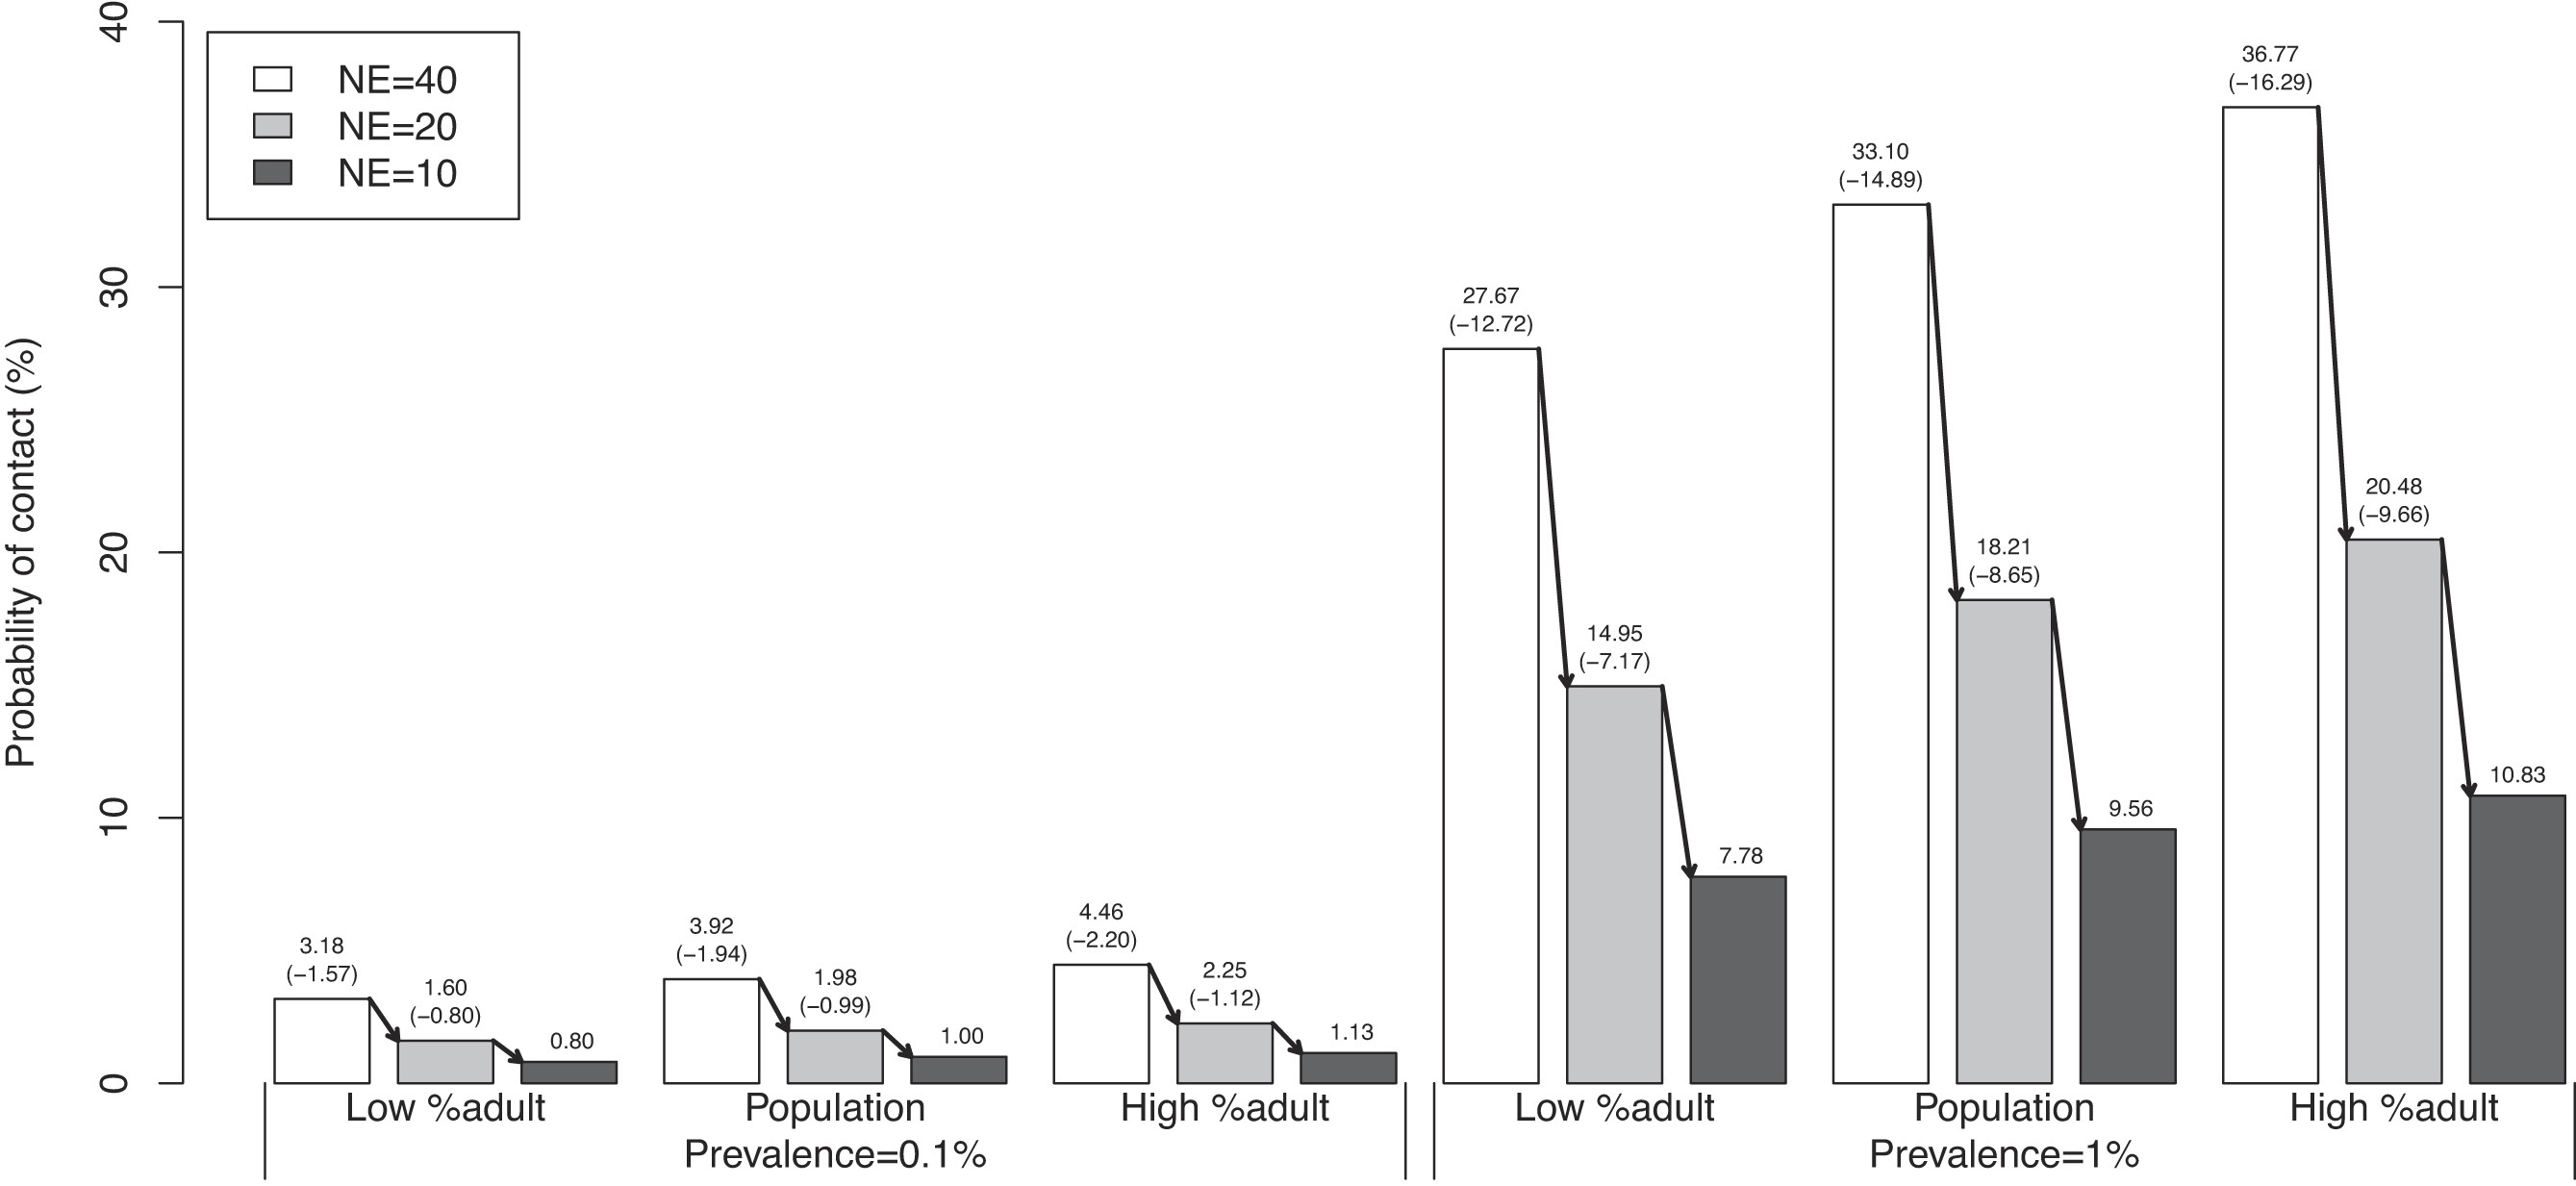
This policy option represents a public health measure that limits the number of people who can be in a seated dining facility at the same time. In Yukon, a “50% capacity” rule was commonly applied during the COVID-19 pandemic (Government of Yukon 2022b). Since “50% capacity” does not directly inform the number of people who can interact, this scenario uses values of 10, 20, and 40 individuals, and removes the previous assumption that only people at the same table could come into contact. Interaction between tables could represent either highly social locations or a change to airborne disease transmission where contact can effectively happen over longer distances (Parvez and Parveen 2022).
The results of the analysis for this policy option are shown in Fig. 3. Because of the larger number of encounters, the probabilities of contact were substantially larger than in the previous example (1%–37% vs. 0.1%–3.9%). The dependency of the probability of contact on prevalence, number of encounters, and age adjustment factor was similar to the first policy option; however, the linearity started to break down for larger probabilities of contact and the probability of contact increased more slowly. This happened because probabilities cannot exceed 100%, which means that the increase in probability of contact started to plateau as prevalence and number of encounters increased. For instance, with a group size of 40 and a prevalence of 1%, increasing the age adjustment factor from 1 to 1.14 (a relative increase of 14%) increased the probability of contact from 33% to 37% (a relative increase of only 12%). The nonlinearity was even larger for larger probabilities of contact.
Fig. 3.
4.3. Scenario: activity restrictions
The purpose of the Kingston activity simulation was to demonstrate how to compare the probability of contact with and without a given activity. Restricting recreational activities reduced the probability of contact by 4.4%, which was the largest reduction from any of the activities (Fig. 4). This was followed by restricting work, which reduced the probability of contact by 3.4%. An important aspect of this simulation was allowing individuals to participate in a set of activities unaffected by the restriction. Having a larger set of possible activities reduced the impact of restricting individual activities, since contact could be made elsewhere.
Fig. 4.
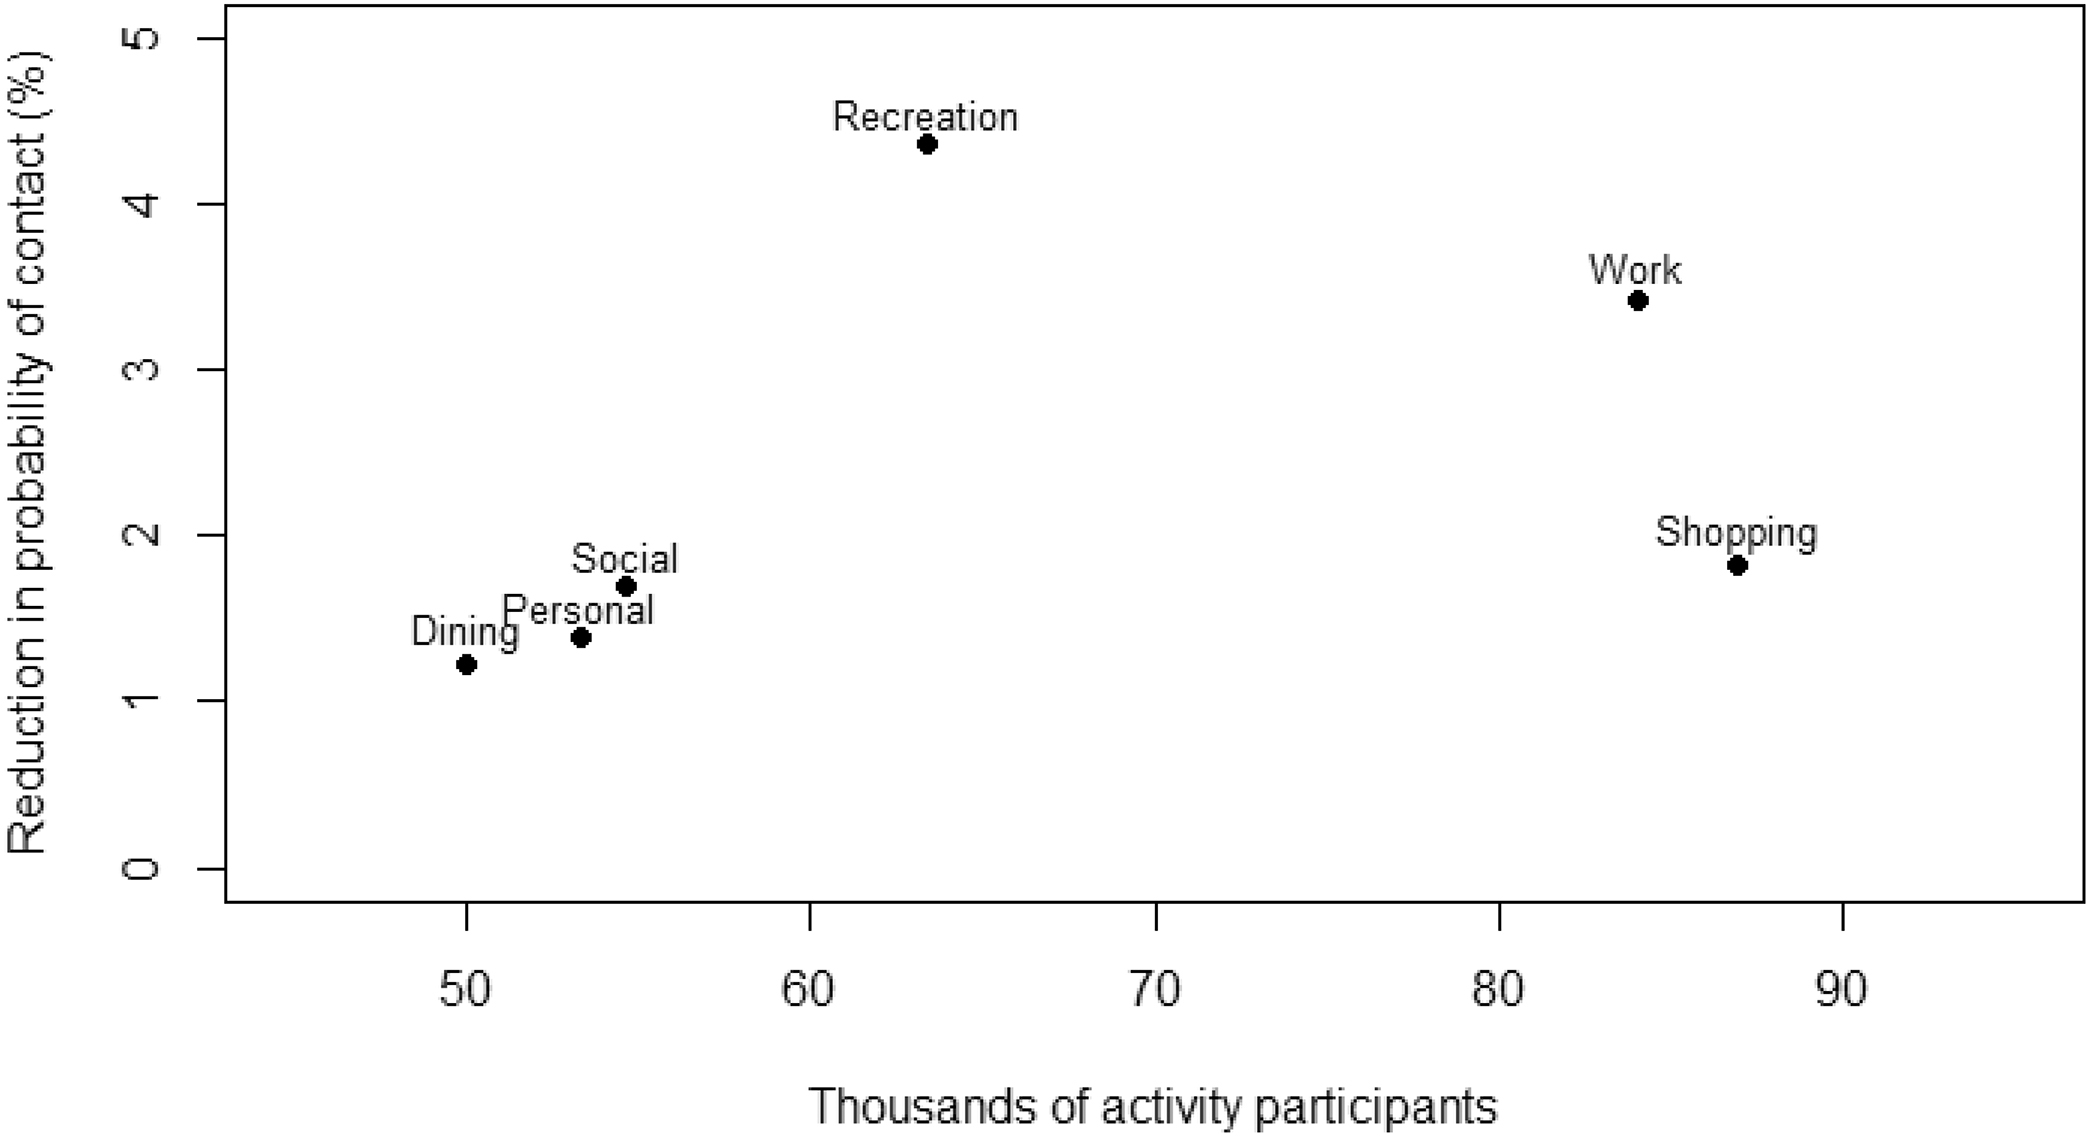
The model simulation also provided estimates of the number of participants for each activity, which could be of additional interest to a decision maker, since restricting activities that affect fewer people could be prioritized over activities more people participate in. Restricting the “shopping” and “social” activities resulted in similar decreases in contact probability. However, almost 80 000 people would be affected by restricting shopping, while only 63 000 people participated in social activities. Fewer people would be affected by restricting social activities compared to shopping, making social activity restrictions a potentially more efficient option to control contact probability.
Decision makers can weigh these estimated reductions in probability of contact jointly with other factors, such as mental health impacts and loss of economic activity, to decide whether activity restrictions are warranted to meet public health goals.
5. Discussion
The COVID-19 pandemic highlighted the importance of managing social behaviours that encourage disease spread. During the initial stages of the pandemic, there was a significant amount of ambiguity regarding the data accessible for determining the appropriate public health measures to implement and their execution strategies. As such, assumptions were made about social behaviours, activity group sizes, and the eventual effect of these public health measures on reducing the number of cases in the community. Our contact model is applicable to assessing the impacts of within-jurisdiction health measures on the probability of contacting infectious individuals. In particular, it can be used to estimate the impact of the disparity in prevalence among age groups on the reduction that can be expected from group-size restrictions. As a follow up to this research, the probability of contact obtained from this contact model could be used as input to other models that consider transmission, such as compartmental models or a statistical model to calculate the probability of transmission given the probability of contact.
Applications of our model demonstrate that the impact of age distribution on the probability of contact can be substantial for intermediate values of prevalence and groups sizes when there is a sufficiently large difference in prevalence between age groups. The age adjustment factor produced differences of up to 20% in the probability of contact under realistic activity age distributions. However, when the prevalence was small, the age adjustment factor had a minor effect on the probability of contact, because the probability of contact was and remained small. At the other extreme, when the prevalence or group sizes were large, the overall probabilities of contact were close to one and the impact of the age adjustment factor was also negligible. The age adjustment factor could play an important role in estimating the probability of contact when there is a disparity in infection rates between various age groups, and the prevalence and number of encounters assume intermediate values. The concept of an age adjustment factor could be extended to account for differences in prevalence among other subpopulations such as occupation groups and vaccination status.
The contact model considered group members to be randomly chosen from age-specific subpopulations. This simplifying assumption, common to importation models (e.g., Champredon et al. 2021), ignores correlations between the infection status of cohorting individuals. One type of age cohorting is addressed through our contact model’s activity age adjustment factor: this corrects for different proportions of age groups participating in each activity. The model does not address the non-random cohorting expected to occur in each group. For instance, when participating in a seated dining activity, people are more likely to sit with others with whom they have repeated exposure, such as family members and friends. The repeated exposure imposes a correlation in infection status among the group members. This could be addressed in the contact model by replacing the number of people encountered in an activity by the number of cohorts encountered at that activity. This correction is related to the public health policy of “bubbling”, where the number of unique contacts is limited to the people in your bubble.
Since each activity contributes to a person’s total probability of contact, it is important to correctly identify the list of activities a person can do. In the activity restriction example, we subsetted the list of activities to those where the Kingston transportation survey and Table 1 had reasonable overlap. If using the contact model for decision-making, a more comprehensive list of activities may need to be compiled.
Like all models, the results of our contact probability model are limited by the accuracy of the parameters. Table 1 presents sample values for group sizes and age distributions of people participating in different activities, but limited data were available. Travel surveys, such as the one used in the activity restriction scenario, are available from many cities and may contain useful behaviour data. Other surveys that quantify activity participation could also provide invaluable information. However, behaviours early in the COVID-19 pandemic differed from normal behaviours and evolved throughout the pandemic because of policies, vaccines, and habituation. Before using the contact model for policy decisions, a decision maker should consider the following:
•
How many people are in a community?
•
What activities in the community involve people contacting people outside their household?
•
How many people participate in those activities?
•
How many different groups of people participate in a given activity?
•
What is the age distribution of activity participants?
•
What is the local infectious disease prevalence?
•
What is the age distribution of the infectious disease prevalence?
This is an extensive list of questions that may not be readily answered, especially if time-sensitive decisions need to be made. To address data limitations in future studies, we suggest deploying observers to an assortment of locations to record approximate group sizes and ages, which could provide further validity. Such visual surveys could be done quickly, remotely (no interaction with activity participants being required), and repeatably. A visual survey would also avoid reporting biases that likely exist when people are asked to report their behaviours in a written survey, especially when public health measures encourage limiting group sizes or activities. Visual surveys would ideally be supplemented by interviews to provide information about cohorting, and other activities in which a person engaged that were not directly observed. Alternative approaches, including collecting microcontact data through cellular phones, could also be deployed to support modelling efforts (for a past example during the H1N1 pandemic, see Hashemian et al. (2012)).
6. Conclusion
Our work provides a model that predicts an individual’s probability of contacting someone infected with a disease based on locations they visited and their activities in the period prior to the assessment date. It presents a framework to calculate probabilities and encourage risk reduction that could be adopted for use in public health policy or for educating individuals on the risks of contact associated with different behaviours. Our contact probability model could also be combined with disease propagation models to inform parameters corresponding to contact or transmission probabilities, and how those might change under scenarios with different public health measures. Future iterations of the model could incorporate occupation groups and vaccination status, as well as validated group sizes and activity age distributions. Our importation model provides a useful tool to support evidence-based decision-making on the effectiveness of activity-based public health measures when prevalence varies between age groups.
Acknowledgements
We would like to thank Dr. Caroline Colijn, Dr. Shashi Shahi, and Rodney Hulstein for their comments on an earlier draft of this manuscript. We are also grateful to the peer reviewers for their valuable feedback and suggestions, which enhanced the focus and quality of our paper. We would also like to thank colleagues from the Government of Yukon for providing data and supporting this work, although the interpretations and conclusions of this paper are our own and do not necessarily reflect the views of the Government of Yukon.
References
BC Centre for Disease Control. 2020. BC COVID-19 data [online]. Available from http://www.bccdc.ca/health-info/diseases-conditions/covid-19/data [accessed 29 April 2022].
Brown University—Alpert Medical School. 2020. MyCOVIDRisk [online]. Available from https://mycovidrisk.app [accessed 17 January 2022].
Canadian Institute for Health Information. 2019. Nursing in Canada, 2018: a lens on supply and workforce [online]. Ottawa. Available from https://www.cihi.ca/sites/default/files/document/regulated-nurses-2018-report-en-web.pdf.
Canadian Institute for Health Information. 2020. A profile of physicians in Canada, 2020 [online]. Available from https://www.cihi.ca/en/a-profile-of-physicians-in-canada-2020 [accessed 16 September 2022].
Canadian Institute for Health Information. 2022. Hospital stays in Canada, 2021–2022 [online]. cihi.ca. Available from https://www.cihi.ca/en/hospital-stays-in-canada [accessed 16 September 2022].
Champredon D., Fazil A., Ogden N.H. 2021. Simple mathematical modelling approaches to assessing the transmission risk of SARS-CoV-2 at gatherings. Canadian Communicable Disease Report, 47(4): 184–194.
Chatterjee R., Bajwa S., Dwivedi D., Kanji R., Ahammed M., Shaw R. 2020. COVID-19 risk assessment tool: dual application of risk communication and risk governance. Progress in Disaster Science, 7, 100109.
Chen Z., Chen J., Zhou J., Lei F., Zhou F., Qin J.-J., et al. 2021. A risk score based on baseline risk factors for predicting mortality in COVID-19 patients. Current Medical Research and Opinion, 37(6): 917–927.
Davies N.G., Klepac P., Liu Y., Prem K., Jit M., Pearson C.A.B., et al. 2020. Age-dependent effects in the transmission and control of COVID-19 epidemics. Nature Medicine, 26(8): 1205–1211.
Global Travel Retail Magazine. 2022. Major shift in shopper demographics and behaviors, says m1nd-set [online]. Available from https://www.gtrmag.com/business-news/industry-news/2022/07/26/major-shift-in-shopper-demographics-and-behaviors-says-m1nd-set/ [accessed 13 October 2023].
Government of Ontario. 2022. Child care rules in Ontario [online]. ontario.ca. Available from http://www.ontario.ca/page/child-care-rules-ontario [accessed 23 August 2022].
Government of Yukon. 2022a. What to do if you’re told you’re a close contact [online]. Available from https://yukon.ca/en/what-do-if-youre-told-youre-close-contact [accessed 9 May 2022].
Government of Yukon. 2022b. Additional public health measures in force [online]. Available from https://yukon.ca/en/news/additional-public-health-measures-force [accessed 17 October 2023].
Guillouzic S., Horn S., Mirshak R. 2022. Missed infection calculator [online]. Defence Research and Development Canada. Available from https://covid-app.cloud.forces.gc.ca/tools [accessed 24 March 2022].
Hashemian M., Qian W., Stanley K.G., Osgood N.D. 2012. Temporal aggregation impacts on epidemiological simulations employing microcontact data. BMC Medical Informatics and Decision Making, 12(132).
Horn S., Drouin P.-L., Guillouzic S., Hunter G. 2022. COVID-19 point prevalence map [online]. Defence Research and Development Canada. Available from https://covid-app.cloud.forces.gc.ca/map [accessed 18 January 2022].
Innovation, Science and Economic Development Canada. 2022. Personal care services—8121—summary—Canadian Industry Statistics [online]. Available from https://ised-isde.canada.ca/app/ixb/cis/summary-sommaire/8121 [accessed 16 September 2022].
Johns Hopkins Bloomberg School of Public Health. 2020. COVID-19 risk tools [online]. Available from https://covid19risktools.com:8443/riskcalculator [accessed 17 January 2022].
Lewnard J.A., Lo N.C. 2020. Scientific and ethical basis for social-distancing interventions against COVID-19. The Lancet Infectious Diseases, 20(6): 631–633.
McChesney J., Bichsel J. 2020. The aging of tenure-track faculty in higher ed: implications for succession and diversity [online]. College and University Professional Association for Human Resources. Available from https://www.cupahr.org/surveys/research-briefs/2020-aging-of-tenure-track-faculty-in-higher-ed-implications-for-succession-diversity/ [accessed 16 September 2022].
McPhee-Knowles S., Hoffman B., Kanary L. 2022. COVID-19: Yukon’s experience with travel restriction and the unvaccinated. Canadian Communicable Disease Report, 48(1): 17–21.
Miller G.F., Greening B., Rice K.L. Jr., Arifkhanova A., Meltzer M.I., Coronado F. 2022. Modeling the transmission of COVID-19: impact of mitigation strategies in prekindergarten-grade 12 public schools, United States, 2021. Journal of Public Health Management and Practice, 28(1): 25–35.
Mossong J., Hens N., Jit M., Beutels P., Auranen K., Mikolajczyk R., et al. 2008. Social contacts and mixing patterns relevant to the spread of infectious diseases. Plos Medicine, 5(3): e74.
National Center for Education Statistics. 2019. Indicator 23: postsecondary graduation rates [online]. In Status and trends in the education of racial and ethnic groups Available from https://nces.ed.gov/programs/raceindicators/indicator_red.asp [accessed 16 September 2022].
National Center for Education Statistics. 2020. Fast facts: immediate transition to college [online]. Available from https://nces.ed.gov/fastfacts/display.asp?id=51 [accessed 16 September 2022].
National Institute on Ageing. 2021. My COVID-19 visit risk decision aid (2021 - 2022) [online]. Available from https://covidvisitrisk.com/index.html [accessed 18 January 2022].
O'Keefe J.B., Tong E.J., Taylor T.H., O'Keefe G.A.D., Tong D.C. 2021. Use of a telemedicine risk assessment tool to predict the risk of hospitalization of 496 outpatients with COVID-19: retrospective analysis. JMIR Public Health Surveillance, 7(4): e25075.
Ontario Centres for Learning, Research and Innovation in Long-Term Care. 2018. A home for all: younger residents living in long-term care [online]. Available from https://clri-ltc.ca/files/2019/01/Younger-Residents-in-LTC-Handout.pdf [accessed 16 September 2022].
Parajuli R.R., Mishra B., Banstola A., Ghimire B.R., Poudel S., Sharma K., et al. 2020. Multidisciplinary approach to COVID-19 risk communication: a framework and tool for individual and regional risk assessment. Scientific Reports, 10(1): 21650.
Parvez M.K., Parveen S. 2022. Airborne transmission of SARS-CoV-2 disease (COVID-19). Future Virology.
Pew Research Center. 2022. Religious landscape study [online]. Pew Research Center. Available from https://www.pewresearch.org/religion/religious-landscape-study/[accessed 16 September 2022].
Prem K., Cook A.R., Jit M. 2017. Projecting social contact matrices in 152 countries using contact surveys and demographic data. Plos Computational Biology, 13(9): e1005697.
Public Health Agency of Canada. 2021. COVID-19 for health professionals: transmission [online]. Available from https://www.canada.ca/en/public-health/services/diseases/2019-novel-coronavirus-infection/health-professionals/transmission.html [accessed 7 November 2023].
Quilty B.J., Diamond C., Liu Y., Gibbs H., Russell T.W., Jarvis C.I., et al. 2020. The effect of travel restrictions on the geographical spread of COVID-19 between large cities in China: a modelling study. BMC Medicine [Electronic Resource], 18(1): 259.
R.A. Malatest & Associates Ltd. 2019. KingstonMoves: household travel survey 2019. daily travel characteristics. [online]. City of Kingston. Available from https://www.cityofkingston.ca/documents/10180/17995649/Transportation_Projects_KingstonMoves_SurveyReport.pdf.
Rizzo N. 2021. 77 gym membership statistics, facts, and trends [2020/2021][online]. RunRepeat. Available from https://runrepeat.com/gym-membership-statistics [accessed 16 September 2022].
SEO Design Chicago. 2021. Social strategies for spas [online]. Available from https://seodesignchicago.com/marketing/social-strategies-for-spas/ [accessed 16 September 2022].
Statista. 2020. Monthly on-premise wine drinking in the United State in 2019, by age [online]. Statista. Available from https://www.statista.com/statistics/1166594/on-premise-wine-drinking-by-age/[accessed 16 September 2022].
Statistics Canada. 2013. Table C.2.3 student-educator ratio in public elementary and secondary schools, Canada, provinces and territories, 2001/2002 to 2010/2011 [online]. Government of Canada. Available from https://www150.statcan.gc.ca/n1/pub/81-582-x/2013001/tbl/tblc2.3-eng.htm [accessed 16 September 2022].
Statistics Canada. 2017a. High use of acute care hospital services at age 50 or older [online]. Government of Canada. Available from https://www150.statcan.gc.ca/n1/pub/82-003-x/2017009/article/54855-eng.htm [accessed 16 September 2022].
Statistics Canada. 2017b. Census profile, 2016 census—Canada [online]. Government of Canada. Available from https://www12.statcan.gc.ca/census-recensement/2016/dp-pd/prof/details/page.cfm [accessed 16 September 2022].
Statistics Canada. 2018. Transitions to long-term and residential care among older Canadians [online]. Government of Canada. Available from https://www150.statcan.gc.ca/n1/pub/82-003-x/2018005/article/54966/tbl/tbl01-eng.htm [accessed 16 September 2022].
Statistics Canada. 2021a. Proportion of educators in public elementary and secondary schools by age group [online]. Government of Canada. Available from https://www150.statcan.gc.ca/t1/tbl1/en/tv.action?pid=3710015302 [accessed 16 September 2022].
Statistics Canada. 2021b. Population estimates on July 1st, by age and sex [online]. Government of Canada. Available from https://www150.statcan.gc.ca/t1/tbl1/en/tv.action?pid=1710000501 [accessed 16 September 2022].
Statistics Canada. 2021c. Postsecondary enrolments, by registration status, institution type, status of student in Canada and gender [online]. Government of Canada. Available from https://www150.statcan.gc.ca/t1/tbl1/en/tv.action?pid=3710001801 [accessed 16 September 2022].
Statistics Canada. 2022. Census profile, 2021 census of population—Kingston and the Islands, Ontario [online]. Available from https://www12.statcan.gc.ca/census-recensement/2021/dp-pd/prof/index.cfm [accessed 24 November 2023].
World Health Organization. 2023. WHO Coronavirus (COVID-19) dashboard [online]. Available from https://covid19.who.int [accessed 9 September 2022].
Information & Authors
Information
Published In
FACETS
Volume 9 • 2024
Pages: 1 - 11
Editor: David Moher
History
Received: 5 June 2023
Accepted: 19 December 2023
Version of record online: 9 July 2024
Copyright
© 2024 Authors Kanary, Hoffman, McPhee-Knowles and The Crown. This work is licensed under a Creative Commons Attribution 4.0 International License (CC BY 4.0), which permits unrestricted use, distribution, and reproduction in any medium, provided the original author(s) and source are credited.
Data Availability Statement
Data analyzed during this study came from secondary sources and are available from the provided references.
Key Words
Sections
Subjects
Plain Language Summary
Impact of age on the likelihood of contact with a contagious person
Authors
Author Contributions
Conceptualization: BH, BG, LK
Data curation: BG, SG, LK
Formal analysis: BG, SG
Funding acquisition: LK
Investigation: SM, SG
Methodology: BH, BG, SG, LK
Project administration: LK
Software: LK
Supervision: LK
Validation: BG, SG
Writing – original draft: BH, BG, SM, LK
Writing – review & editing: BH, BG, SM, SG, LK
Competing Interests
Lisa Kanary and Sara McPhee-Knowles report research grants from the Canadian Network for Modelling Infectious Disease (CANMOD) and the YukonU Scholarly Activity Fund. There is no other conflict of interest in this project.
Funding Information
Canadian Network for Modelling Infectious Disease (CANMOD): RGPID-560516-2020
Natural Sciences and Engineering Research Council of Canada (NSERC)
Funding for this project was provided by Emerging Infectious Diseases Modelling Initiative (EIDM) of the Natural Sciences and Engineering Research Council of Canada (NSERC) and Canadian Network for Modelling Infectious Disease (CANMOD) (Agency Grant Number: RGPID-560516-2020).
Metrics & Citations
Metrics
Other Metrics
Citations
Cite As
Bryn Hoffman, Brian Gaas, Sara McPhee-Knowles, Steve Guillouzic, and Lisa Kanary. 2024. Development of an age-adjusted, activity-based contact probability model for infectious diseases. FACETS.
9: 1-11.
https://doi.org/10.1139/facets-2023-0094
Export Citations
If you have the appropriate software installed, you can download article citation data to the citation manager of your choice. Simply select your manager software from the list below and click Download.
There are no citations for this item