Base land cover map
All mapping and processing were done using ArcGIS Desktop 10.4.0 (
ESRI 2021). A detailed description of the processing and assembly of our base land cover map can be found in Supplementary Materials (Supplementary Material 1: S2. Geo-spatial processing), including hyperlinks to all original mapping products used. Briefly, base land cover data for crop fields and forages (including grasslands, hay, and pasture) were from the Agriculture and Agri-food Canada (AAFC) Annual Crop Inventory Map (
AAFC 2015) and all other base land covers, including developed land cover, were from the Commission for Environmental Cooperation's (CEC) North American Land Cover Map (
CEC 2015). Both raster maps have a 30 m spatial resolution. Some larger roads in both maps were captured as “developed” land cover; however, smaller roads were readily missed given pixel resolution. Therefore, for both maps, roads were erased prior to merging using a shrink and expand operation. Overlay masks were then created and added for roads and their margins, as well as transmission corridors, rail rights-of-way and their margins, watercourses, the edges of water bodies and wetlands, and field margins (Supplementary Material 1: S2. Geo-spatial processing: Overlay preparation). Overlay masks allowed us to partition land cover within a single raster cell into multiple land cover types and estimate common milkweed stem availability for each land cover type accordingly. For example, two-lane roads were assumed to have a width of 12 m with 3 m of road margin on either side. Thus, if a road grid cell occurred over a land cover grid cell defined as crop, then the cell would be portioned into an area of road ditch of 3 × 2 × 30 = 180 m
2, an area of road surface of 12 × 30 = 360 m
2, and a remaining area of crop of 900 – 180 – 360 = 360 m
2. Each of these areas would be multiplied by the appropriate common milkweed stem density (described below) to estimate the density for the full cell. Overlays for rivers, lakes, and watercourses were created from Natural Resources Canada's (NRCan) Lakes, Rivers, and Glaciers in Canada–CanVec Series–Hydrographic Features map (
NRCan 2017a). Overlays for transmission line rights-of-way were created from NRCan's Mines, Energy and Communication Networks in Canada–CanVec Series–Resources Management Features map (
NRCan 2017b). Overlays for roads were created from Statistics Canada's (StatCan) National Road Network–NRN–GeoBase Series Map (
StatCan 2018a). Railway rights-of-way overlays were created from NRCan's National Railway Network–NRWN–GeoBase Series map (
NRCan 2016). Wetland edge overlays were developed using the outer pixels of wetlands mapped in the CEC Land Cover of North America Map (
CEC 2015). Last, to create an overlay for field margins, we applied an edge detector to the AAFC crop inventory data and accepted an edge as a margin if it occurred between two different agricultural land cover types, i.e., our measurement of edge does not account for field edges between two fields containing the same land cover type. However, this underestimate is partly balanced by the fact that our measure of edge also assumes a field margin exists where two different crops are planted side by side even if they are directly adjacent with no field margin between them. We posit that any overestimation or underestimation of field margin amount is unlikely to influence the general conclusions of our study because even if we underestimated common milkweed availability in field margins by a factor of two, field margins would still only support 2% of our total estimated common milkweed stem availability (
Table 2). All mapping products were re-projected to the Albers projection and resampled to a 30 m spatial resolution to match the resolution of the AAFC and CEC land cover maps described above.
Common milkweed stem availability by land cover type
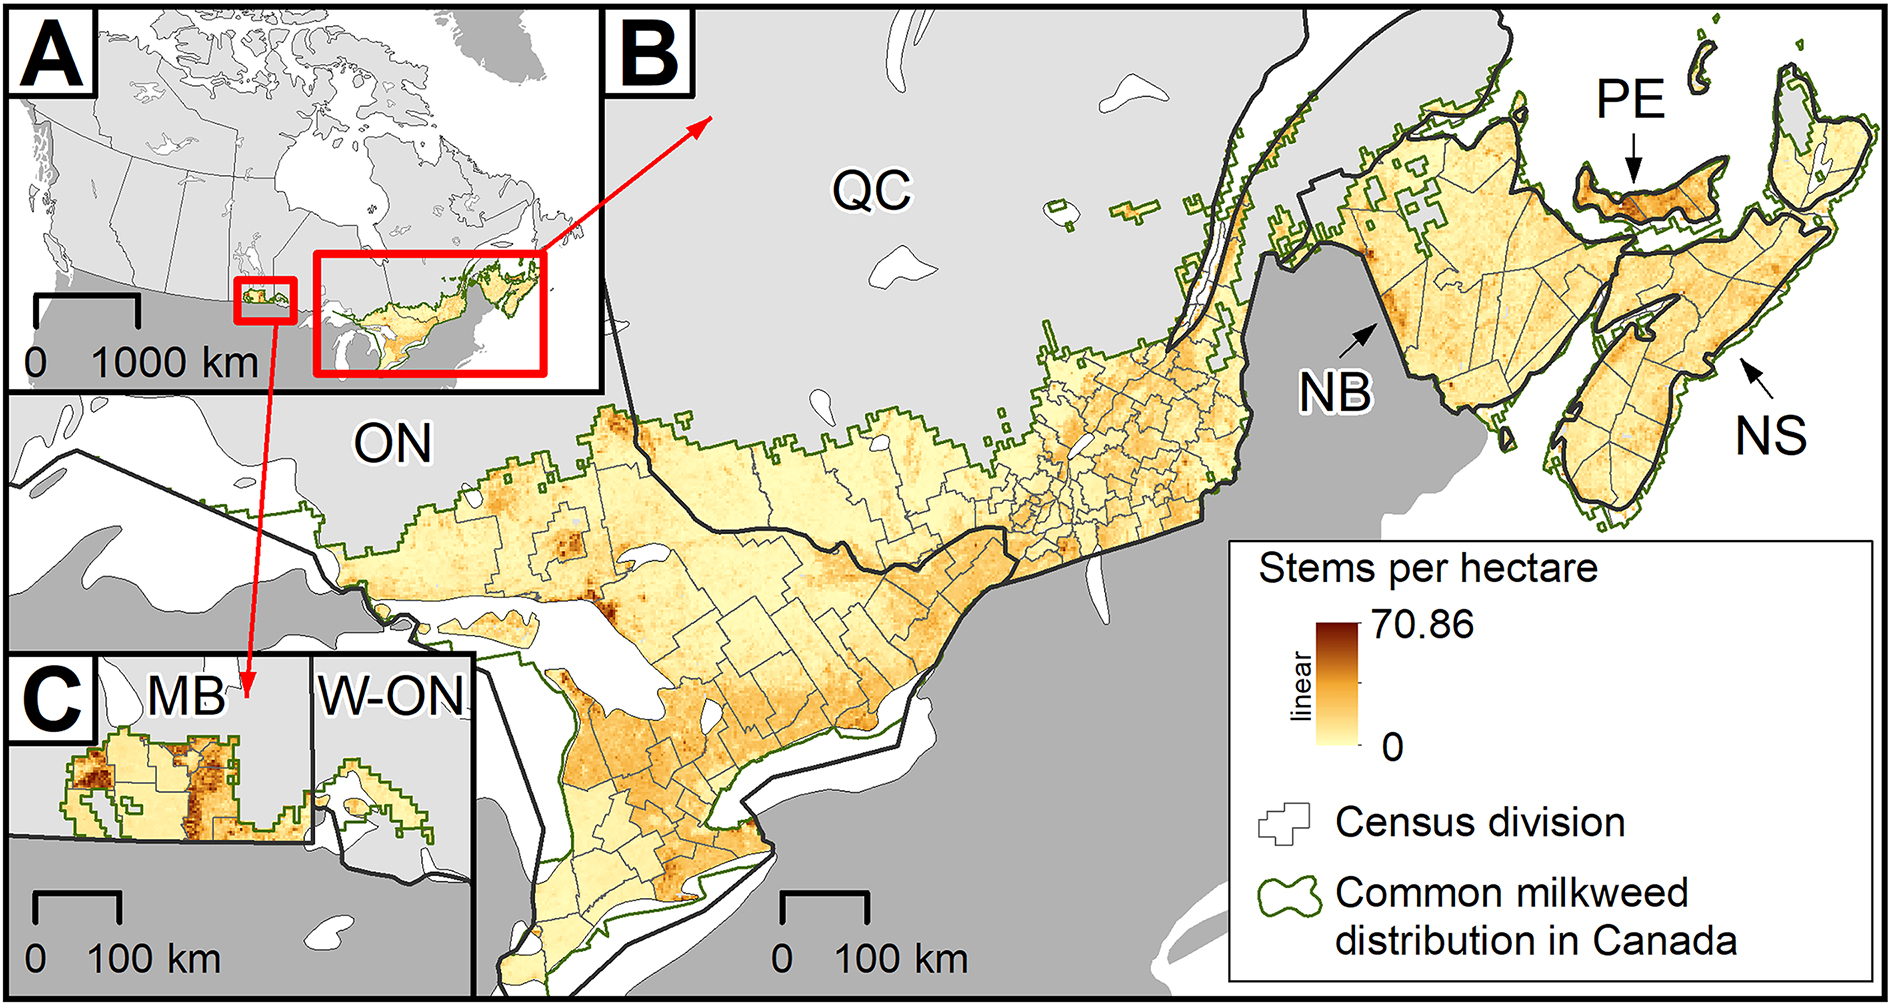
We used a species distribution model from
Drapeau Picard et al. (2024) to define the geographic extent over which common milkweed can be found in Canada. We could not use this model to estimate common milkweed availability because it is based on presence-only data and does not account for abundance. Instead, we used common milkweed stem densities per land cover type from the literature (described below;
Table 1), building off
Thogmartin et al. (2017b). We refer to both the summation of stem densities per land cover type and across land cover types as stem availability.
For agricultural land covers, we estimated stem availability for soy, corn, other crops, and forages individually following
Thogmartin et al. (2017b) using data from both Canada and the Midwestern United States (
Table 1). Common milkweed stem density estimates used by
Thogmartin et al. (2017b) were originally measured in the Midwestern United States, where adoption rates for glyphosate-tolerant soy and corn were 94% and 89% by 2015, respectively (
USDA 2023; refer to
Pleasants 2017). However, fine-scale spatial information on glyphosate use in Canada is not publicly available (
Bacon et al. 2023). Therefore, we used herbicide adoption rates at the county level as a proxy for glyphosate adoption rates for corn, soy, and other crops within the range of common milkweed in Canada. We felt this was a reasonable assumption given that glyphosate represents the primary active ingredient sold across all pesticide types in Canada within the agricultural sector by an order of magnitude (∼tens of millions of kg of active ingredients compared with millions for each of the other top five herbicides; Pest Management Regulatory Agency
(PMRA) 2021). In eastern Ontario, where the only empirical measurements of proportion of sites occupied and area occupied by common milkweed in agricultural fields are readily available for Canada (described below), herbicide adoption rates range from 41% to 70% (
StatCan 2016). In contrast, for much of southwestern Ontario and parts of southern Manitoba, herbicide adoption rates range from 71% to 90% (
StatCan 2016). Therefore, for counties (refer to
StatCan 2018b) in Canada where herbicide adoption rates are >70%, we used the Midwestern United States stem availability estimates for soy, corn, and other crops land cover categories from
Pleasants (2017). For all other census divisions, we used stem availability estimates derived from
Fahrig et al. (2015) and
Martin et al. (2020) from eastern Ontario (refer to
Table 1 for sources of land cover-specific common milkweed stem availability estimates). Given stem availability estimates are not available for field margins in the Midwestern United States where glyphosate use is high or in Canada where herbicide adoption rates are high, we used the same field margin estimates from eastern Ontario regardless of herbicide adoption rates or glyphosate use.
Stem availability estimates for agricultural land covers from eastern Ontario, including field margins, were derived using data on the proportion of sites occupied and area occupied by common milkweed from surveys conducted in 93 agricultural landscapes across 2011 and 2012 (
Fahrig et al. 2015;
Martin et al. 2020). Briefly, surveys were conducted at four sites per landscape; two surveys occurred within agricultural fields and two occurred at the field/field margin interface. Surveys were also conducted twice per site, once between 24 May and 9 July, and once between 17 July and 30 August. For this study, we only used surveys from the second sampling period because we were interested in understanding how much common milkweed is available to produce the final monarch generation that migrates to Mexico. We assumed that common milkweed availability during the second survey would be a more accurate representation of this because it integrates what is left over from the first survey period with new growth that occurred following the initial survey. Prior to the calculation of any summary statistics based on these data, we converted m
2 occupied by common milkweed per 100 m
2 to m
2 occupied per ha by dividing by 0.01. To derive stem densities (and standard errors (SEs) for land covers from these data (Supplementary Material 1: S1. Milkweed stem availability estimates: Table S1) we first calculated median area infested by common milkweed using a random selection of half the samples. We estimated the median rather than the mean area because measurements of area infested were highly right-skewed across sites. We then used a bootstrap procedure by repeating our median calculation a total 10 000 times with replacement and used the resulting distribution to calculate the mean (±standard deviation (SD)) of the median area occupied across sampling sites.
For all agricultural land covers in counties where herbicide adoption rates are ≤70%, we converted area occupied by common milkweed (m
2) per ha to stem availability per hectare using two different measurements of stem densities (stems/m
2) measured in Southwestern Ontario from
Pitman et al. (2018) because there are no stem density estimates available for eastern Ontario. Specifically, for soy, corn, and other crops, we used a mean estimate of 3.60 stems/m
2 (SD = 7.30) measured directly in soy and cornfields (Supplementary Material 1: S1. Milkweed stem availability estimates: Table S1). For field margins and forages, we used a mean estimate of 1.60 stems/m
2 (SD = 1.10) measured in restored grasslands/private properties.
For all non-agricultural land covers, we used Canadian-specific common milkweed data when available; otherwise, we used the most current published estimates from the Midwestern United States (
Table 1). We assumed that common milkweed availability was zero for water, exposed/barren, forest, wetland interior, road surface, and railway track land covers. To our knowledge, no estimates of common milkweed availability within forests have been published; however, densities are predicted to be very low (
Groh and Dore 1945;
Bhowmik and Bandeen 1976;
Bhowmik 1994).
Developed land cover in our basemap came from the CEC's North American Land Cover Map (
CEC 2015) and was defined by pixels containing ≥30% human constructed materials. No common milkweed availability estimates are available for developed land cover in Canada; therefore, we used stem availability estimates from Chicago, Illinois, United States of America (
Johnston et al. 2019), where common milkweed availability was measured across 14 sub-classes of developed land cover, including small-scale industrial, large-scale industrial, single family residential, common space/multi-family residential, corporate/medical, commercial, community/cultural, restricted use rights-of-way (margins), vacant lots, transitional/restricted use, minor road (margins), major rights-of-way (margins), conservation open space, and non-conservation open space land cover categories. Given that map products for developed land cover are not available at the same resolution as
Johnston et al. (2019) for most developed areas in Canada, we produced a single common milkweed availability estimate for developed land cover by averaging the mean stem availability estimates and SEs for 11 of the 14 land cover types detailed above. We did not include mean stem availability estimates and SEs from conservation and non-conservation open space land cover categories form
Johnston et al. (2019) in our mean because these lands in Canada were captured by other land cover categories in our basemap, i.e., watercourses, waterbody edges, wetlands and wetland edges, shrublands, forest, grassland, or open barren. We also did not use stem availability estimates for major rights-of-way (margins) from
Johnston et al. (2019) in our mean because we assumed no common milkweed stems were adjacent major roads within developed areas and because we estimated common milkweed stem availability independently for railway margins and transmission corridors running through developed areas (described below). We acknowledge averaging across developed land cover types may overestimate or underestimate stem availability depending on the relative proportions of land covers present in developed areas in Canada. To assess this possibility, we compared the mean stems per acre from
Johnston et al. (2019) for Chicago across the 14 land cover types listed above with an estimate of mean stem availability adjusted for land cover availability for Chicago. We found these estimates were very similar (0.94 and 0.98 stems/acre, respectively), indicating the averaging of stem availability across developed land cover types is unlikely to have introduced a strong bias into our results. We converted stems per acre to stems per hectare by dividing by 0.405.
We estimated common milkweed stem availability separately for paved and unpaved road margins outside of developed areas (
Table 1). For paved road margins outside developed areas, number of sites occupied was based on data from roadside sites in Minnesota, Iowa, Wisconsin, and South Dakota (
Kasten et al. 2016), area occupied was from sites in Iowa (
Hartzler 2010), and stem densities within common milkweed patches were based on measurements from roadside sites in Southwestern Ontario (
Pitman et al. 2018). We note that the National Road Network Database we used (StatCan 2018; Supplementary Materials: S2. Geo-spatial processing) classified roads as primary, secondary, or unpaved. Following
Thogmartin et al. (2017b), we combined primary and secondary road types into a single land cover type–paved roads. For unpaved road margins, we extracted mean stem availabilities and SEs from
Pleasants (2017), which were based on occupancy rates and area occupied from the “other” category in
Hartzler and Buhler (2000) and an estimate of stems per common milkweed patch from
Flockhart et al. (2015).
We estimated stem availability for rail rights-of-way and transmission rights-of-way separately depending on whether the corridors were found inside or outside of developed areas (
Table 1). For rail and transmission rights-of-way outside developed areas, we followed
Thogmartin et al. (2017b) and used their “low other crop” category for number of sites occupied and area occupied, which was from the “other” category in
Hartzler and Buhler (2000) that contained surveys in rights-of-way outside urban areas. For number of stems per common milkweed patch for rail and transmission rights-of-way outside developed areas, we again used the value reported by
Flockhart et al. (2015), as per
Thogmartin et al. (2017b). For corridors within developed areas, we used the mean estimate and SE reported for the major right-of-way category from
Johnston et al. (2019). We estimated stem availability for waterbody edges, wetland edges, and watercourses using the Conservation Reserve Program category from
Pleasants (2017), which was based on
Hartzler and Buhler (2000) values for waterways and terraces. For shrublands, we followed
Thogmartin et al. (2017b) and used the same value estimated for our “other crops” category.
We derived SEs and confidence intervals (CIs) for all land cover-specific stem density estimates following the methods of
Pleasants (2017) (Supplementary Material 1: S1. Milkweed stem availability estimates: Table S1), except for land cover types from
Johnston et al. (2019) and
Pleasants (2017) who provided SEs for common milkweed density estimates. If the lower CI we derived for a stem density estimate was negative, we set the lower 95% interval to zero (
Table 2).