Exploring the use of the RISK21 approach for Indigenous community-based human health risk assessments: two case studies
Abstract
Introduction
Methods
The RISK21 approach
Case studies
| Case No. | 1 | 2 |
|---|---|---|
| Community name(s) and location | Chipewyan Prairie First Nation and Cold Lake First Nations, Alberta, Canada | Apsáalooke Nation (Crow Tribal community), Montana, USA |
| Case study name | Assessing human health risks from cadmium exposure through moose tissues in the Chipewyan Prairie First Nation and Cold Lake First Nations | Cumulative risk assessment for contaminated well water and the Apsaálooke/Crow Nation, Montana |
| Risk assessment focus | Characterizing risk | Cumulative risk (chemical and non-chemical) |
| Exposure media of focus | Moose meat (kidney, liver, muscle) | Well water |
| Chemicals of interest | Cadmium | Arsenic, manganese, zinc, uranium, nitrate |
| Reference publications | McAuley et al. 2018. Cadmium tissue concentrations in kidney, liver, and muscle in moose (Alces Alces) from First Nations Communities in Northern Alberta. Frontiers in Sustainable Food Systems, 2(69). Available from https://doi.org/10.3389/fsufs.2018.00069. | Eggers et al. 2018. Community engaged cumulative risk assessment of exposure to inorganic well water contaminants, crow reservation, Montana. International Journal of Environmental Research and Public Health, 15(1). https://doi.org/10.3390/ijerph15010076 |
| Chan et al. 2016. First Nations Food, Nutrition and Environment Study (FNFNES): Results from Alberta 2013. University of Ottawa, Ottawa, ON. 2016:155. Available from https://www.fnfnes.ca/docs/FNFNES_Alberta_Regional_Report_ENGLISH_2019-10-09.pdf |
Results
Case study 1—assessing human health risks from cadmium exposure through moose tissues in the Chipewyan Prairie First Nation and Cold Lake First Nations
Step 1: problem formulation
Step 2: assembly of information
Step 3: tiered risk assessment
First assessment—Tier 0 exposure assessment (minimal information)
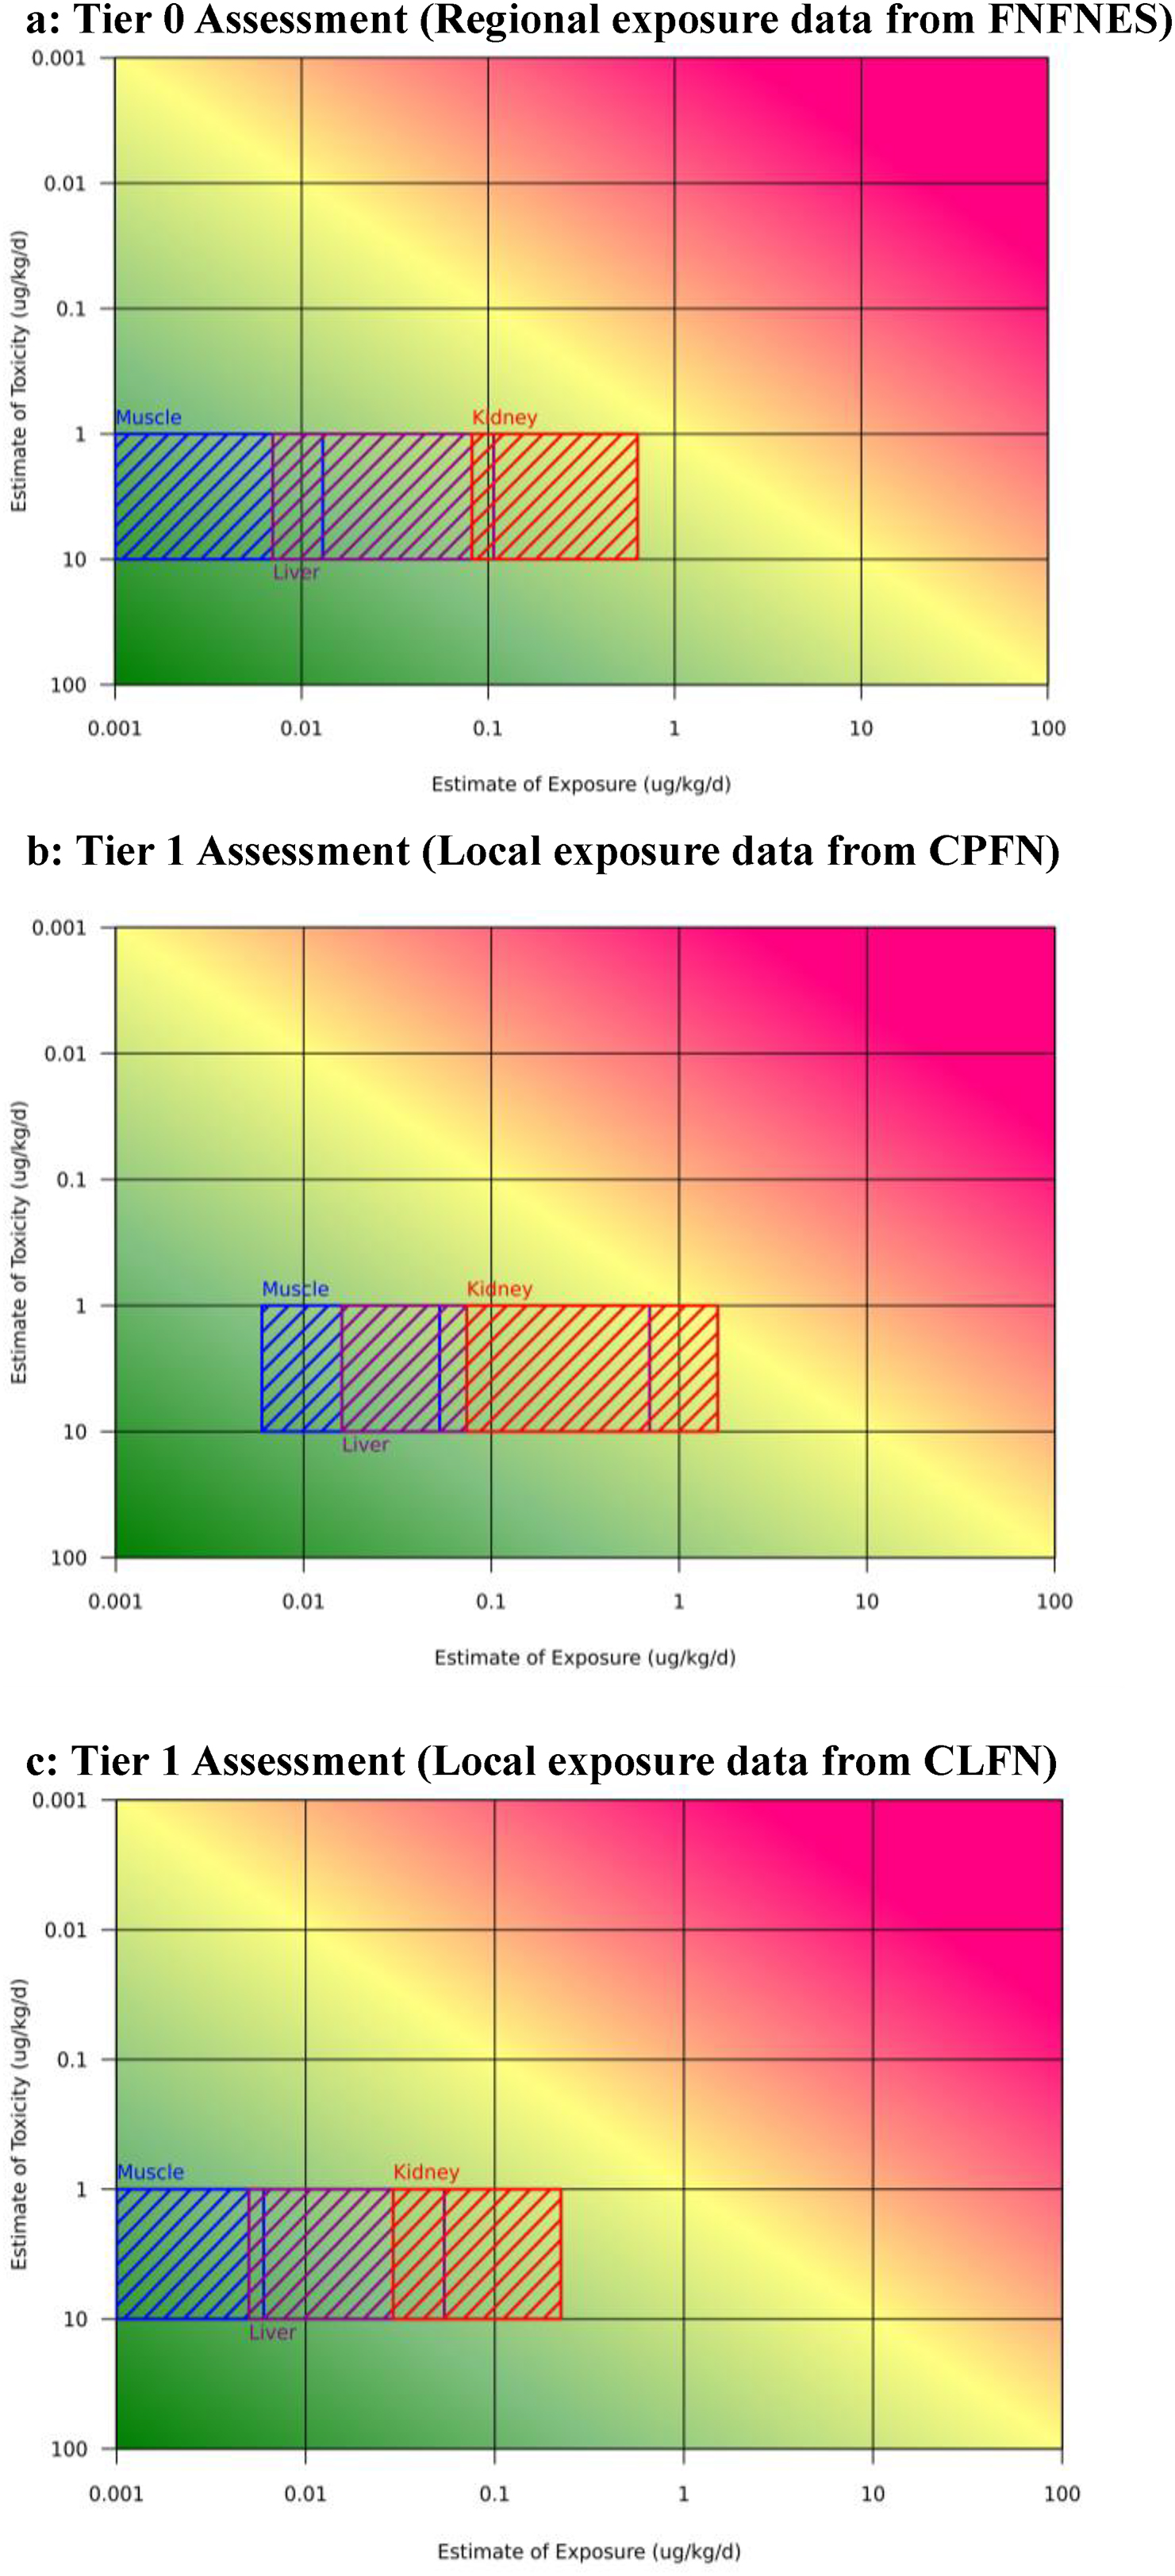
| Tier 0 exposure assessment (minimal information) | Tier 1 exposure assessment (deterministic information) | ||||||
|---|---|---|---|---|---|---|---|
| Regional data (FNFNES) | Chipewyan Prairie First Nation | Cold Lake First Nations | |||||
| Tissue type | Daily moose meat consumption (g/kg/day) | Cadmium concentration in tissues (ug/g) | Total CDI (ug/kg/day) | Cadmium concentration in tissues (ug/g) | Total CDI (ug/kg/day) | Cadmium concentration in Tissues (ug/g) | Total CDI (ug/kg/day) |
| Muscle (avg) | 0.165 | 0.009 | 0.001 | 0.039 | 0.006 | 0.004 | 0.001 |
| Muscle (max) | 0.826 | 0.016 | 0.013 | 0.064 | 0.053 | 0.007 | 0.006 |
| Liver (avg) | 0.006 | 1.161 | 0.007 | 2.582 | 0.016 | 0.860 | 0.005 |
| Liver (max) | 0.028 | 3.78 | 0.107 | 24.5 | 0.697 | 1.900 | 0.054 |
| Kidney (avg) | 0.006 | 13.17 | 0.082 | 11.948 | 0.074 | 4.600 | 0.029 |
| Kidney (max) | 0.020 | 31.1 | 0.633 | 78.9 | 1.607 | 11.000 | 0.224 |
Notes: Daily moose meat consumption values are from the FNFNES report on Alberta (Chan et. al. 2016). Tier 0 uses FNFNES exposure estimate values and regional moose meat contaminant measurements (Chan et al. 2016; McAuley et al. 2018). Tier 1 uses exposure estimates from moose harvested by the Chipewyan Prairie First Nation (CPFN) and Cold Lake First Nations (CLFN) (McAuley et al. 2018). The calculation of exposure estimates used standard human body weight (70.7 kg) measures for an average Canadian recommended by Health Canada (Health Canada, 2019), as used in the original risk assessment by McAuley et al. (2018).
Second assessment—Tier 1 (further investigation of exposure)
Step 4: outcome and conclusions
Case study 2—cumulative risk assessment for contaminated well water and the Apsaálooke/Crow Nation, Montana
Step 1: gatekeeper step
Step 2: problem formulation
Step 3: assembly of information (exposure and toxicity)
| Chemical name | Average exposure (ug/kg/day) | Reference dose (ug/kg/day) | Hazard quotients |
|---|---|---|---|
| Arsenic (As) | 0.034 | 0.3 | 0.114 |
| Manganese (Mn) | 2.914 | 46 | 0.063 |
| Zinc (Zn) | 3.143 | 300 | 0.01 |
| Nitrate (Ni) | 46 | 1600 | 0.029 |
| Uranium (U) | 0.229 | 0.2 | 1.143 |
| SUM (Hazard Index) | 1.356 | ||
Notes: Exposure calculations assume a standard human body weight of 70 kg, and an average well water consumption rate of 2 L/day per the original assessment. The RfDs are from the US EPA IRIS database through US EPA CompTox (https://comptox.epa.gov/dashboard). The right column displays the Hazard Index (HI) method for CRA, which involves summing chemical HQs. Given that the HI is >1, the combined exposure to the chemicals of concern is at a level that poses a human health risk greater than that of individual chemicals. IRIS, Integrated Risk Information System; RfDs, reference doses; CRA, cumulative risk assessment.
| Modulating factor | EXP or TOX | Description | Direction/ magnitude (increase or decrease) |
|---|---|---|---|
| Income | EXP and TOX | Purchasing bottled water and water treatment is an economic hardship for lower-income families; those that can afford bottled water use it for cooking/drinking (Doyle et al. 2018; Eggers et al. 2015, 2018). Lower socio-economic status families have decreased access to healthcare services, increasing toxicity risks (Mitchell 2019). | Increase and decrease (all contaminants) |
| Access to and adequacy of health services | TOX (?) | Lack of adequate health care services leads to inadequate treatment of potential toxic effects of exposures to chemicals in well water (Eggers et al. 2015). | Increase (all) |
| Physical health | EXP | Poor physical health decreases one’s ability to seek out and transport clean water home, reliance on contaminated well water increases (Eggers et al. 2015; Martin et al. 2021). | Increase (all) |
| Environmental health literacy | EXP | 21% of community members surveyed felt confident they understood well stewardship measures to protect well water from contamination (Doyle et al. 2018; Eggers et al. 2018). No significant difference in exposure for “environmentally literate” participants (Eggers et al. 2018). This has been noted in other studies in Indigenous communities (Dellinger et al. 2022). | Unknown |
| Access to information and education | EXP | Reservation members feel they lack access to information about water quality concerns (Martin et al. 2021). No community-based opportunities for homeowners to learn how to take care of wells or plumbing (Martin et al. 2021). | Increase (all) |
| Environmental regulation | EXP | Inadequate environmental enforcement and complex legal and regulatory issues contribute to drinking water disparities (Eggers et al. 2018). Delay in addressing contamination and establishing clean water infrastructure—under-recognition of Local Knowledge as water quality data needed to secure funding, institutionalization of funding boards, intersecting legal responsibilities (state vs. federal), poor environmental enforcement, lack of tribal authority (Doyle et al. 2018). | Increase (all) |
| Diabetes prevalence rates | TOX | Diabetes prevalence double the statewide average. Diabetes increases vulnerability to nephrotoxic effects of U (Eggers et al. 2018; Menke et al. 2016). U in urine increases likelihood of diabetes (Menke et al. 2016). Physicians in the community health center have noticed that people with diabetes are losing kidney function more rapidly (Eggers et al. 2018). Diabetes has also been associated with both Mn (Shan et al. 2016) and As exposures (Rahman et al. 1998; Tseng et al. 2000; Liu et al. 2016). | Increase (U, Mn, As) |
Step 4: using the RISK21 matrix to assess risk
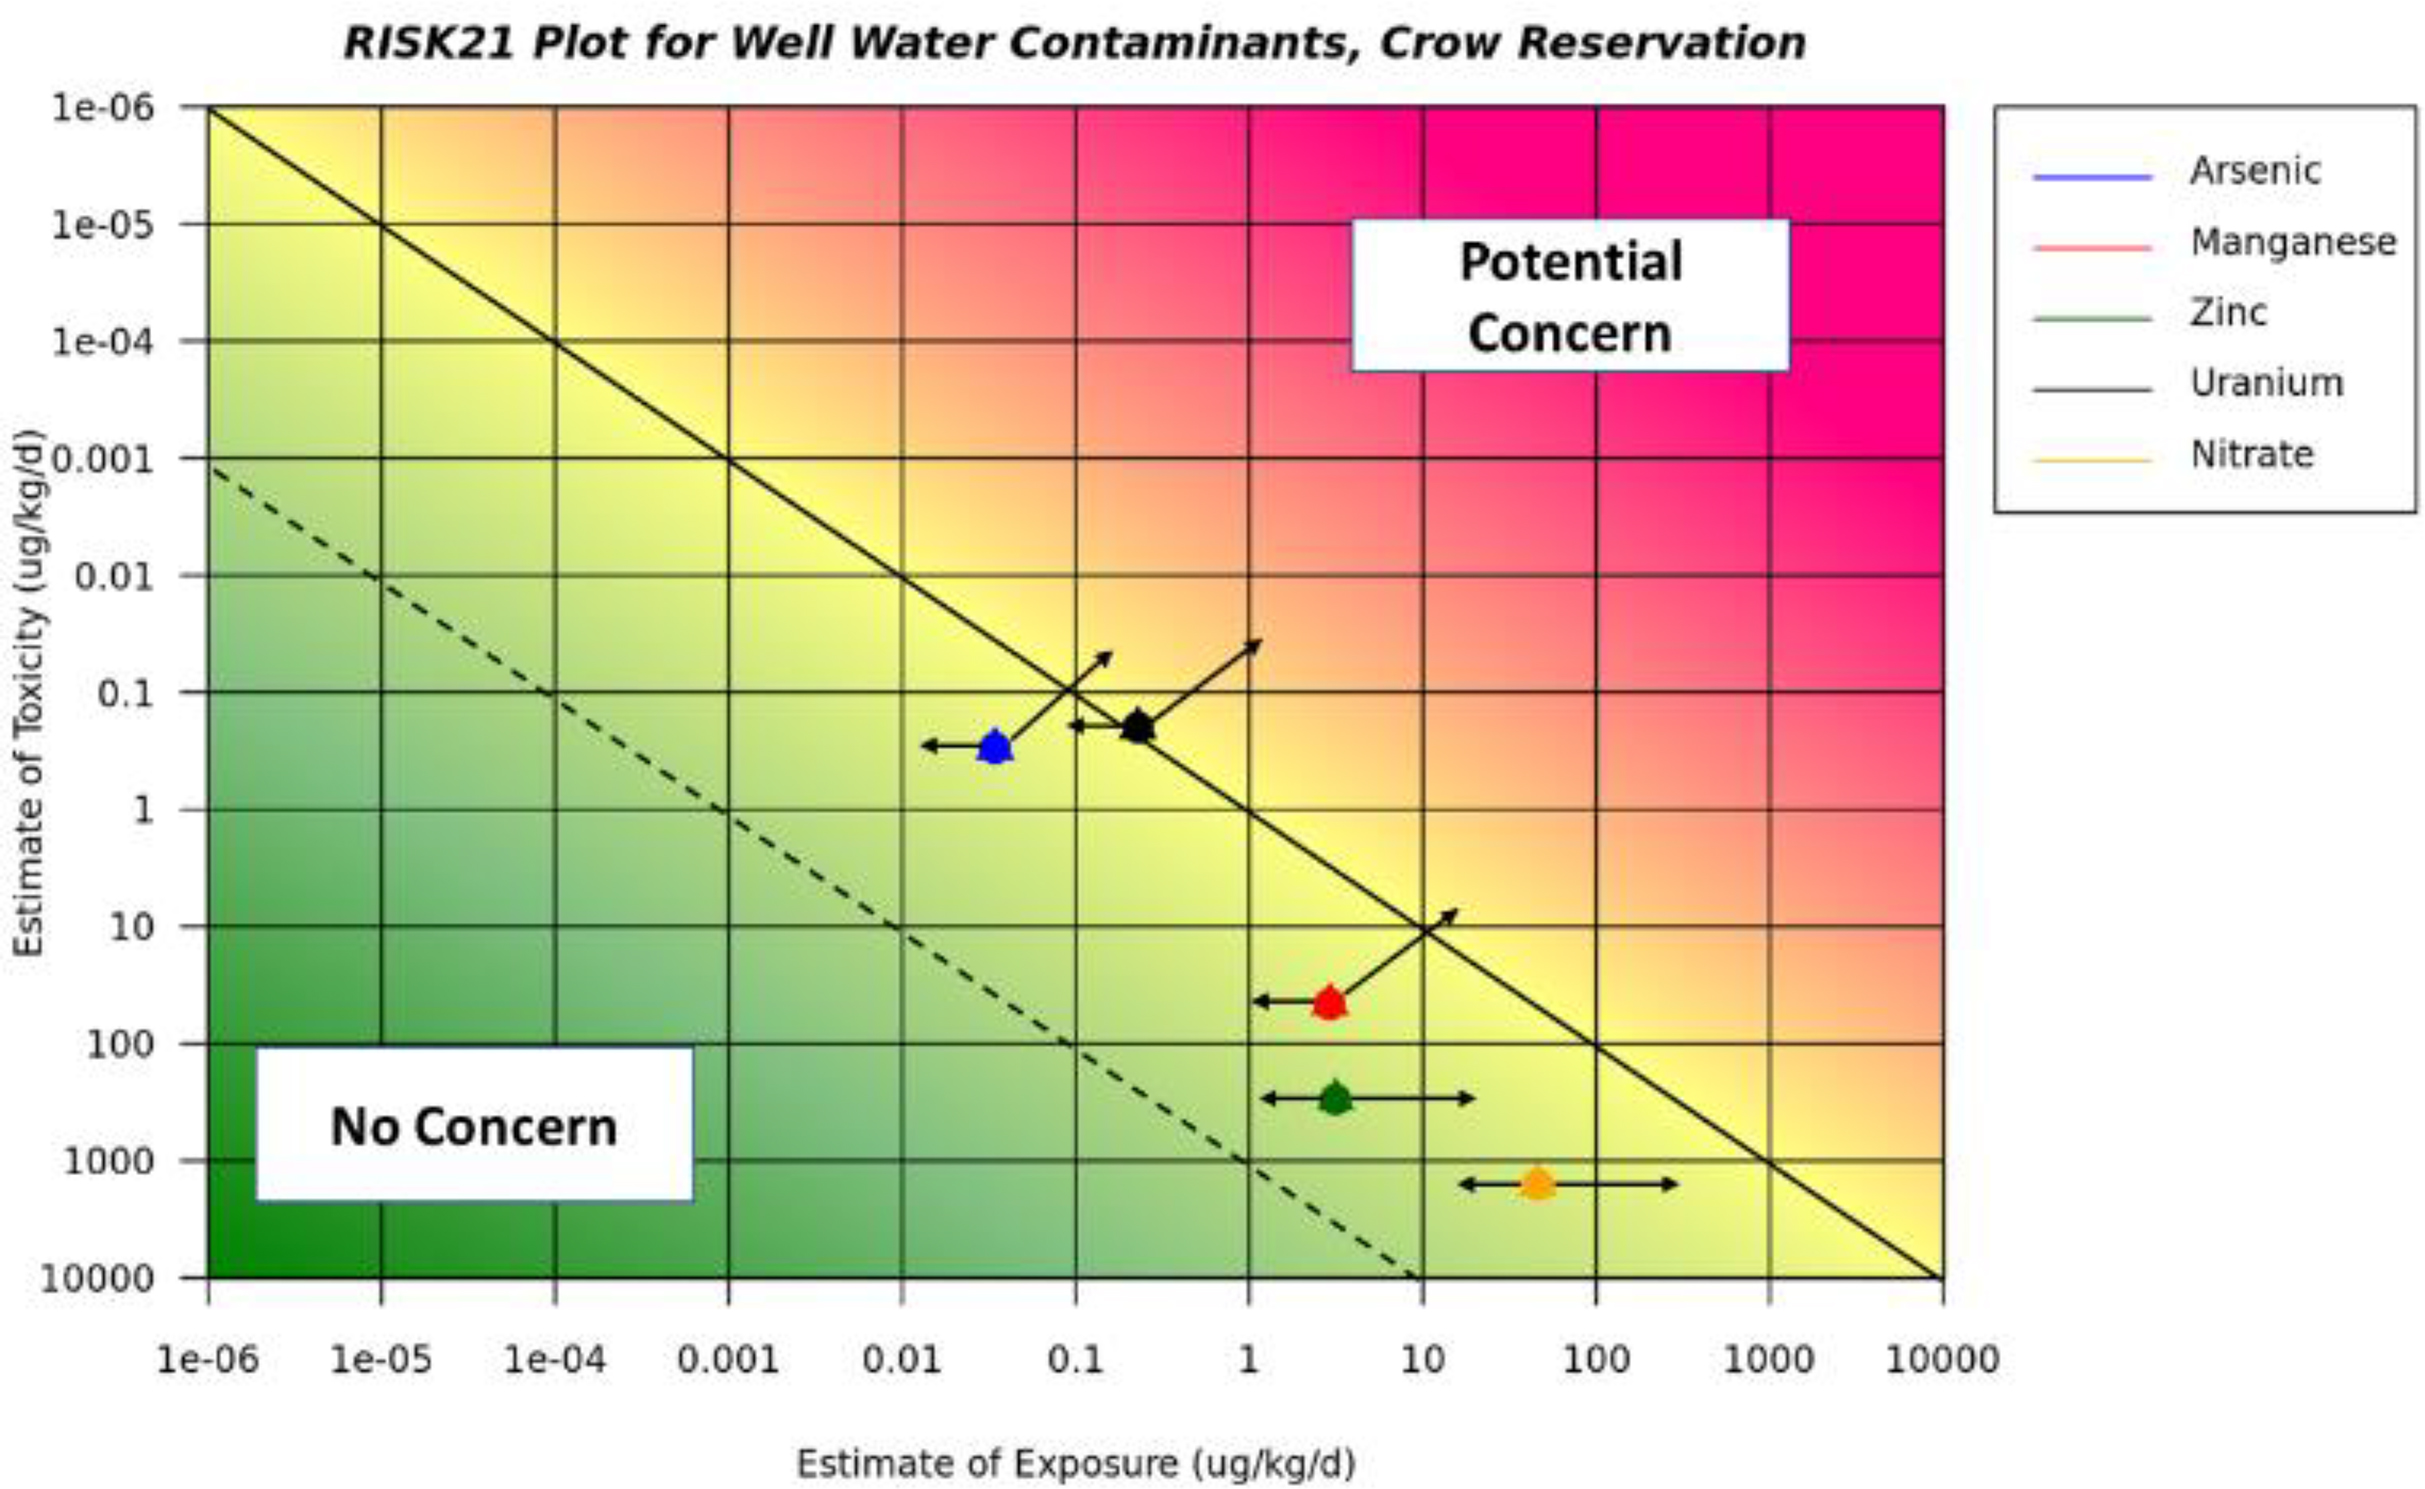
Step 5: outcomes and conclusions
Discussion
Objective 1: conventional versus RISK21-based HHRA
Case study 1
Case study 2
Objective 2: challenges and benefits
Case study 1
Case study 2
Objective 3: potential adaptations and areas for further research
Conclusions
Limitations
Acknowledgements
References
Supplementary material
- Download
- 915.24 KB
Information & Authors
Information
Published In
History
Copyright
Data Availability Statement
Key Words
Sections
Subjects
Plain Language Summary
Authors
Author Contributions
Competing Interests
Funding Information
Metrics & Citations
Metrics
Other Metrics
Citations
Cite As
Export Citations
If you have the appropriate software installed, you can download article citation data to the citation manager of your choice. Simply select your manager software from the list below and click Download.
There are no citations for this item