Pan-Canadian review of community-based monitoring projects and their capacity to enhance environmental monitoring programs for cumulative effects assessments
Abstract
While community-based monitoring (CBM) can support meaningful participation of the public in environmental decision-making, it remains unclear if and how CBM can support western science approaches to biophysical studies within cumulative effects assessment (CEA). We scored 40 Canadian CBM projects on their ability to enhance CEA's western science approaches to environmental monitoring. We used multivariate analyses to determine if the highest-scoring projects shared characteristics that could inform the design of CBMs to support CEA. Cluster analysis and non-metric multi-dimensional scaling ordination revealed that highest-scoring projects were distinct from lower scoring projects, and the Similarity Percentages Routine identified characteristics that differentiated these projects. The highest-scoring projects involved non-profit organizations as bridging organizations that coordinated community participation and received funding and in-kind support from provincial/territorial government agencies. Participants in these projects collected measurements and samples using standardized protocols described in training manuals. Their data were publicly accessible in georeferenced databases and were used for baseline studies and resource management. There are existing CBM projects in Canada that thus appear well positioned to enhance western science approaches to CEA. Further study is required to identify how CBM projects can be designed to braid Indigenous and western science approaches to mutually enhance CEA methods.
Introduction
Cumulative environmental effects are “environmental changes caused by multiple interactions among human activities and natural processes that accumulate across space and time” (CCME 2014). The importance of assessing cumulative environmental effects is increasingly recognized in Canadian environmental assessment processes (Sinclair et al. 2017; Cronmiller and Noble 2018; Impact Assessment Act Canada 2019). Cumulative effect assessments (CEAs) consider cumulative effects from multiple stressors over temporal and spatial scales and retrospective and predictive perspectives (Dubé 2003; Dubé et al. 2006). CEAs’ dual purposes are to generate knowledge of ecosystem conditions and inform sustainable environmental decision-making (Duinker and Greig 2006; Chilima et al. 2013; Jones 2016). Scholars have frequently described Canadian Impact Assessment (IA)—the largest driver of CEA in Canada—as ineffective in supporting sustainable development due to insufficient legislative framework, insufficient baseline data, and insufficient meaningful participation of Indigenous people (Dubé et al. 2006; Duinker and Greig 2006; Noble 2008; Dubé et al. 2013; Jones 2016; Gibson et al. 2020).
From a western science perspective, a key criticism of Canadian impact assessment and CEA methods is the insufficient characterization of baseline conditions. Environmental baseline studies are foundational for IAs and CEAs that require an understanding of current environmental conditions. Unfortunately, environmental baseline studies tend to be short-term and take project-level rather than regional approaches (Johnson et al. 2011; Dubé et al. 2013; Armitage et al. 2019). The typical 1- or 2-year baseline datasets focused on project footprints are inadequate in their characterization of natural variability, and thus predicting the cumulative effects of past, current, and proposed projects is compromised (Dubé et al. 2013; McKay and Johnson 2017a; Armitage et al. 2019). It is well established that longer term and regional-scale baseline data are needed to accurately represent the natural variability and reference conditions of many environmental indicators (Dubé et al. 2013; Foley et al. 2017; Cronmiller and Noble 2018; Armitage et al. 2019). Yet, project proponents typically fulfill only the most basic requirements for project approval; long-term and regional data collection requires leadership and coordination beyond the scope of many individual projects (Duinker and Greig 2006; Seitz et al. 2011; Sheelanere et al. 2013; Foley et al. 2017; Armitage et al. 2019; Noble 2021).
Community-based monitoring (CBM) could help generate the baseline data needed to enhance western science methods within CEA and facilitate meaningful participation of communities in environmental decision-making (Lawe et al. 2005; McKay and Johnson 2017a; Gérin-Lajoie et al. 2018; Wilson et al. 2018; Arsenault et al. 2019). CBM can expand the temporal and spatial scopes of environmental baseline data collection, making monitoring programs more regionally relevant and able to detect change through time (Hunsberger et al. 2005; Lawe et al. 2005; McKay and Johnson 2017a). A review of 388 global CBM projects found CBM projects typically run seven years longer than scientific monitoring projects (Theobald et al. 2015). The long-term datasets collected by CBM projects can therefore better detect unanticipated impacts (McKay and Johnson 2017a; Gérin-Lajoie et al. 2018). CBM's potential contribution to CEA has been considered for individual projects (e.g., Lawe et al. 2005), but not broadly across Canada.
In Canada, CEAs need to consider “scientific information, Indigenous Knowledge, and community knowledge” as described in the Impact Assessment Act (s6(1j) Impact Assessment Act of Canada 2019). CBM projects may be able to draw from all of these knowledge sources, but CBM describes a broad diversity of projects with a wide range of objectives and structures (Theobald et al. 2015; Kanu et al. 2016). Some CBM projects are designed and executed by researchers from outside local communities with objectives that are irrelevant to the community (Danielsen et al. 2008; Kipp et al. 2019), while others are initiated and conducted solely by local communities for their purposes (Danielsen et al. 2008). Meaningful participation in monitoring requires that local communities co-design the CBM project, lead its data collection, and have internal uses for the data (Mahoney et al. 2009; Wilson et al. 2018; Reed et al. 2020). These projects are more likely to empower community members, contribute to decision-making, and be more sustainable over time as they garner greater interest and participation from community members (Kouril et al. 2016; McKay and Johnson 2017a; Parlee et al. 2017). Here, we focus on CBM projects in which the data are primarily collected by community members who may have received training or guidance from professional researchers, and the data are used by either the local community and researchers or just the local community.
We aimed to understand if CBM has the potential to enhance the biophysical baseline studies that inform CEA by elevating the participation of local communities and by collecting datasets that meet western science standards. Our focus on western science methods in CBM is not intended to diminish the critical importance of Indigenous science and knowledge; instead, it reflects our positionality as non-Indigenous scientists. While we believe CBM projects can contribute to “scientific information, Indigenous Knowledge, and community knowledge”, we focus here on the potential western science contributions of CBM to the biophysical components of CEA, as this is our area of expertise and experience. As such, we made no attempts to evaluate the ability of projects to include Indigenous Knowledge, and Indigenous Knowledge was not an attribute in our scoring rubric. We also did not attempt to extrapolate whether Indigenous Knowledge was included in a project and only recorded Indigenous Knowledge as a project characteristic when it was explicitly stated in the project documentation.
Our objectives were to evaluate the ability of CBM projects in Canada to collect biophysical data that could support western science approaches to CEA and what (if any) characteristics these projects shared. We developed a rubric to score the ability of CBM projects to contribute data to biophysical baseline studies for CEAs and determined whether the highest-scoring projects had common characteristics. Identifying shared characteristics could support the intentional design of future CBM projects that intend to contribute western scientific data to CEAs while also empowering communities to lead local decision-making processes.
Materials and methods
We conducted the data collection for this study from February to June 2020.
Community-based monitoring (CBM) project inventory
We generated a master list of CBM projects that monitor environmental variables typically included in environmental assessments (i.e., valued ecosystem components; Supplementary Material 1; Table S1). We included projects from previous inventories (e.g., Sullivan and Beveridge 2005; Parlee et al. 2017; Raygorodetsky and Chetkiewicz 2017; Kipp et al. 2019; Nadeau and Picard 2019). We used a standardized email (Supplementary Material 2) to ask colleagues who work in the field of CBM for assistance in identifying additional CBM projects. We also searched for CBM projects in the grey literature (e.g., Canadian Polar Commission [CPC 2014]; Atlas of Community-Based Monitoring [ACBM 2020]; DataStream [DataStream 2020]; Indigenous Guardians Pilot Program [IGPP 2020]; Northern Contaminants Program [NCP 2020]; and Polar Data Catalogue [CCIN 2017]) and the peer-reviewed literature through Web of Science and Google Scholar. The search terms used were “community-based monitoring” + “environment” + “Canada;” “cumulative effects” + “community-based monitoring”; “participatory monitoring” + “environment” + “Canada”; and “cumulative effects” + “participatory monitoring”. Through these searches, we generated a master list of 317 CBM projects (Fig. 1; Supplementary Material 3; Table S3).
Fig. 1.
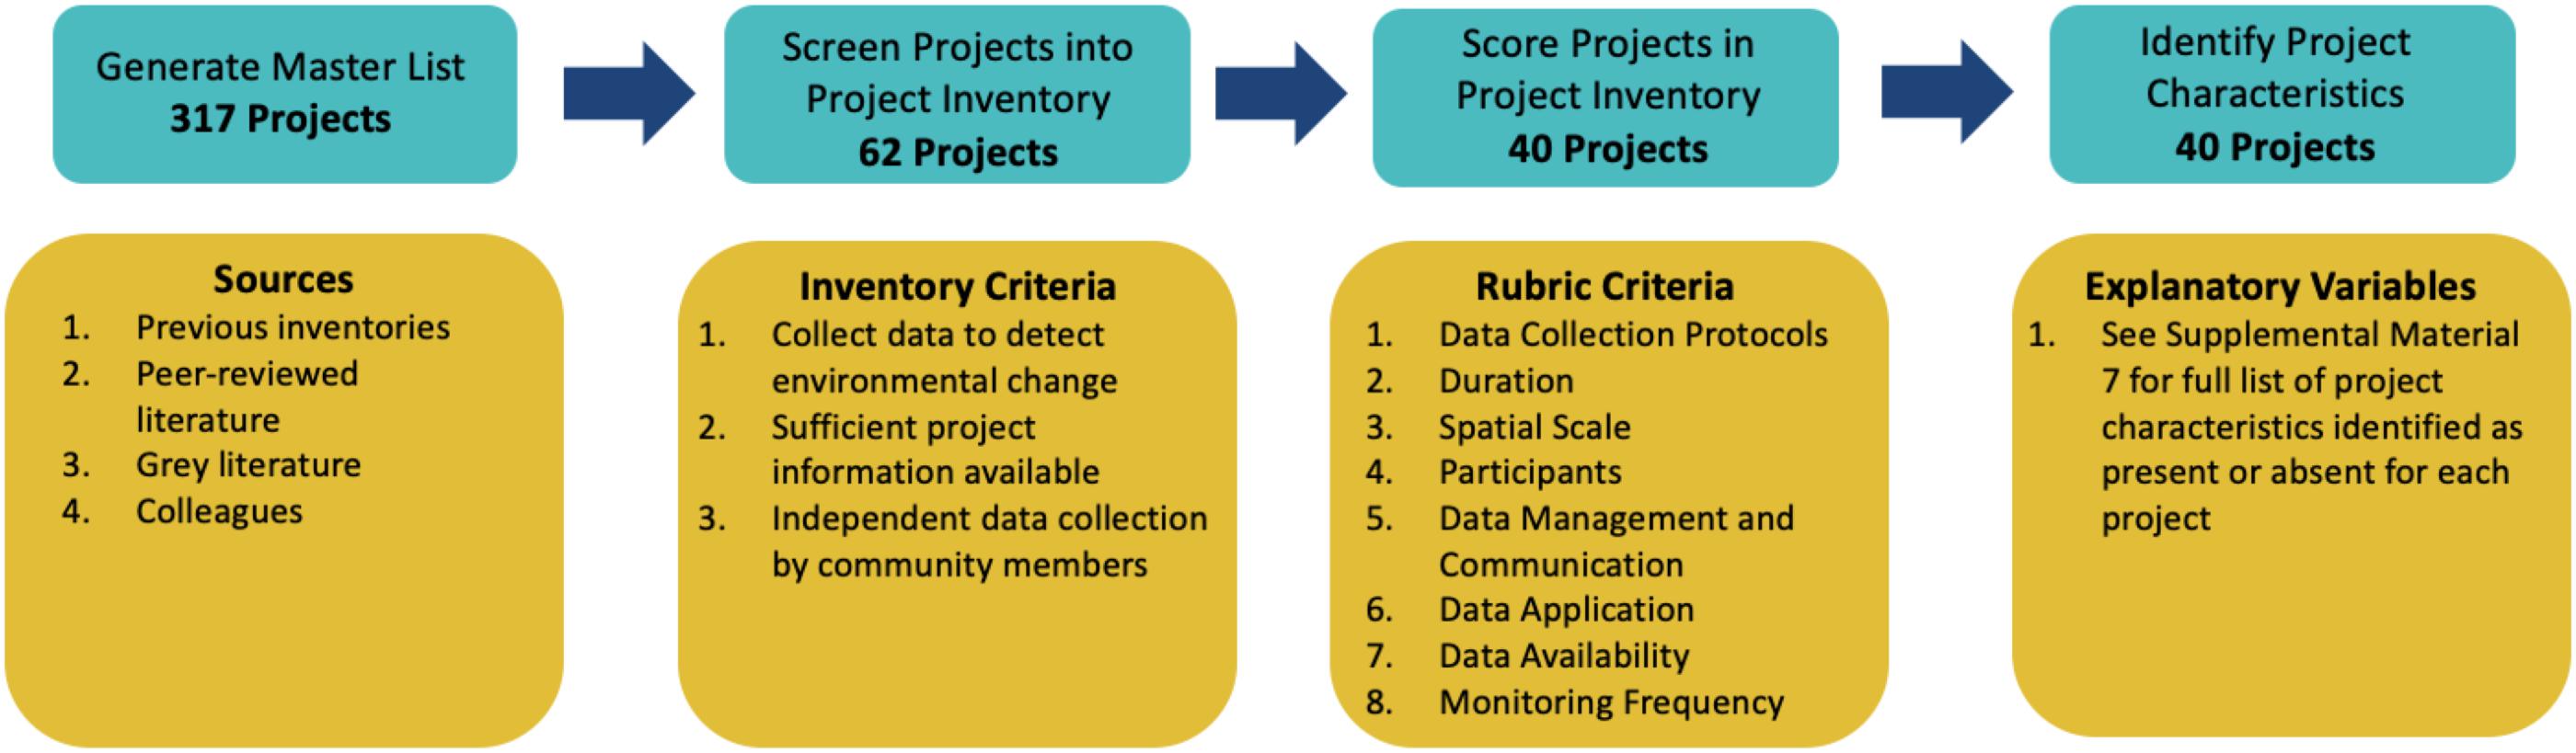
We screened our master list of CBM projects to identify those that met the following criteria: (1) collected data to detect environmental change (i.e., monitored environmental indicators, such as water quality, wildlife abundance, air quality, etc.); (2) sufficient project information was readily available online to allow further assessment (e.g., description of data collection techniques, monitoring location, and project participants); and (3) available information suggested community members collected data independent of researchers. We based this screening on online, project-specific information obtained through Google searches. A review of CBM projects by Kipp et al. (2019) found that many projects are described as community-based, but the extent of community member involvement varied and was often limited. We narrowed our focus to projects that enabled community members to collect monitoring data without the direct supervision of researchers or professional scientists. For this study, we defined CBM projects as projects in which the data are primarily collected by community members who may have received training or guidance from professional researchers, and the data are used by either the local community and researchers or just the local community. We created this definition by merging three categories (3, 4, and 5) of CBM projects defined by Danielsen et al. (2008). For this study, community members encompass local community members who may or may not be paid to collect data or are members of the general public who volunteer their time. Sixty-two CBM projects in the project inventory met our study criteria (Fig. 1; Supplementary Material 4; Table S4).
Project scoring
We developed a scoring rubric to evaluate the ability of CBM projects to collect environmental baseline data that could support western science approaches to regional CEAs. We identified eight project attributes that align with design considerations of environmental baseline studies and which address the need for regional CEAs (Table 1 and Fig. 1; Supplementary Material 5). These eight project attributes were selected and defined based on recommendations for improving CEA baseline studies from the literature and our collective experience in conducting environmental monitoring programs, including CBM projects. As such, these project attributes reflect our experiences with western science methodologies and do not represent an exhaustive list of potentially useful project attributes. We welcome others to modify the scoring rubric, which we have made available in Supplementary Material 5, based on their knowledge and experiences.
Table 1.
| Attribute criteria | Score descriptions |
|---|---|
| Data collection protocols | 1 = No explicit data collection protocol reported or referenced. No indication that a protocol exists for community members |
| 2 = An indication that a protocol exists, but no other details. An indication of protocols includes mention of monitor training but lacks a description of the training | |
| 3 = A protocol clearly exists, and some description of what it entails is provided. This includes statements that monitors are trained to use standardized protocols, including monitoring forms, but the protocol itself is not mentioned or described. Or there is evidence that the protocol has not been consistently used throughout the project | |
| 4 = It is clear that project participants follow a set protocol that is described to repeatedly collect data, but the protocol itself is not available | |
| 5 = Project participants follow a set protocol to repeatedly collect data, and the protocol itself is easily accessible. This includes references to standardized protocols and the source or citation for that protocol | |
| Project duration | 1 = 1–5 years |
| 2 = 6–10 years | |
| 3 = 11–15 years | |
| 4 = 16–20 years | |
| 5 = >20 years | |
| Spatial scale | 1 = <500 km2 |
| 2 = <50 000 km2 | |
| 3 = <50 000 km2 | |
| 4 = <500 000 km2 | |
| 5 = >500 000 km2 | |
| Project participants | 1 = 1 community/organization OR < 10 volunteers |
| 2 = 2–4 communities/organizations | |
| 3 = 5–7 communities/organizations OR < 100 volunteers | |
| 4 = 8–10 communities/organizations | |
| 5 = >10 communities/organizations OR > 100 volunteers | |
| Data management and communication | 1 = No explicit indication that data are managed and stored using any particular technique. An indication that data are stored, but no other details |
| 3 = Where and how data are managed is clear, but it is not clear whether data can or have ever been analyzed. Data may be available through a database but no indication of data analysis and results being communicated through reports or outreach materials. This includes when results are communicated in peer-reviewed publications (i.e., results withheld for publications or theses) | |
| 5 = It is clear that data are analyzed, and results have been communicated in reports or outreach material to the community | |
| Monitoring frequency | 1 = Opportunistic (i.e., inconsistent sampling periods) |
| 2 = Annual (i.e., 1× per year) | |
| 3 = Biannual (i.e., ≥2× per year) | |
| 4 = Seasonal (i.e., ≥4× per year) | |
| 5 = Monthly (i.e., ≥12× per year) | |
| Data application | 1 = No mention of an objective for the data or acknowledgement that decision-makers do not consider the data. |
| 2 = The stated objective is to monitor change, but there is no mention of the decisions that will be informed by this monitoring data (e.g., caribou populations are monitored to document if populations are declining over time). This ranking defines those projects that state the purpose of their data but does not define who is supposed to use the data to make decisions (e.g., We collected water samples to identify phosphorous hotspots. No information is provided as to who will use this information or how identifying phosphorous hotspots will inform decisions) | |
| 3 = The objective of the data is to inform decision-makers, but no details are provided as to how decision-makers will use the data (e.g., caribou populations are monitored to inform the resource management board). This ranking defines projects that state the proposed objective for the data and who the data are meant to be used by, but doesn't provide a clear indication of how that data can be used to inform decisions (just because they send their data to an industrial proponent doesn't mean they consider it) | |
| 4 = Details for how decision makers can use the data and what decisions will be informed by the data are provided (e.g., caribou populations are monitored to the inform resource management board's decision for the number of caribou tags to release each year). This ranking defines projects that clearly describe the objective of the data and how that objective will be fulfilled. So, who uses the data to make decisions, and what decisions do they use the data for? | |
| 5 = Evidence is provided that decision-makers consider the data and have used it to inform decisions (e.g., In 2015, the resource management board reduced the number of caribou tags after reviewing the project data that revealed a sustained downward trend in caribou abundances), or evidence is provided that the data has been incorporated into a decision-making process/framework (e.g., land use and management plans) | |
| Data availability | 1 = No mention of data being available for use by anyone. Also includes projects where the data do not appear to be directly available to the community |
| 2 = Data are available to the community only | |
| 3 = Data are available to the community and project partners, or data are only made available through scientific publications | |
| 4 = Data are available to the public, but only by request, or there is no evidence of the project data being readily available online. Or, the data are publicly available, but the available data are not up-to-date (i.e., publicly available data are older than 2018) | |
| 5 = 2018 and older data are readily available to the public |
Our selected project attributes included the rigour of data collection protocols, the project duration, the project spatial scale, the number of project participants, how well data were managed, sampling frequency, data application, and data availability. We gave each attribute a score between 1 and 5 (i.e., ordinal scale), with 5 indicating that the project had an exceptional ability to contribute environmental baseline data to regional CEAs. Scores were relative, and thus, “lower” scores did not necessarily indicate that a project could not contribute valuable data to baseline studies for regional CEA; instead, these “lower” scores indicate that other projects either offered or demonstrated evidence of greater capacity or complexity for that particular attribute. For example, monitoring an area of 50 000 km2 would yield valuable data for a regional baseline study, whereas monitoring an area of 500 000 km2 could yield valuable data for several regional studies and allow for comparisons among regions of varying levels and types of human activities that could offer greater insights into cumulative effects. While CBM projects that monitor larger areas do not necessarily collect more robust data, the capacity to monitor larger areas suggests the ability to overcome the greater logistical complexities of monitoring larger areas, which would be very valuable to learn from when considering the design of future CBMs for CEA.
We defined the score categories according to numerical ranges identified during the initial project search or possible options based on project descriptions. We then assigned the cumulative attribute score for each project to one of four score categories based on quartiles: Quartile 1 (project score ≤ 25th percentile), Quartile 2 (project score ≤ 50th percentile and >25th percentile), Quartile 3 (project score ≤75th percentile and >50th percentile), or Quartile 4 (project score > 75th percentile). Projects with higher scores (e.g., Quartile 4 > 3 > 2 > 1) can be interpreted as having a relatively greater ability to contribute environmental baseline data to regional CEAs, based on the information we were able to gather. Below is our rationale for selected project attributes presented in Table 1, where the scores are defined.
Data collection protocols
This criterion scored the projects based on whether standardized data collection protocols (i.e., a consistent approach to data collection) were consistently used and reported. Data collection methods should follow standardized protocols to collect defensible data that can inform western science approaches to environmental monitoring and decision-making (Hunsberger et al. 2005; Conrad and Daoust 2008; Kouril et al. 2016; McKay and Johnson 2017a; Herman-Mercer et al. 2018). Standardized monitoring methods are essential for CEA to know which datasets can be compared across space and time for regional assessments (Miller et al. 2022). Successful project-level and regional CEA integration requires standardized long-term monitoring methods (Dubé et al. 2006; Foley et al. 2017; Armitage et al. 2019). McKay and Johnson (2017a) found that government and industry representatives believed the effectiveness of CBM projects depended on “rigorous, robust, and defensible methods”. Furthermore, standardized monitoring approaches facilitate earlier detection of environmental effects and can improve adaptive management (Roach and Walker 2017).
Project duration
This criterion defines the number of years the project has been collecting monitoring data. Cumulative effects monitoring, assessment, and management are long-term processes (Hegmann et al. 1999; ECCC 2016). Long-term monitoring data are needed to inform robust baseline studies that better define natural variability, identify deviations from that variability, and produce more accurate impact prediction models (Duinker and Greig 2006; Dubé et al. 2013; ECCC 2016; Roach and Walker 2017). Long-term monitoring before and after developments also helps identify when and where mitigative measures are needed and supports adaptive management (Duinker and Greig 2006; Dubé et al. 2013; ECCC 2016; Roach and Walker 2017). The duration of a CBM project is also an indicator of its success in holding the interest of participants and funding agencies.
The total number of years did not include the time during which the project was designed or any years when the project was on hold (i.e., we only included years when data were collected in the total duration calculation). We did not include 2020 in the duration calculation for ongoing projects, as the sampling period for all projects would not have occurred by the time we completed our study. The duration of projects in the inventory ranged from 1 to 29 years, with a median of 8 years. We used data from an initial project inventory to generate a typical range of project duration. We divided this range into four equal-sized categories, with an additional category representing exceptionally long projects.
Spatial scale
This criterion scored the project based on the project's reported study area size. Scholars widely agree that effective CEA requires a regional approach (Dubé et al. 2006; Duinker and Greig 2006; Noble 2008; Johnson et al. 2011; Chilima et al. 2013; Dubé et al. 2013; Jones 2016; Foley et al. 2017; Armitage et al. 2019; Gibson et al. 2020). Thus, it is important to identify projects monitoring at large enough spatial scales to contribute to regional CEA. CBM projects that monitor larger spatial scales also demonstrate greater logistical complexity in coordinating monitoring efforts across a larger area.
For projects that monitored harvesting data and did not define a study area size, we estimated a 100 km radius (i.e., 31 416 km2) for each community that participated. The size of study areas monitored by the projects in the inventory ranged from 5 to 1 100 000 km2, with a median of 3939 km2.
Project participants
Cumulative effects monitoring, assessment, and management require coordination of activities among multiple participants (ECCC 2016). CBM projects demonstrating coordination success, particularly the capacity to coordinate numerous communities, are valuable models. This criterion scored the projects based on the number of communities or non-profit groups that routinely participated in the project and was meant to help understand the scope of the logistics and coordination required to operate the project. This criterion was also meant to reflect how many communities/groups can be expected to be involved in one project. We scored some projects based on their number of volunteers because the number of communities or non-profit groups was not provided.
The number of communities or non-profit organizations participating in projects in the inventory ranged from 1 to 35, with a median of 2. We used data from an initial project inventory to generate a typical range of community participants. We used this range to define three equal-sized categories above 1, with an additional category representing abnormally large participant numbers.
Data management and communication
This criterion scored the projects based on data management and protocols that clearly articulated data handling and management procedures for analysis and regularly communicated results. Data management is critical to effective cumulative effects monitoring (ECCC 2016). Data management systems can improve the integrity of monitoring projects and facilitate effective communication of data to partners, rightsholders, stakeholders, and the public. Data management systems and communication are also essential when data from cumulative effects monitoring are used to develop management actions or responses (ECCC 2016; McKay and Johnson 2017a; Kipp et al. 2019). The score categories were confined to three scores, as we found only three explicit variations in data management.
Monitoring frequency
This score was based on the frequency of data collection for the indicators routinely monitored by the project. If project-specific frequencies varied among indicators or variables, we used the most frequent sampling for the scoring. We used this scoring criterion to understand if data collection protocols included consistent data collection and if the data could capture temporal variability. In addition, this criterion helped identify projects that required greater involvement and commitment by project coordinators and participants throughout the year (i.e., does the project only operate during one month of the year, or does sampling occur throughout the year?).
Some monitoring parameters only need to be sampled annually; however, monthly monitoring is recommended for other variables to understand seasonal variability clearly. As such, programs demonstrating the capacity to collect monitoring data throughout the year are particularly valuable and applicable to CEA. One of the purported benefits of CBM is more robust datasets that include data collected throughout the year (Gérin-Lajoie et al. 2018). Regardless of timing, samples should be repeatedly collected during specific times of the year to allow robust trend analysis (Carlsson et al. 2015).
Data application
The purpose of this criterion was to rank the projects based on whether the data were used to inform decisions. Cumulative effects data are meant to be used in environmental policy, management, and decision-making (ECCC 2016). The hope for CBM is that decision-makers will respect and use the data to inform decisions (Theobald et al. 2015; McKay and Johnson 2017a). Some view CBM as an avenue for communicating with communities, while others see it as a data source to inform decisions (Kanu et al. 2016; McKay and Johnson 2017a). Hence, it is important to identify whether the data were actually used to inform decisions. For example, the Indigenous Observation Network's data directly informed the Yukon River Watershed Plan (LLC 2020), so it received a data application score of 5.
Data availability
This scoring criterion was meant to define the availability of data in a form that can be analyzed and interpreted by those not directly associated with the project (e.g., project databases or technical reports that present data tables). Effective regional CEA requires project-level and regional monitoring data to be available to government agencies, project proponents, rightsholders, and stakeholders across the region (Johnson et al. 2011; Ball et al. 2013; Dubé et al. 2013; Sheelanere et al. 2013; Foley et al. 2017; Miller et al. 2022). ECCC (2016) describes the importance of publicly sharing cumulative effects data for management actions and decision-making. Effective data communication is especially critical when data are meant to be used to develop management actions or responses (Moyer et al. 2008; ECCC 2016; Kipp et al. 2019).
Project characterization
To explore whether high-scoring projects shared distinct characteristics, we identified an a priori suite of project characteristics (i.e., explanatory variables) that we hypothesized would influence project scores (Table 2). We selected project characteristics based on key variables identified in the literature and our own experiences (Supplementary Material 6). We treated characteristics as binary explanatory variables depending on whether the characteristic was present or absent, as explicitly reported in the publicly available project information.
Table 2.
| Category | Sub-category | Category | Sub-category |
|---|---|---|---|
| Land claim structure | Unceded | Data objective | Baseline |
| Modern land claim | Cumulative environmental effects | ||
| Pre-1975 title treaty | Industrial compliance | ||
| Peace and friendship treaty | Environmental conservation | ||
| Treaty/harvesting rights | |||
| Data collection methods | Interview | Research | |
| Observations | Resource management | ||
| Measurements | Human health and safety | ||
| Sample collection | Data communication | Online database | |
| Paid monitors | Yes/No | Online georeferenced database | |
| Indigenous Knowledge | Yes/No | Conferences | |
| Routine training frequency | Yes/No | Peer-reviewed publications | |
| Routine reports | |||
| Trainer | Federal government | Non-routine reports | |
| Provincial/territorial government | Community outreach materials | ||
| Indigenous/regional/municipal government | Data collection technology | App/Software | |
| Co-management/local resource Management | Data recording device | ||
| Community members | Data management technology | Project-specific database | |
| Academic | Third-party database | ||
| Consultant | Funding sources | National (non-Canadian) government | |
| Non-profit | Federal Government | ||
| Project alumni | Provincial/territorial government | ||
| Training techniques | Training manual | Indigenous/Regional/Municipal Government | |
| Training video | Crown Corporation | ||
| Remote presentation | Co-management/local resource management | ||
| Online course | Community | ||
| Field training | Industry | ||
| Land camps | Academic | ||
| Classroom | Non-profit | ||
| Intergenerational engagement | Elder engagement | Project partners | See Funding sources |
| Youth engagement | Bridging organization | Yes/No | |
| Community involvement | Project design | ||
| Data management | |||
| Data analysis and interpretation | |||
| Data reporting |
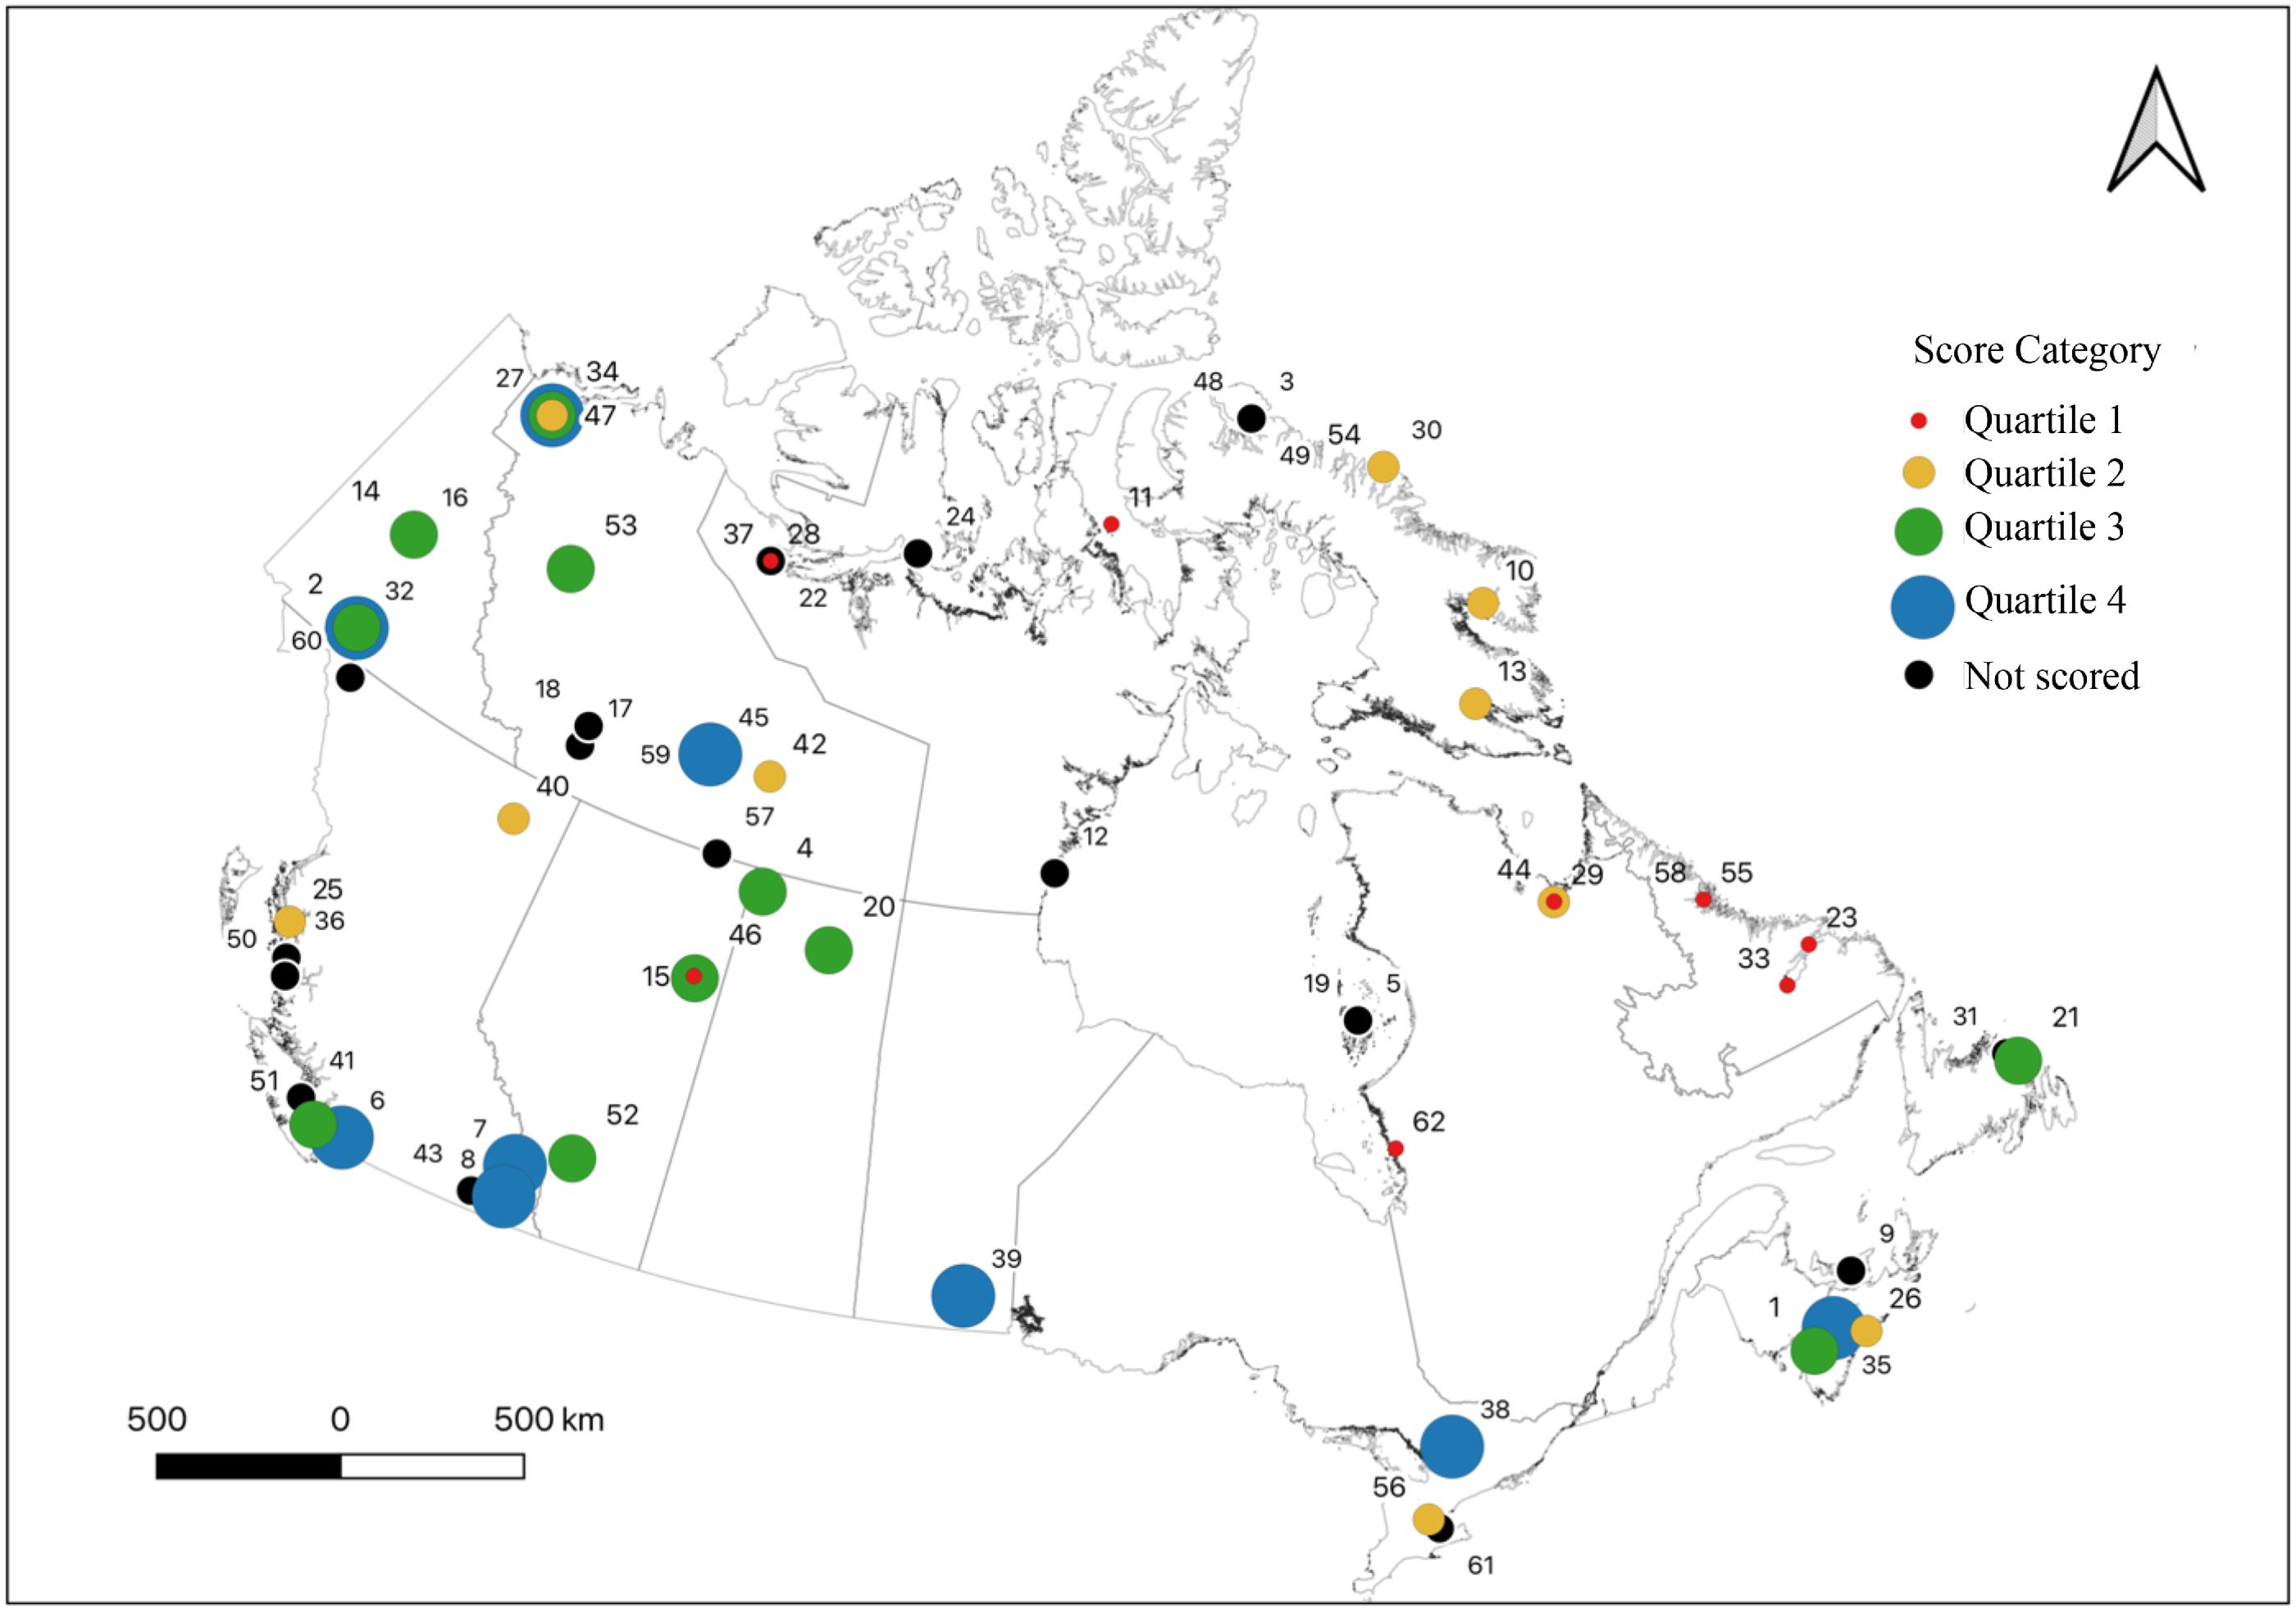
We scored and characterized 40 randomly selected projects from the 62 projects in the CBM Project Inventory (Fig. 1). The majority (58%) of the 62 projects monitored study areas in northern Canada (Nunavut [NU], Yukon Territory [YT], Northwest Territories [NT], Nunavik, and Nunatsiavut; Fig. 2). To achieve a reasonable representation of projects across Canada, we randomly sampled up to six projects from each province, territory, or northern region (i.e., Nunavik and Nunatsiavut). This criterion ensured we would select at least ten projects from the southern Canadian jurisdictions (British Columbia [BC], Alberta [AB], Saskatchewan [SK], Manitoba [MN], Ontario [ON], Quebec [QC; outside Nunavik], New Brunswick [NB], Nova Scotia [NS], Prince Edward Island [PE], and Newfoundland and Labrador [NL; outside Nunatsiavut]).
Fig. 2.
We only used publicly available information to score and characterize each project. If the available project information did not report sufficient detail to assign a score for any criterion, we classified the project as having insufficient information, and another project was randomly selected from the inventory. Seven of the projects we randomly selected from the inventory we found had insufficient project information. We included scoring rationales as comments in the spreadsheet that we cross-referenced with the rubric description before analysis (Supplementary Material 7; Table S7).
Cross-validation
We undertook two rounds of cross-validation to ensure that our rubric scoring was reproducible (Supplementary Material 8). The reproducibility of our rubric was critical to ensuring reviewer bias did not influence project scoring and that scoring methods were transparent enough to allow others to iterate on them in the future. We encourage others to adapt and refine our rubric and improve its accuracy with new information.
Three authors individually evaluated 10 projects using the same project information and following the instructions in the rubric (data dictionary; Supplementary Material 7). We held discussions to identify the cause of all disagreements in project scores and updated the rubric to reduce inconsistency. We then completed a second cross-validation using the updated rubric. We calculated interrater agreement (i.e., Krippendorff's alpha coefficient [α]) for each project attribute and characteristic following the methods described in Roche et al. (2015). Cicchetti (1994) suggests that α values <0.4 indicate poor agreement. We carefully evaluated the potential causes of the low interrater agreement for any attribute or characteristic with a score <0.4. We agreed to data dictionary changes, often combinations of categories, that would further improve the interrater agreement score. All remaining project attributes and characteristics had an interrater agreement of ≥0.4, which we interpreted as an indication that our rubric was sufficiently reproducible to move forward.
Data analysis
We used unconstrained ordination to evaluate if projects within the same score category were grouped based on a common set of project characteristics. We generated a Bray–Curtis similarity matrix (composed of similarities calculated between each pair of projects) as the basis for the multivariate analyses. We performed a hierarchical agglomerative cluster analysis using a group average linkage to determine if the score categories were separated into the same clusters based on common project characteristics. We assigned the score category (e.g., Quartile 1, Quartile 2) as a label in the cluster analysis to visualize if groupings were associated with the a priori categories. We used a similarity profile (SIMPROF) test to identify which groups produced by the cluster analysis were meaningful (Clarke et al. 2014). We set the significance of the SIMPROF test at 5% and permutations at 9999.
We used non-metric multi-dimensional scaling (nMDS) ordination to portray the differences between score categories to evaluate if score categories contained unique suites of project characteristics. We displayed the ten project characteristics that had the most significant influence on dissimilarity calculations between score categories on a vector plot adjacent to the nMDS ordination. We used the similarity percentages routine (SIMPER) to assess which project characteristics influenced dissimilarities between score categories and similarities within score categories. We used PRIMER version 7® software to complete all analyses.
Results and discussion
The cumulative effects of climate change and human development continue to exacerbate environmental degradation and threaten environmental sustainability. Canada needs to improve CEA methodology to secure ecosystem sustainability for future generations (Seitz et al. 2011; Ball et al. 2013; Sheelanere et al. 2013; Cronmiller and Noble 2018). CEAs should consider scientific information, Indigenous Knowledge, and community knowledge. While it is likely that CBM could contribute to all these components of CEAs, here we explored the degree to which current CBM projects appear prepared to contribute to the western science component of CEA biophysical baseline studies. Our objectives were to evaluate the ability of CBM projects in Canada to collect environmental data that could support western science approaches to CEA and what (if any) characteristics high-scoring CBM projects shared to inform the design of future CBM projects (Hunsberger et al. 2005; Lawe et al. 2005; McKay and Johnson 2017a; Gérin-Lajoie et al. 2018). We found that higher scoring projects shared common characteristics (Table 3) that we propose should be considered when designing future CBM projects with the objective of supporting CEA.
Table 3.
| Project characteristic | Average abundance | Contribution to similarity (%) | Cumulative contribution (%) |
|---|---|---|---|
| Non-profit partner | 0.89 | 8.74 | 8.74 |
| Data objective—resource management | 0.89 | 8.48 | 17.22 |
| Provincial/territorial funding | 0.78 | 6.51 | 23.73 |
| Bridging organization | 0.78 | 6.43 | 30.16 |
| Measurements for data collection | 0.78 | 6.41 | 36.57 |
| Training manual | 0.78 | 6.20 | 42.77 |
| Provincial/territorial partner | 0.78 | 6.20 | 48.97 |
| Geo-referenced database | 0.67 | 4.61 | 53.58 |
| Data objective—baseline | 0.67 | 4.45 | 58.03 |
| Sample collection | 0.67 | 4.36 | 62.39 |
| Routine reports | 0.56 | 3.23 | 65.62 |
| Pre-1975 Title Treaty Land Claim | 0.56 | 3.18 | 68.79 |
| Project-specific database | 0.56 | 3.13 | 71.92 |
Note: See methods for score category definitions.
Our evaluation of current CBM projects is novel in that we employ qualitative, semiquantitative, and quantitative components and decisions. We hope this approach catalyzes more efficient design and deployment of future CBM projects. Previous work that reviewed and assessed CBM project information used surveys, interviews, and content analyses to collect project information and presented tables and case studies to summarize key project attributes (e.g., Danielsen et al. 2005; Conrad and Daoust 2008; Gofman 2010; Johnson et al. 2016; Kouril et al. 2016; Parlee et al. 2017; Raygorodetsky and Chetkiewicz 2017; McKay and Johnson 2017b; Kipp et al. 2019). These previous approaches identified common characteristics among CBM projects and discovered from practitioners which attributes contribute to project success and sustainability. While our goal was similar to these previous studies, we assessed if higher-scoring projects shared common characteristics using multivariate statistical analyses applied to a scoring rubric. We took this approach because (i) developers of policies and practices often prefer quantitative evidence in the design of western science (including CBM) projects and (ii) it facilitates future iterations, comparisons across iterations, and improvements on our methods. In the future, the collation of CBM project information could be expanded by requesting further information from CBM project managers, further cross-validation and modification of scoring criteria and project characteristics, and adding additional CBM projects to these lists. The project scoring spreadsheet, data dictionary, and PDFs of all project information used to inform this analysis are available as Supplementary material. Thus, the evaluations made here are presented in a transparent format and can be reassessed, adapted, and corrected at any time. In addition, others looking to achieve a different objective (e.g., answer a different question) can use our project list as a snapshot of CBM projects in Canada and develop new approaches for project evaluations.
Our analysis had an unavoidable circularity (i.e., we used the same information to score the projects and identify the presence of explanatory variables). We scored projects based on publicly available documentation. We then used this same documentation to determine whether there were any shared characteristics among score categories. We separated project characteristics from project scoring as much as possible in our rubric. Nonetheless, it is important to highlight that our analysis identifies suites of commonly shared CBM project characteristics rather than directional relationships between characteristics and scores. It may be useful to identify common associations, for example, the use of a bridging organization and the conduct of CBM with a larger number of communities and participants, but understanding the causality of these associations would require further research. The scope of this analysis (i.e., 317 potential projects screened; 40 projects scored and evaluated in detail) necessitated a focus on generally available documentation and associations between practices and characteristics. This focus may have disproportionately affected our understanding of small-scale, locally focused projects, especially those that focused on Indigenous Knowledge.
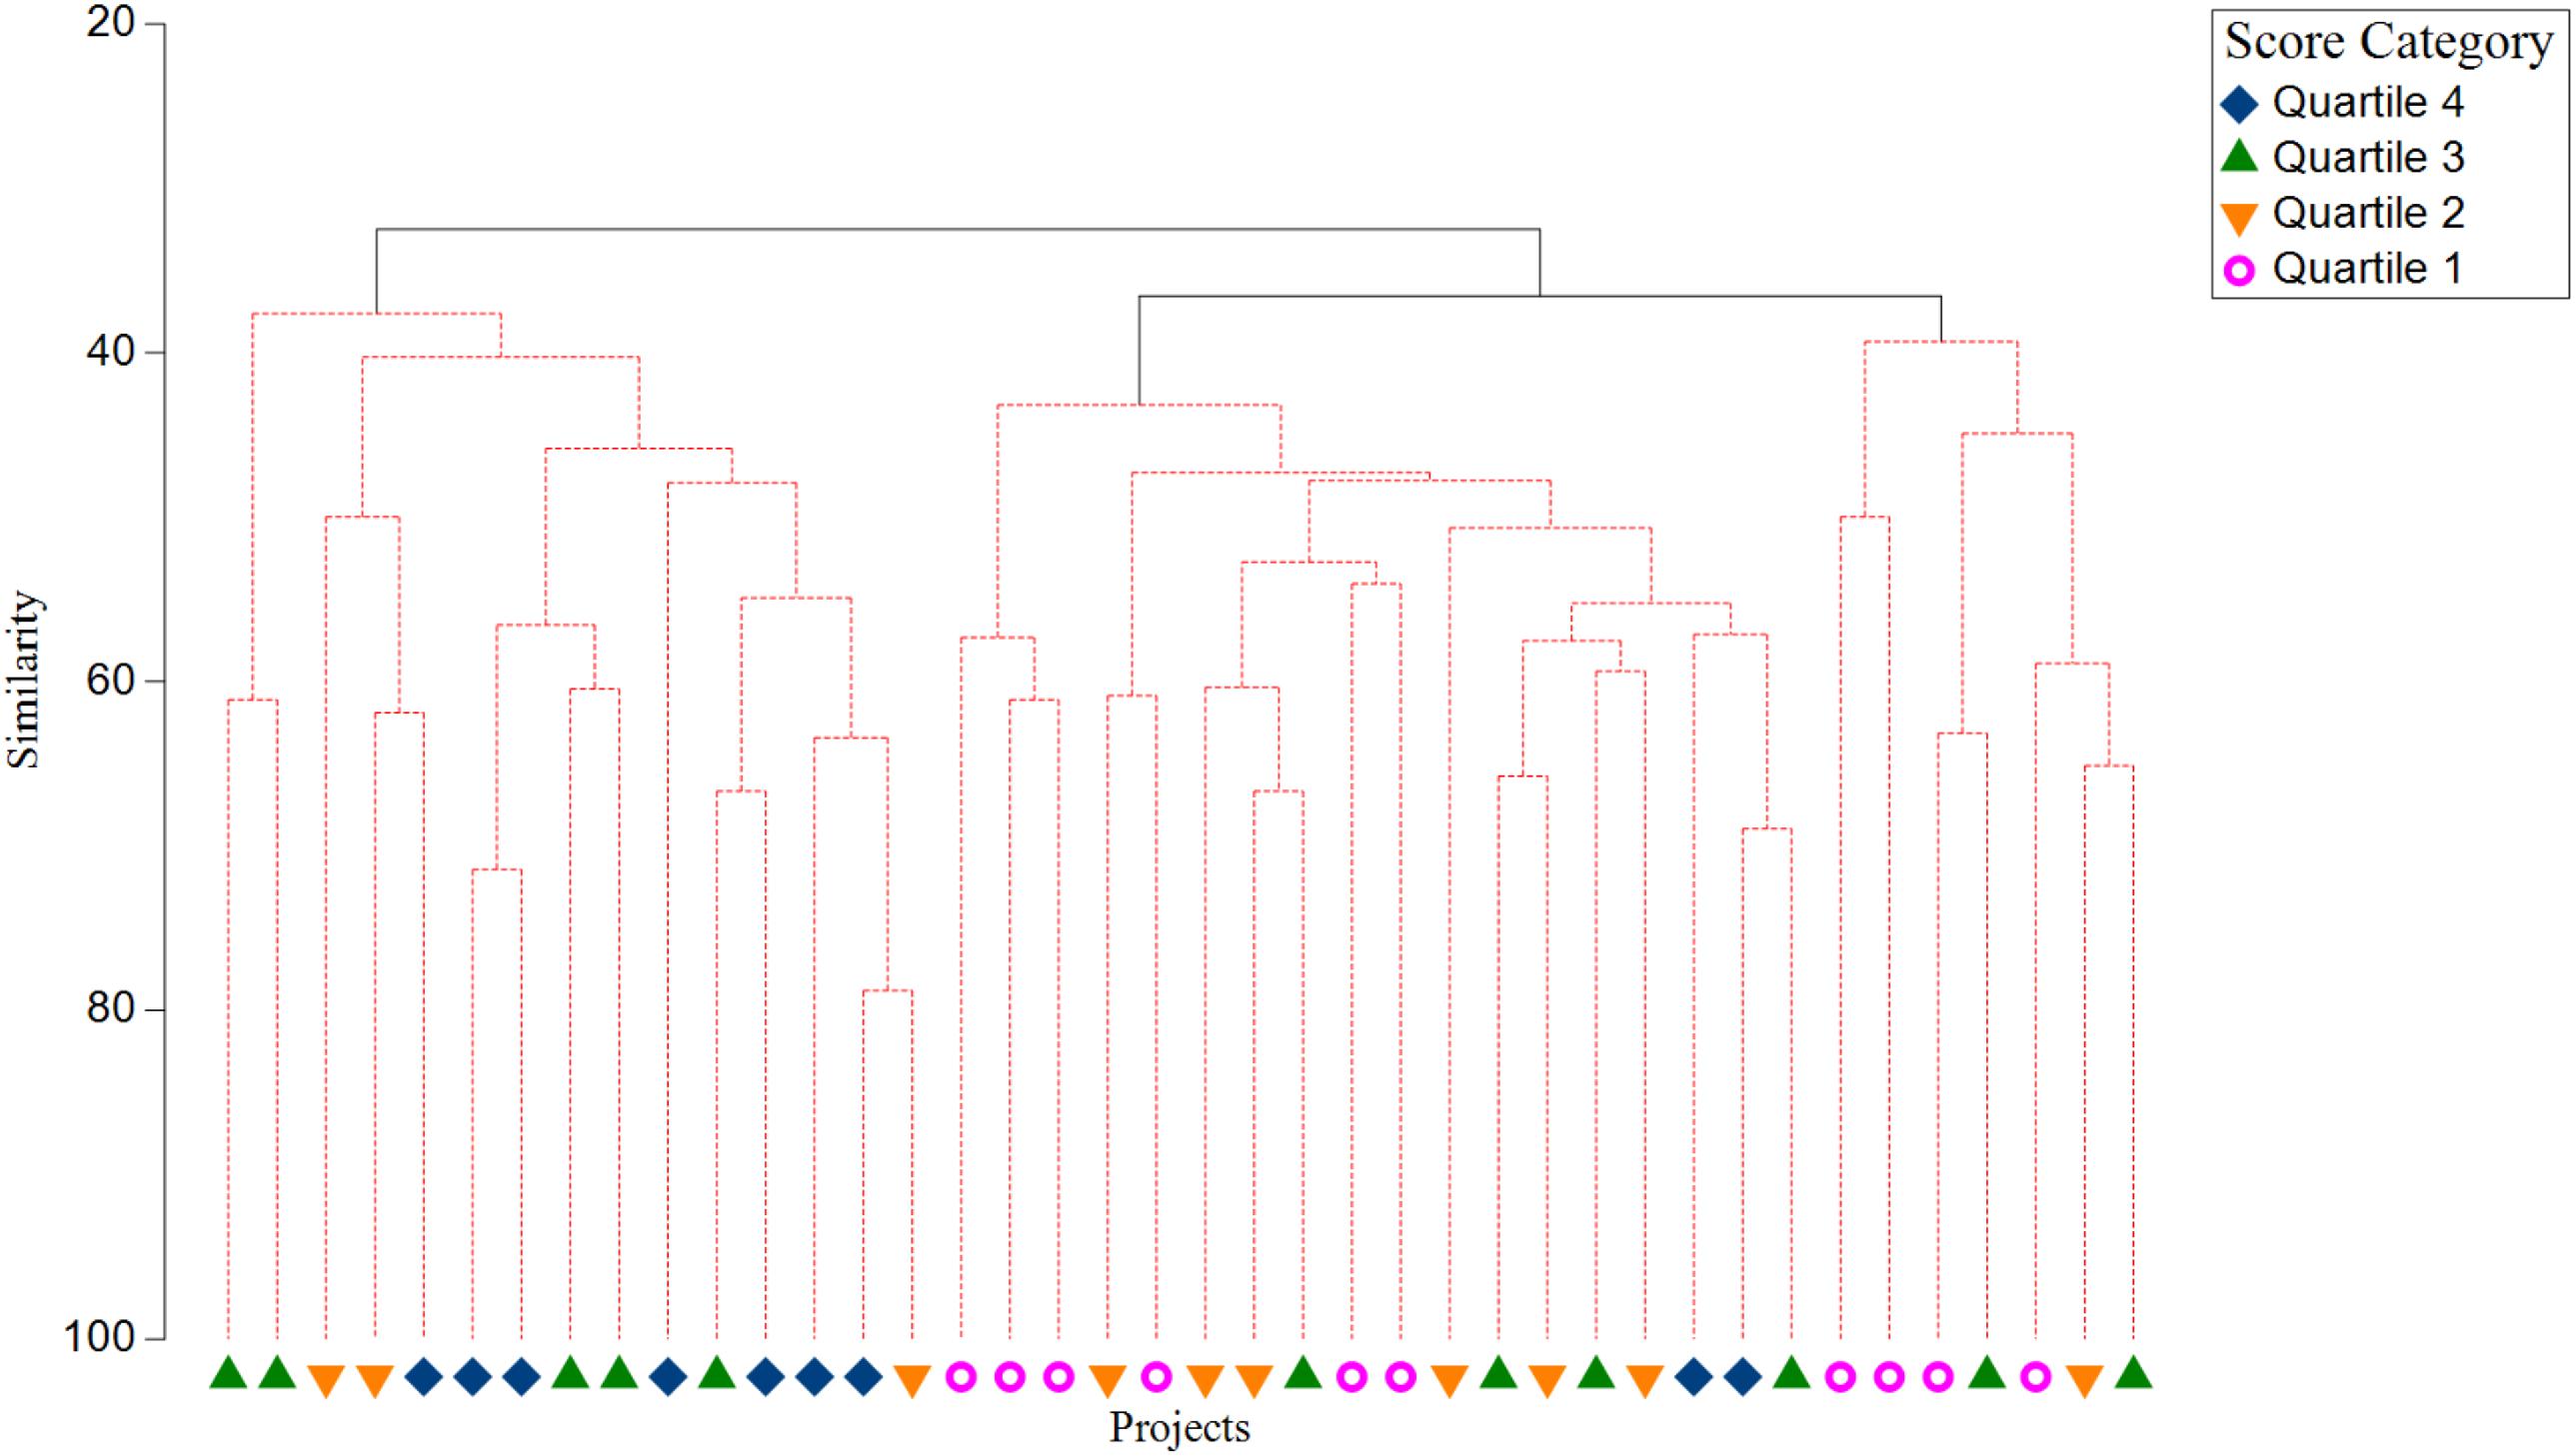
The cluster analysis separated CBM projects into three significant groups according to the SIMPROF test (Fig. 3). The first significant branching of the dendrogram separated one cluster containing seven (78%) Quartile 4 projects. The other cluster contained all 10 Quartile 1 projects and seven (70%) Quartile 2 projects. The Quartile 3 projects were almost equally divided into the two branches of the dendrogram (five vs. six). A further significant division in one branch grouped six (60%) Quartile 1 projects with six (60%) Quartile 2 projects, three (27%) Quartile 3 projects, and two (22%) Quartile 4 projects. The final cluster appeared to be an intermediate or alternative grouping that contained four (40%) Quartile 1, one (10%) Quartile 2, and two (18%) Quartile 3 projects. These dendrogram branches suggested project characteristics differed between the Quartile 4 and Quartile 1 score categories, while the Quartile 2 and Quartile 3 projects were less distinct.
Fig. 3.
The nMDS ordination plot presented the Quartile 4 projects as clustered on the left side of the plot, whereas the Quartile 1 projects clustered on the right side (Fig. 4). A secondary pattern further distinguished several Quartile 1 projects in the plot's lower right quadrant. The ordination's high stress (i.e., > 0.2) indicated that the points were close to being arbitrarily placed in two-dimensional space. However, the cluster analysis supported the general conclusion that the three groups were distinct (Clarke et al. 2014). We examined the three-dimensional plot (stress 0.17) to ensure that the Quartile 4 and Quartile 1 projects were generally clustered separately. After conducting the nMDS, we restricted further investigation to the Quartile 1 and Quartile 4 projects, as there appeared to be no discernible difference in characteristics between the Quartile 2 and Quartile 3 projects.
Fig. 4.
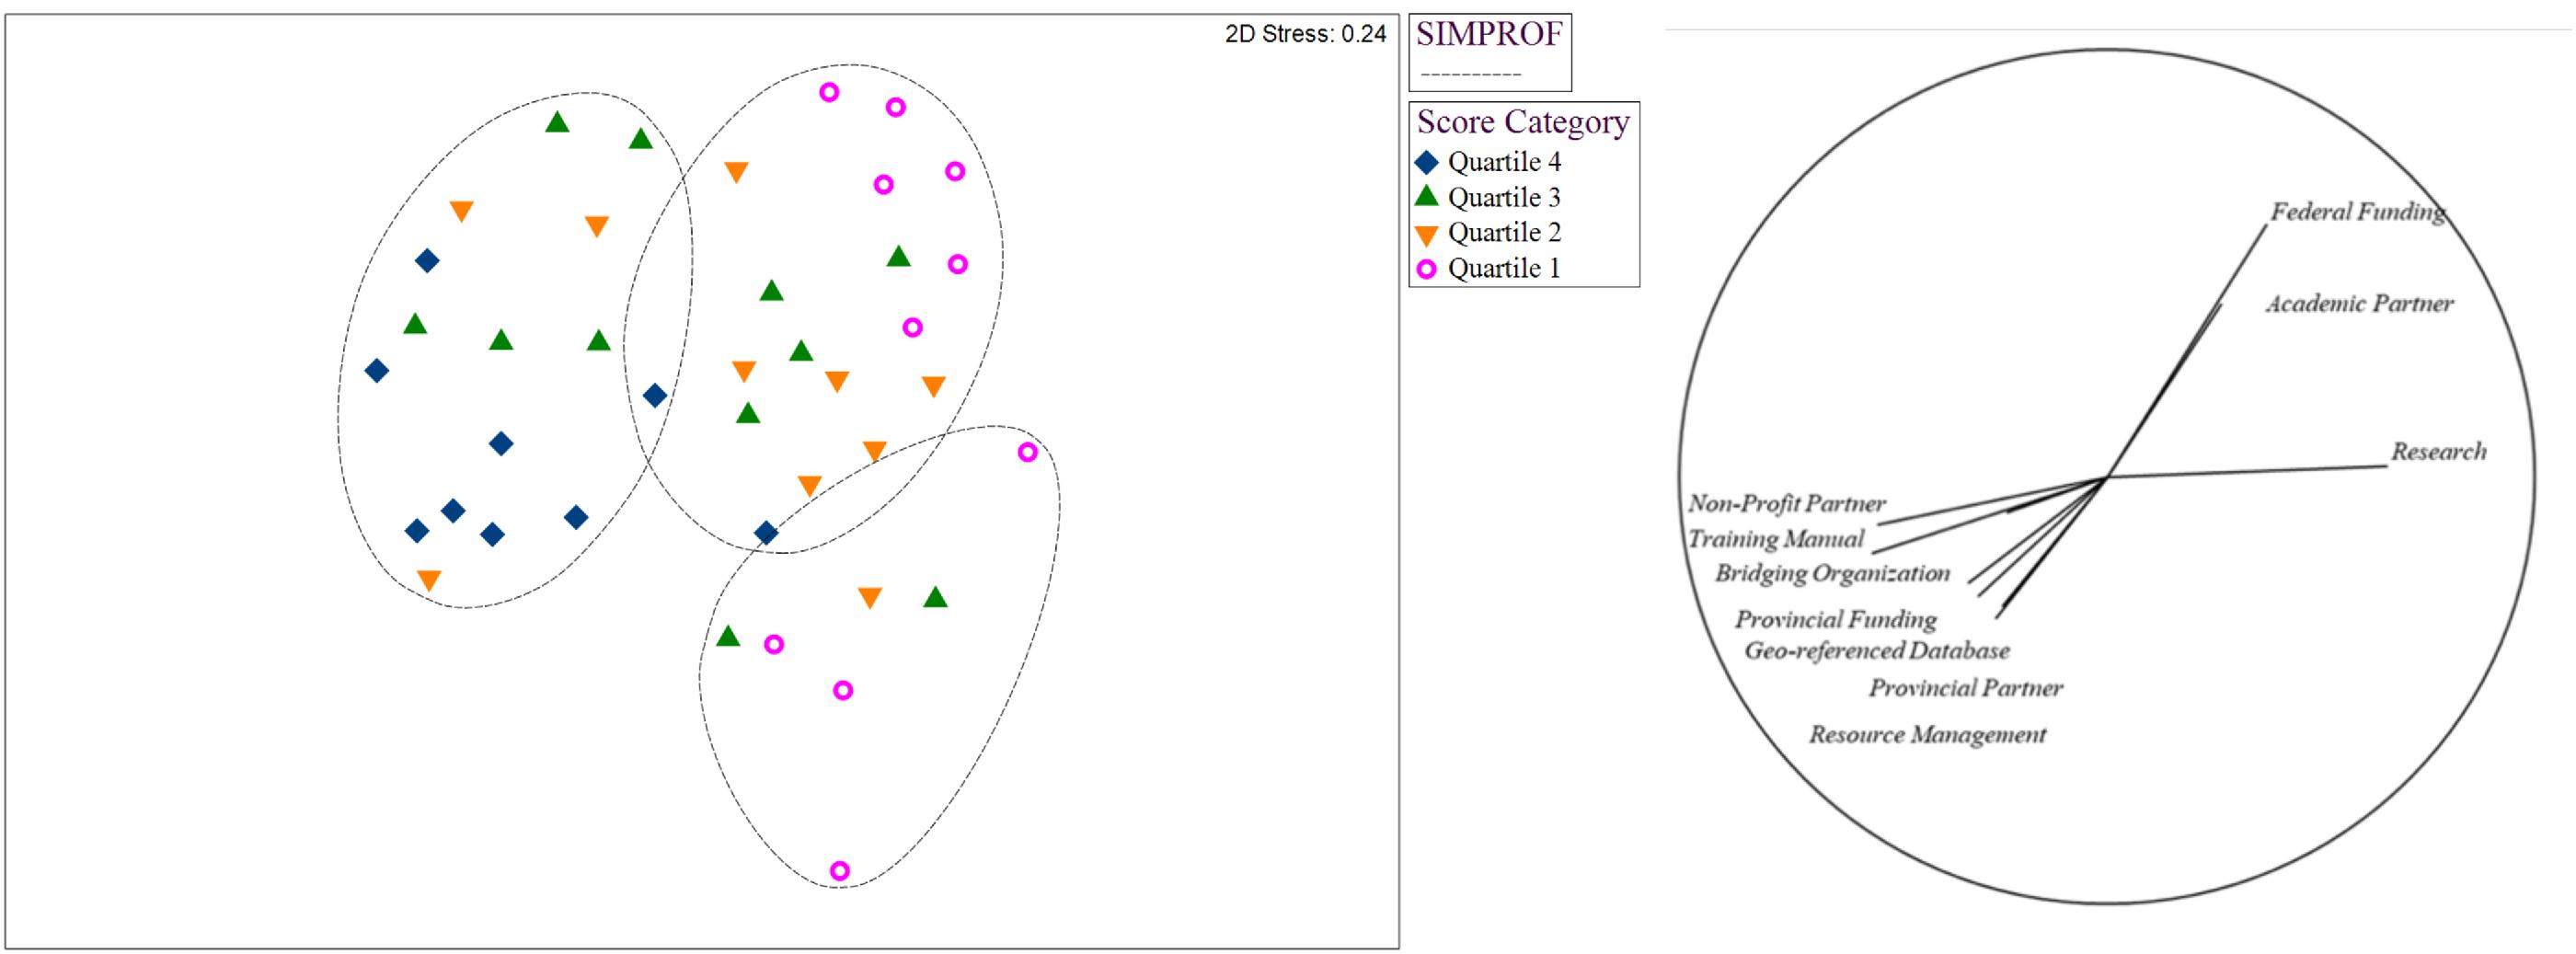
Several identified shared characteristics could help support the intentional design of future CBM projects. Results of the SIMPER analysis are in Tables 3–5, Figs. 4 and 5, and Supplementary Material 9. The vector plot adjacent to the nMDS displayed the 10 most influential project characteristics identified by the SIMPER analysis (Fig. 4). We found that CBM projects in Quartile 4 (highest scoring projects) shared key characteristics that were uncommon in the Quartile 1 projects (Figs. 4 and 5 and Table 4). Quartile 4 project participants followed standardized data collection protocols described in training manuals to collect measurements and samples in the field. Communities and project partners used project data to create baseline datasets and inform resource management decisions. These projects typically received funding and in-kind support from provincial/territorial government agencies. Raw data were publicly available through georeferenced databases that were often created and managed by a third party. These projects were typically administered by, or partnered with, non-profit organizations that typically acted as the bridging organization to coordinate community member involvement in the project.
Fig. 5.
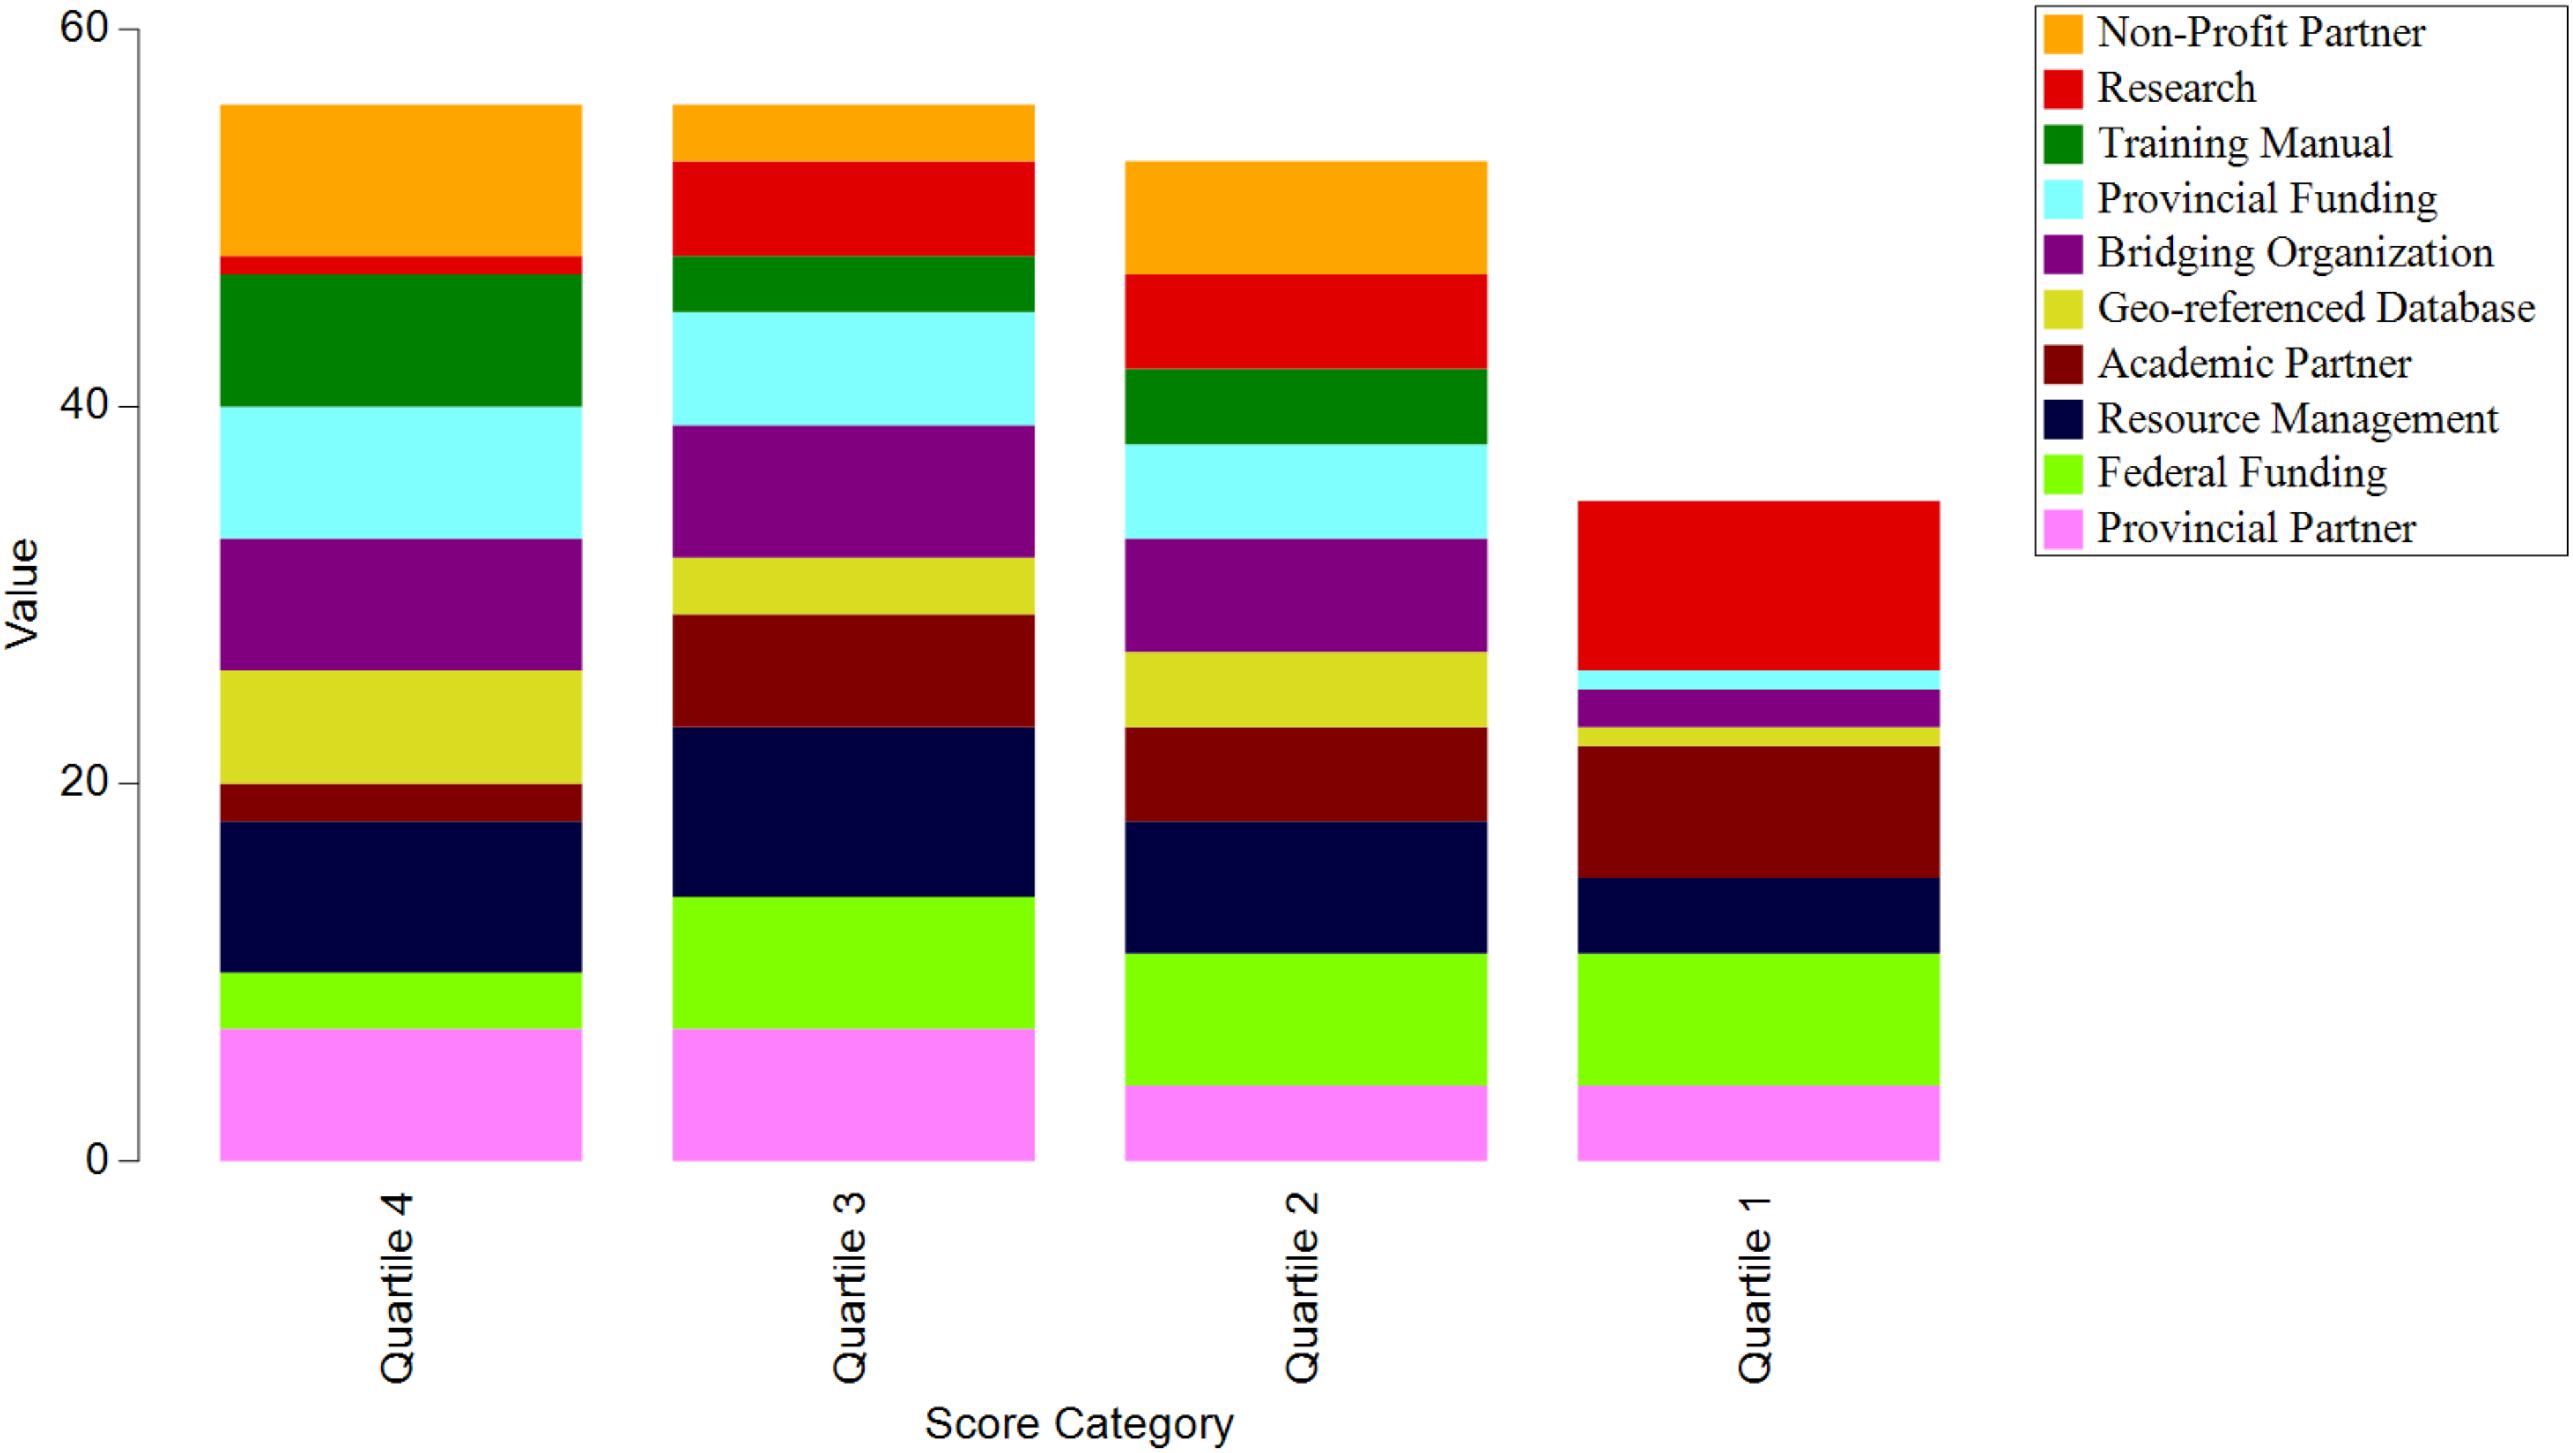
Table 4.
| Project characteristic | Average abundance | Contribution to similarity (%) | Cumulative contribution (%) |
|---|---|---|---|
| Data objective—research | 0.90 | 12.81 | 12.81 |
| Regional partner | 0.80 | 9.56 | 22.36 |
| Modern land claim | 0.80 | 9.34 | 31.71 |
| Federal funding | 0.70 | 6.66 | 38.37 |
| Academic partner | 0.70 | 6.66 | 45.03 |
| Federal partner | 0.60 | 4.83 | 49.86 |
| Indigenous Knowledge | 0.60 | 4.80 | 54.65 |
| Observations for data collection | 0.50 | 3.73 | 58.39 |
| Co-management partner | 0.50 | 3.32 | 61.70 |
| Data objective—human health and safety | 0.50 | 3.27 | 64.98 |
| Sample collection | 0.50 | 3.23 | 68.21 |
| Paid monitors | 0.50 | 3.18 | 71.39 |
Note: See methods for score category definitions.
Training materials
The support framework provided by training materials was positively associated with the Quartile 4 projects. All Quartile 4 projects described training community members to collect quantitative data through sample collection and field measurements, with 89% documenting their standardized monitoring protocols in training materials (e.g., manuals, videos, and online courses). None of the Quartile 1 projects reported using training materials. Standardized data collection methods can help CBM projects inform environmental decision-making (Hunsberger et al. 2005; Conrad and Daoust 2008; Kouril et al. 2016; McKay and Johnson 2017a; Herman-Mercer et al. 2018). Training has been identified as a critical component of CBM projects that aim to collect data comparable to that collected by professional scientists (Fore et al. 2001; Sharpe and Conrad 2006). The use of training materials may enable participants to collect data over long time periods without the high costs associated with routine in-person training sessions. Training materials may also facilitate training for the larger number of project participants that typified the Quartile 4 projects. Finally, these training materials provided concrete evidence of the standardized protocols used in quantitative data collection, which may have encouraged more decision-makers to use the data (Kouril et al. 2016; McKay and Johnson 2017a), thereby increasing a project's data application score.
Project objectives
The Quartile 4 projects had objectives linked to resource management decision-making, whereas the Quartile 1 projects more often had objectives related to research (Fig. 4 and Table 5). Resource management project objectives were also associated with higher Data Application scores, as all Quartile 4 projects collected data to inform resource management decisions or environmental assessment, and many (67%) specifically aimed to generate baseline datasets. Projects with a resource management objective had a median data application score of 5. Conversely, Quartile 1 projects were typically research-focused and may not have sought to link results to decision-making directly. Note that this is not a weakness of Quartile 1 projects, just a difference in objectives. Projects with research-oriented objectives and no clear resource management objective had a median data application score of 3. Linking data to decision-making has been previously identified as a major contributor to CBM project sustainability (Kouril et al. 2016; Parlee et al. 2017; McKay and Johnson 2017b). CBM projects designed to inform resource management decisions could be more attractive to project participants and funding agencies, leading to longer project durations and higher project participation rates (Danielsen et al. 2005; Carlsson et al. 2015; Kouril et al. 2016; McKay and Johnson 2017b). Projects that scored ≥4 for project duration had a median data application score of 5, and projects that scored ≥4 for project participants had a median data application score of 4. Thus, high project duration and project participant scores were associated with projects with a high data application score.
Table 5.
| Project characteristic | Average abundance | Contribution to dissimilarity (%) | Cumulative contribution to dissimilarity (%) | |
|---|---|---|---|---|
| Quartile 4 | Quartile 1 | |||
| Non-profit partner | 0.89 | 0.00 | 3.39 | 3.39 |
| Data objective—research | 0.11 | 0.90 | 3.08 | 6.47 |
| Training manual | 0.78 | 0.00 | 2.88 | 9.34 |
| Provincial funding | 0.78 | 0.10 | 2.72 | 12.07 |
| Bridging organization | 0.78 | 0.20 | 2.54 | 14.60 |
| Geo-referenced database | 0.67 | 0.10 | 2.39 | 16.99 |
| Academic partner | 0.22 | 0.70 | 2.22 | 19.21 |
| Data objective—resource management | 0.89 | 0.40 | 2.22 | 21.43 |
| Federal funding | 0.33 | 0.70 | 2.13 | 23.57 |
| Provincial partner | 0.78 | 0.40 | 2.13 | 25.69 |
| Data objective—baseline | 0.67 | 0.30 | 2.13 | 27.82 |
| Indigenous Knowledge | 0.11 | 0.60 | 2.12 | 29.94 |
| Regional partner | 0.44 | 0.80 | 2.10 | 32.04 |
| Pre-1975 Title Treaty Land Claim | 0.56 | 0.10 | 2.07 | 34.10 |
| Modern land claim | 0.44 | 0.80 | 2.06 | 36.16 |
| Third-party database | 0.56 | 0.00 | 2.05 | 38.21 |
| Federal partner | 0.22 | 0.60 | 2.05 | 40.26 |
| Routine reports | 0.56 | 0.20 | 2.03 | 42.29 |
| Infrequent reports | 0.56 | 0.10 | 1.97 | 44.25 |
| Data collection—observations | 0.00 | 0.50 | 1.95 | 46.20 |
| Data collection—measurements | 0.78 | 0.50 | 1.93 | 48.14 |
| Field training | 0.56 | 0.40 | 1.93 | 50.07 |
| Community outreach materials | 0.56 | 0.10 | 1.92 | 51.99 |
| Project-specific database | 0.56 | 0.40 | 1.91 | 53.90 |
| Data collection—sample collection | 0.67 | 0.50 | 1.90 | 55.80 |
| Co-management partner | 0.33 | 0.50 | 1.86 | 57.66 |
| Data objective—human health & safety | 0.11 | 0.50 | 1.84 | 59.50 |
| Paid monitors | 0.22 | 0.50 | 1.83 | 61.33 |
| Community involvement—project design | 0.44 | 0.40 | 1.79 | 63.12 |
| Unceded land claim | 0.44 | 0.20 | 1.76 | 64.88 |
| Non-profit trainer | 0.44 | 0.00 | 1.71 | 66.59 |
| Non-profit funding | 0.33 | 0.20 | 1.59 | 68.17 |
| Community involvement—data analysis | 0.33 | 0.30 | 1.57 | 69.75 |
| Routine training | 0.33 | 0.30 | 1.57 | 71.32 |
Note: See methods for score category definitions.
Funding
We also observed an association between project objectives and project funding and partnerships. The Quartile 4 projects’ objectives of collecting resource management and baseline data were often associated with funding and partnerships with provincial/territorial governments. In contrast, the Quartile 1 projects’ objective of research was often associated with federal funding. Federal research funding may less frequently target large-scale and long-term projects, reducing project duration and project participant scores. Projects that received federal funding—and no provincial/territorial funding—had median project duration and project participant scores of 2. Federal funding sources may also target projects with objectives not typically associated with CEA (e.g., research, community capacity building, fostering community connections to the land, food security, etc.). In contrast, provincial and territorial sources of project funds are often targeted at resource management objectives since these are frequently matters of provincial/territorial jurisdiction.
Data availability, accessibility, and management
Provincial/territorial government funding was frequently associated with publicly available data, resulting in projects with high data availability scores. We found that the majority (63%) of the projects we scored with provincial/territorial funding also allowed public data access. Since 2011, Canadian provincial/territorial governments have increasingly recognized the importance of open data (e.g., GO 2021; GBC 2022; GNWT 2022). Thus, provincial/territorial funding could have placed stricter requirements on project data availability. It is also possible that provincial/territorial agencies can provide more support to CBM organizations in meeting their data accessibility requirements than federal funding agencies, and provide data-sharing platforms that are highly accessible. In addition, provincial/territorial governments often employ technical personnel in regional offices with considerable experience working with community-based groups. Note that public data access is not always desirable for CBM projects (e.g., projects that involve protected or sensitive information, such as highly valued sites and Indigenous Knowledge, or seek to advance entirely local monitoring objectives).
The Quartile 4 projects generally provided public data access through georeferenced databases (i.e., sampling locations displayed on online maps). Georeferenced databases provide interactive maps that make quantitative and qualitative data accessible to non-technical users (Gérin-Lajoie et al. 2018). These databases may be built-for-purpose or third-party databases. Our findings are consistent with recommendations made in the literature regarding the use of digital databases (Hunsberger et al. 2005), as the long-term sustainability of CBM projects depends on data being managed to facilitate analysis and communication of results (Eamer 2011) and provide data access to project partners and decision-makers (McKay and Johnson 2017b). The Quartile 4 projects offered excellent examples of the rich data that can be easily accessible to support CEA and other applications, such as research and resource management—potentially increasing their data application score.
Bridging organizations
The participation of bridging organizations was also common in the Quartile 4 projects (78%). In this context, a bridging organization is a non-profit organization, private consultant, or co-management organization tasked with coordinating community member involvement in the project. Bridging organizations act as the liaison between external researchers and community participants to ensure ongoing community engagement, expand opportunities for knowledge exchange, and build trust among project partners (Carlsson et al. 2015; Kouril et al. 2016; Wilson et al. 2018). The bridging organizations for our Quartile 4 projects were primarily non-profit organizations, with one case of a local co-management agency. Non-profit organizations may have been instrumental in sustaining relationships with and coordinating the larger number of project participants in the Quartile 4 projects. The median project participant score for projects without bridging organizations was 2. The Gwich'in Harvest Study was the only project in the Quartile 4 score category to report a co-management agency as the bridging organization (Raygorodetsky and Chetkiewicz 2017). It involved the smallest number of project participants (four communities with multiple participants per community) among the Quartile 4 projects. While coordinating a CBM project across four communities would already be logistically challenging, the other Quartile 4 projects engaged with even more communities (21–31) or a considerable number of volunteers (14–600) or non-profit groups (6–10). All these projects involved non-profit bridging organizations, suggesting that these kinds of organizational structures could benefit current and future CBM projects that aim to involve more communities and participants not tied to a single local government.
Other project attributes and considerations
We found the majority (67%) of Quartile 4 projects were situated in southern and western Canada, while the majority (80%) of Quartile 1 projects were in northeastern Canada (Nunavut, Nunavik, and Nunatsiavut; Fig. 2 and Table 6). This geographic pattern may reflect a non-uniform distribution of CBM project objectives throughout the country. For example, CBM projects in southern and western Canada frequently reported resource management as a project objective (74%), and they often shared data publicly (79%). Conversely, CBM projects in northeastern Canada frequently reported research (100%) or health and safety (50%) as project objectives. These projects emphasized local communication efforts more; public data access was only reported by 8%. It is important to note that we scored the data availability of projects that published project information in scientific journals as 3/5 since the raw data were not publicly available and the release of the project findings depended on publication timelines. CBM projects in northeastern Canada may less frequently publish detailed project information due to project collaborations, the presence of sensitive data, or foundational data objectives that do not extend to general public use.
Table 6.
| Project name | Project1 number | Locality | Cumulative score | Score category |
|---|---|---|---|---|
| Lake Partnership Program | 38 | ON | 39 | Quartile 4 |
| Indigenous Observations Network | 32 | YT | 37 | Quartile 4 |
| BC Lake Stewardship and Monitoring Program | 6 | BC | 37 | Quartile 4 |
| NWT-wide Community-Based Water Quality Monitoring Program | 45 | NT | 36 | Quartile 4 |
| Lake Winnipeg Community-Based Monitoring Program | 39 | MN | 35 | Quartile 4 |
| Columbia Basin Water Quality Project | 8 | BC | 34 | Quartile 4 |
| Gwich'in Harvest Study | 27 | NT | 32 | Quartile 4 |
| Columbia Basin Groundwater Monitoring Program | 8 | BC | 32 | Quartile 4 |
| Kings County Lake Monitoring Program | 35 | NS | 32 | Quartile 4 |
| Arctic Borderlands Ecological Knowledge Co-op | 2 | NT, YT | 31 | Quartile 3 |
| Regional District of Nanaimo Community Watershed Monitoring Network | 51 | BC | 31 | Quartile 3 |
| Rocky View County Community-Based Groundwater Monitoring Project | 52 | AB | 31 | Quartile 3 |
| Annapolis River Guardians | 1 | NS | 30 | Quartile 3 |
| Eastport Lobster Monitoring Program | 21 | NL | 29 | Quartile 3 |
| Peace-Athabasca Delta Ecological Monitoring Program | 46 | AB | 29 | Quartile 3 |
| Sahtu Wildlife Health Monitoring Program | 53 | NT | 29 | Quartile 3 |
| Community Moose Monitoring Project | 14 | YT | 29 | Quartile 3 |
| Eastern Athabasca Regional Monitoring Program | 20 | SK | 29 | Quartile 3 |
| Athabasca Working Group Environmental Monitoring Program | 4 | SK | 28 | Quartile 3 |
| Inuvialuit Settlement Region Community-Based Monitoring Program | 34 | NT, YT | 28 | Quartile 3 |
| Gitga'at Guardian Watchmen | 25 | BC | 27 | Quartile 2 |
| Sea Ice Monitoring Network | 54 | NU | 27 | Quartile 2 |
| Nunavik Integrated Community-Based Monitoring Program | 44 | QC* | 27 | Quartile 2 |
| Peel River Fish Study | 47 | NT | 27 | Quartile 2 |
| Groundswell Community Based Groundwater Monitoring | 26 | NS | 27 | Quartile 2 |
| Sequencing the Rivers for Environmental Assessment and Monitoring | 56 | National | 25 | Quartile 2 |
| Community-Based Fishery Monitoring for Arctic Char in Baffin Region | 13 | NU | 23 | Quartile 2 |
| Ni Hat'Ni Dene Program | 42 | NT | 23 | Quartile 2 |
| Community-based Wildlife Monitoring Network | 13 | NU | 23 | Quartile 2 |
| Liard Basin Monitoring Initiative | 40 | BC | 23 | Quartile 2 |
| Kugluktuk Berry Monitoring Project | 37 | NU | 22 | Quartile 1 |
| Community Odour Monitoring Program | 15 | AB | 22 | Quartile 1 |
| Wemindji Community Fisheries Program | 62 | QC | 21 | Quartile 1 |
| Sources of Methylmercury, Perfluoroalkyl Substances, and Polychlorinated Biphenyls to Ringed Seal Food Webs of Lake Melville, Northern Labrador | 58 | NL* | 21 | Quartile 1 |
| Ice Monitoring in Deception Bay/Hudson Strait | 29 | QC* | 20 | Quartile 1 |
| Innu Nation Environmental Guardians | 33 | NL* | 19 | Quartile 1 |
| eNuk Environment and Health Monitoring Program | 23 | NL* | 17 | Quartile 1 |
| Community-Based Monitoring of Ice-Breeding Seals and Polar Bear Feeding in the Gulf of Boothia | 11 | NU | 17 | Quartile 1 |
| Harvest and Environmental Records Operational System | 28 | NU | 17 | Quartile 1 |
| Sea-Run Char Monitoring Program | 55 | NL* | 16 | Quartile 1 |
Note: QC*: Nunavik, NL*: Nunatsiavut. See methods for score category definitions.
1
Project numbers align with numbers in Fig. 2.
This geographic pattern reflects a fundamental limitation of our study: our analysis depended on project data that were available online. Our master list is not an exhaustive list of all CBM projects within Canada, although we strived to create a comprehensive list. Our compilation of CBM projects was biased toward projects known by our respective networks, projects discussed in the peer-reviewed literature, projects with online documentation, and projects included in previous CBM project reviews. In addition, we only used project information readily available online to evaluate the projects. This approach under-represents CBM projects that do not target reporting to a public audience (e.g., those focused on reporting in small communities or regarding sensitive information) and thus have a small online footprint. Verifying details from project managers or participants through interviews should more accurately reflect the structures and procedures of CBM projects that do not target a public audience.
CBM projects with restricted public data access would have scored low for data availability. Some projects—particularly those that involve Indigenous Knowledge—were less likely to report public data access, for very good reasons related to ownership, control, access, and possession (OCAP; FNIGC 2023) and Indigenous data sovereignty. We identified Indigenous Knowledge as a project characteristic only for projects that explicitly described the use of Indigenous Knowledge for a particular project stage (e.g., design, data collection). It is important to note that not all Indigenous-led projects explicitly describe the incorporation of Indigenous Knowledge into their projects. As such, the Indigenous Knowledge use project characteristics do not identify all Indigenous-led projects in our inventory. The average data availability score for the projects that explicitly reported Indigenous Knowledge was 3/5, suggesting data sharing in these projects was less frequently directed towards a public audience. Restricted data sharing and access was likely due to sensitivities surrounding sharing Indigenous Knowledge publicly and ownership of Indigenous Knowledge by the community (Gérin-Lajoie et al. 2018; Thompson et al. 2020). It is important to note that these are not project weaknesses; they are often features of design. Since our study depended solely on online project documentation, projects with data sharing protocols that aimed to protect Indigenous sovereignty (including data sovereignty) would likely score lower for project attributes such as data collection protocols and data management, which only reflects the fact that this study was aimed at CBM efforts that were directed toward western science, where open data are now often a requirement.
Projects oriented towards a local audience that are collecting and protecting sensitive data may be able to contribute to CEA in many ways (e.g., describing baseline biophysical or socioeconomic conditions and providing different forms of knowledge), but this is not captured by our rubric based solely on publicly available documentation and scoring that is focused on western scientific methods. This is an important gap to recognize with our rubric because Indigenous Knowledge is widely acknowledged as essential for environmental monitoring and effective CEA by contributing a holistic understanding of the socio-ecological systems, past, present, and future (Gofman 2010; ECCC 2016; Johnson et al. 2016; Kouril et al. 2016; McKay and Johnson 2017b). While Indigenous Knowledge is critical to effective CEA, individual project managers must address the project-specific sensitivities surrounding sharing Indigenous Knowledge publicly and ownership of Indigenous Knowledge by its community; each community and the individuals who choose to share their Indigenous Knowledge will need to play an equitable role in CEA (Gérin-Lajoie et al. 2018; Thompson et al. 2020). Among many other reconciliatory actions that include respect for Indigenous sovereignty, impact assessment and CEA processes must evolve to facilitate meaningful participation of Indigenous peoples in both the western science and Indigenous science aspects of assessments (Arsenault et al. 2019; Eckert et al. 2020). Thus, it is imperative that improvements to western science approaches to CEA include avenues for meaningful participation by Indigenous peoples and opportunities to be informed by Indigenous Knowledge. Future work could build on our study by focusing on the CBM project characteristics that are important for Indigenous-led CBM. A study of Indigenous-led CBM in Canada could use our project list as a starting point and focus on the projects we identified as having explicitly included Indigenous Knowledge (see Supplementary Material 7; Table S7).
It is important to note that the CBM projects included in our study had various objectives independent of contributing to CEA. Our assessment of the ability of each project to contribute environmental monitoring data to baseline studies for CEAs was not an evaluation of project quality or efficacy in fulfilling their stated and original objectives. Furthermore, we base project scoring entirely on available documentation. Newly available documentation could describe project practices in greater detail, which could result in score changes. We generated our project scores using an ordinal scale rubric, resulting in relative project rankings. Thus, projects that did not receive the highest scores (Quartile 1–3 projects) may be able to contribute valuable baseline data to CEAs but were simply ranked lower than other projects that demonstrated exceptional ability (Quartile 4 projects) as per our score criteria. Despite these limitations, we think that quantitative identification of characteristics shared by high-scoring projects can advance the design of future effective CBM projects.
Conclusions
Overall, this snapshot of CBM in Canada confirms there are projects that are already collecting data that could inform western science approaches to biophysical baseline studies for CEA. These findings demonstrate CBM's capacity to address criticisms of CEA's western science methodology, particularly a shortage of adequate baseline data. With this knowledge, we can recommend CEA practitioners and natural resource managers use CBM to enhance their cumulative effects monitoring and assessment practices. Our scoring rubric and subsequent analysis revealed the organizational and methodological practices most associated with projects that appear well-prepared to support CEA baseline studies. Characteristics that CBM projects looking to contribute to CEAs should consider in their design include the use and publication of training manuals for data collection and management, the formation of partnerships with provincial/territorial levels of government, the use of a georeferenced database for data sharing, and the presence of a non-governmental bridging organization to facilitate community engagement. Well-designed CBM holds the potential to augment the science in CEA; CBM's potential and its design considerations to enhance the role of Indigenous Knowledge in CEA are exciting fields for future study.
Acknowledgements
We would like to thank all of the volunteers and community members who participated in the community-based monitoring programs evaluated in this study. Marlene Doyle, Nancy Kingsbury, Julie Boucher, Steven Alexander, Matthew Boeckner, Solange Nadeau, and Dominique Roche provided valuable advice on the design of this study and/or contributed to our database of Canadian community-based monitoring projects. Funding for this project was provided by the Wildlife and Landscape Science Directorate of Environment and Climate Change Canada.
References
Armitage L.M., Hanna K., Noble B. 2019. Freshwater cumulative effects and environmental assessment in the Mackenzie Valley, Northwest Territories: challenges and decision-maker needs. Global Environmental Change, 21(6): 995.
Arsenault R., Bourassa C., Diver S., McGregor D., Whitman A. 2019. Including Indigenous Knowledge systems in environmental assessments: restructuring the process. Global Environmental Politics, 19(3): 120–132.
Atlas of Community Based Monitoring [ACBM]. 2020. Atlas of community-based monitoring and Indigenous Knowledge in a changing Arctic. Inuit Circumpolar Council, Ottawa, ON. Available from http://www.arcticcbm.org/index.html [accessed 1 March 2020].
Ball M., Somers G., Wilson J.E., Tanna R., Chung C., Duro D.C., Seitz N. 2013. Scale, assessment components, and reference conditions: issues for cumulative effects assessment in Canadian watersheds. Integrated Environmental Assessment and Management, 9(3): 370–379.
Canadian Cryospheric Information Network [CCIN]. 2017. Polar data catalogue search. CCIN, Waterloo, ON. Available from https://www.polardata.ca/pdcsearch/ [accessed 20 March 2020].
Canadian Council of Ministers of the Environment [CCME]. 2014. Canada-wide definitions and principles for cumulative effects. Available from https://www.ccme.ca/files/Resources/enviro_assessment/CE%20Definitions%20and%2Principles%201.0%20EN.pdf [accessed 1 March 2020].
Canadian Polar Commission [CPC]. 2014. CPC monitoring inventory Dec. 2014. Available from http://www.polarcom.gc.ca/eng/content/state-environmental-monitoring-northern-canada [accessed 1 April 2020].
Carlsson A.M., Kutz S., Popko R., Veitch A., Behrens S. 2015. The Sahtu Wildlife Health Monitoring Program: summary report of results 2002–2014. Department of Environment and Natural Resources, Government of the Northwest Territories, Yellowknife, NT. p. 106. Available from http://sdw.enr.gov.nt.ca/nwtdp_upload/Appendix%201.%20WHM%20Summary%20Report.pdf [accessed 1 March 2021].
Chilima J.S., Gunn J.A.E., Noble B.F., Patrick R.J. 2013. Institutional considerations in watershed cumulative effects assessment and management. Impact Assessment and Project Appraisal, 31(1): 74–84.
Cicchetti D.V. 1994. Guidelines, criteria, and rules of thumb for evaluating normed and standardized assessment instruments in psychology. Psychological Assessment, 6(4): 284–290.
Clarke K.R., Gorley R.N., Somerfield P.J., Warwick R.M. 2014. Change in marine communities: an approach to statistical analysis and interpretation. 3rd ed. PRIMER-E, Plymouth, UK.
Conrad C.T., Daoust T. 2008. Community-based monitoring frameworks: increasing the effectiveness of environmental stewardship. Environmental Management, 41(3): 358–366.
Cronmiller J.G., Noble B.F. 2018. Integrating environmental monitoring with cumulative effects management and decision making. Integrated Environmental Assessment and Management, 14(3): 407–417.
Danielsen F., Burgess N.D., Balmford A. 2005. Monitoring matters: examining the potential of locally-based approaches. Biodiversity and Conservation, 14: 2507–2542. Available from https://link.springer.com/article/10.1007/s10531-005-8375-0.
Danielsen F., Burgess N.D., Balmford A., Donald P.F., Funder M., Jones J.P., et al. 2008. Local participation in natural resource monitoring: a characterization of approaches. Conservation Biology, 23(1): 31–42. PMID: 18798859. Available from https://conbio.onlinelibrary.wiley.com/doi/full/10.1111/j.1523-1739.2008.01063.x [accessed 18 February 2020].
DataStream. 2020. Communities and monitoring groups. Available from https://atlanticdatastream.ca/en/communities [accessed 15 March 2020].
Dubé M.G. 2003. Cumulative effect assessment in Canada: a regional framework for aquatic ecosystems. Environmental Impact Assessment Review, 23: 723–745. Available from https://www.sciencedirect.com/science/article/abs/pii/S0195925503001136.
Dubé M., Johnson B., Dunn G., Culp J., Cash K., Munkittrick K., et al. 2006. Development of a new approach to cumulative effects assessment: a northern river ecosystem example. Environmental Monitoring and Assessment, 113: 87–115.
Dubé M., Duinker P., Greig L., Carver M., Servos M., McMaster M., et al. 2013. A framework for assessing cumulative effects in watersheds: an introduction to Canadian case studies. Integrated Environmental Assessment and Management, 9(3): 363–369. Available from https://setac.onlinelibrary.wiley.com/doi/abs/10.1002/ieam.1418.
Duinker P.N., Greig L.A. 2006. The impotence of cumulative effects assessment in Canada: ailments and ideas for redeployment. Environmental Management, 37(2): 153–161. Available from https://link.springer.com/article/10.1007/s00267-004-0240-5
Eamer J. 2011. Keep it simple and be relevant: the first ten years of the Arctic Borderlands Ecological Knowledge Co-op. In Bridging scales and knowledge systems. Edited by W.V. Reid, F. Berkes, T. Wilbanks, D. Capistrano. Island Press, London, UK. pp. 185–206.
Eckert L.E., Claxton NX., Owens C., Johnston A., Ban N.C., Moola F., Dairmont C.T. 2020. Indigenous Knowledge and federal environmental assessments in Canada: applying past lessons to the 2019 impact assessment act. FACETS, 5: 67–90.
Environment and Climate Change Canada [ECCC]. 2016. Scientific considerations for designing cumulative environmental effects monitoring programs (draft). Science and Technology Branch, Environment and Climate Change Canada, Ottawa, ON.
First Nations Information Governance Centre [FNIGC]. 2023. The First Nations principles of OCAP. FNIGC, Ottawa, ON. Available from https://fnigc.ca/ocap-training/#:~:text=The%20First%20Nations%20principles%20of%20OCAP%C2%AE%20establish%20how%20First,to%20First%20Nations%20data%20sovereignty [accessed 16 December 2023].
Foley M.M., Mease L.A., Martone R.G., Prahler E.E., Morrison T.H., Murray C.C., Wojcik D. 2017. The challenges and opportunities in cumulative effects assessment. Environmental Impact Assessment Review, 62: 122–134. Available from https://www.sciencedirect.com/science/article/abs/pii/S019592551630004X?via%3Dihub [accessed 26 February 2021].
Fore L.S., Paulsen K., O’ Laughlin K. 2001. Assessing the performance of volunteers in monitoring streams. Freshwater Biology, 46: 109–123. Available from https://onlinelibrary.wiley.com/doi/10.1111/j.1365-2427.2001.00640.x [accessed 26 June 2017].
Gérin-Lajoie J., Herrmann T.M., MacMillan G.A., Hébert-Houle É., Monfette M., Rowell J.A., et al. 2018. IMALIRIJIIT: a community-based environmental monitoring program in the George River watershed, Nunavik, Canada. Écoscience, 25(4): 381–399. Available from https://www.tandfonline.com/doi/full/10.1080/11956860.2018.1498226 [accessed 17 December 2019].
Gibson R.B., McCarthy D.D.P., Staples K., Cooper K., Cloutis G., Bean J., et al. 2020. Synthesis at the nexus of sustainability assessment, regional/strategic assessment and Indigenous partnerships. Social Sciences and Humanities Research Council, Ottawa, ON. Available from https://www.sshrc-crsh.gc.ca/society-societe/community-communite/ifca- iac/evidence_briefs-donnees_probantes/environmental_and_impact_assessments-evaluations_environnementales_et_impacts/gibson_scott_doelle_sinclair-eng.aspx.
Gofman V. 2010. Community-based monitoring handbook: lessons from the Arctic. International Secretariat, Akureyri, Iceland. Available from https://caff.is/monitoring-series/community-based-monitoring/9-community-based-monitoring-handbook-lessons-from-the-arctic-and-beyond [accessed 17 July 2020].
Government of British Columbia [GBC]. 2022. Open data. Province of British Columbia, Victoria, BC. Available from https://www2.gov.bc.ca/gov/content/data/open-data [accessed 1 June 2022].
Government of the Northwest Territories [GNWT]. 2022. Open data. Government of Northwest Territories, Yellowknife, NT. Available from https://www.eia.gov.nt.ca/en/priorities/open-government/open-data [accessed 1 June 2022].
Government of Ontario [GO]. 2020. Archived—Ontario's Open Data Directive, 2019. King's Printer for Ontario, Ottawa, ON. Available from https://www.ontario.ca/page/ontarios-open-data-directive [accessed 1 June 2022].
Hegmann G., Cocklin C., Creasey R., Dupuis S., Kennedy A., Kingsley L., et al. 1999. Cumulative effects assessment practitioners guide. CEA Working Group for the Canadian Environmental Assessment Agency, Hull, QC.
Herman-Mercer N., Antweiler R., Wilson N., Mutter E., Toohey R., Schuster P. 2018. Data quality from a community-based water quality monitoring project in the Yukon River Basin. Citizen Science: Theory and Practice, 3(2): 1–13.
Hunsberger C.A., Gibson R.B., Wismer SK. 2005. Citizen involvement in sustainability centred environmental assessment follow-up. Environmental Impact Assessment Review, 25: 609–627. Available from https://www.sciencedirect.com/science/article/abs/pii/S0195925504001763 [accessed 4 May 2020].
Impact Assessment Act of Canada. 2019. c 28. Minister of Justice, Ottawa, ON. Available from https://laws.justice.gc.ca/eng/acts/i-2.75/index.html [accessed 15 October 2022].
Indigenous Guardians Pilot Program [IGPP]. 2020. Indigenous guardians pilot program map. Government of Canada, Ottawa, ON. Available from https://www.canada.ca/en/environment-climate-change/services/environmental funding/indigenous-guardians-pilot-program.html [accessed 15 March 2020].
Johnson D., Lalonde K., McEachern M., Kenney J., Mendoza G., Buffin A., Rich K. 2011. Improving cumulative effects assessment in Alberta: regional strategic assessment. Environmental Impact Assessment Review, 31: 481–483.
Johnson N., Behe C., Danielsen F., Krummel E.-M., Nickels S., Pulsifer P.L. 2016. Community based monitoring and Indigenous Knowledge in a changing Arctic: a review for the sustaining Arctic observing networks. Inuit Circumpolar Council, Ottawa, ON. Available from https://www.inuitcircumpolar.com/project/community-based monitoring-and-indigenous-knowledge-in-a-changing-arctic-a-review-for-the-sustaining-arctic-observing-networks%E2%80%8B/ [accessed 10 March 2020].
Jones F.C. 2016. Cumulative effects assessment: theoretical underpinnings and big problems. Environmental Reviews, 24: 187–204.
Kanu A., DuBois C., Hendriks E., Cave K., Hartwig K., Fresque-Baxter J., et al. 2016. Realizing the potential of community based monitoring in assessing the health of our waters. Our Living Waters. Available from http://awsassets.wwf.ca/downloads/realizing_the_potential_of_community_based_monitoring_in_assessing_the_health_of_our_.pdf [accessed 1 March 2017].
Kipp A., Cunsolo A., Gillis D., Sawatzky A., Harper L. 2019. The need for community-led, integrated and innovative monitoring programmes when responding to the health impacts of climate change. International Journal of Circumpolar Health, 78: 1517581.
Kouril D., Furgal C., Whillans T. 2016. Trends and key elements in community-based monitoring: a systematic review of the literature with an emphasis on Arctic and Subarctic regions. Environmental Reviews, 24: 151–163.
Lawe L.B., Wells J., Mikisew Cree. 2005. Cumulative effects assessment and EIA follow-up: a proposed community-based monitoring program in the Oil Sands Region, northeastern Alberta. Impact Assessment and Project Appraisal, 23(3): 205–209. Available from https://www.tandfonline.com/doi/abs/10.3152/147154605781765508.
Living Lakes Canada (LLC). 2020. Columbia Basin groundwater monitoring program. Living Lakes Canada, Nelson, BC. Available from livinglakescanada.ca/projects/groundwater/ [accessed 25 June 2020].
Mahoney A., Gearheard S., Oshima T., Qillaq T. 2009. Sea ice thickness measurements from a community-based observing network. Vol. 90. American Meteorological Society. pp. 370–378. Available from https://journals.ametsoc.org/view/journals/bams/90/3/2008bams2696_1.xml [accessed 5 March 2020].
McKay A.J., Johnson C.J. 2017a. Confronting barriers and recognizing opportunities: developing effective community-based environmental monitoring programs to meet the needs of Aboriginal communities. Environmental Impact Assessment Review, 64: 16–25. Available from https://www.sciencedirect.com/science/article/abs/pii/S0195925516302347?via%3Dihub.
McKay A.J., Johnson C.J. 2017b. Identifying effective and sustainable measures for community-based environmental monitoring. Environmental Management, 60: 484–495. Available from https://link.springer.com/article/10.1007/s00267-017-0887-3.
Miller C.B., Cleaver A., Huntsman P., Asemaninejad A., Rutledge K., Bouwhuis R., Rickwood C.J. 2022. Predicting water quality in Canada: mind the (data) gap. Canadian Water Resources Journal/Revue canadienne des ressources hydriques.
Moyer J., Fitzpatrick P., Diduck A., Froese B. 2008. Towards community-based monitoring in Manitoba's hog industry. Vol. 51. Canadian Public Administration. pp. 637–658. Available from https://onlinelibrary.wiley.com/doi/abs/10.1111/j.1754-7121.2008.00045.x.
Nadeau S., Picard A. 2019. Databased Caribou Initiative 19-02-2019. Database on Indigenous Initiatives related to Caribou. Developed by Natural Resources Canada, Ottawa, Canada. Copy of draft received from Matthew Boeckner with Environment and Climate Change Canada.
Noble B. 2008. Strategic approaches to regional cumulative effects assessment: a case study of the Great Sand Hills, Canada. Impact Assessment and Project Appraisal, 26(2): 78–90.
Noble B. 2021. Cumulative effects assessment. In Introduction to environmental assessment: a guide to principles and practices. 4th ed. Oxford University Press Canada. Don Mills, ON. pp. 211–237.
Northern Contaminants Program [NCP]. 2020. NCP funded projects. Available from https://www.ic.gc.ca/eic/site/063.nsf/eng/h_97392.html [accessed 15 March 2020].
Parlee B., Oloriz C., Stuart R. 2017. Inventory and analytical report of community-based monitoring programs. Canadian Environmental Assessment Agency, Ottawa, ON.
Raygorodetsky G., Chetkiewicz C. 2017. Watching, listening and learning to understand change: developing a community-based monitoring (CBM) initiative in Ontario's far north, Toronto, ON. Available from https://www.wcscanada.org/Portals/96/Documents/WCSCanada_CommunityBasedMonitoring_2017%20(1).pdf?ver=2018-02-21-090420-447 [accessed 15 June 2020].
Reed G., Brunet N.D., Natcher D.C. 2020. Can Indigenous community-based monitoring act as a tool for sustainable self-determination? The Extractive Industries and Society, 7: 1283.
Roach B., Walker T.R. 2017. Aquatic monitoring programs conducted during environmental impact assessments in Canada: preliminary assessment before and after weakened environmental regulation. Environmental Monitoring and Assessment, 189: 109.
Roche D.G., Kruuk L.E.B., Lanfear R., Binning S.A. 2015. Public data archiving in ecology and evolution: how well are we doing? Plos Biology, 13(11): e1002295. Available from https://journals.plos.org/plosbiology/article?id=10.1371/journal.pbio.1002295 [accessed 12 July 2020].
Seitz N.E., Westbrook C.J., Noble B.F. 2011. Bringing science into river systems cumulative effects assessment practice. Environmental Impact Assessment Review, 31: 172–179.
Sharpe A., Conrad C. 2006. Community based ecological monitoring in Nova Scotia: challenges and opportunities. Environmental Monitoring and Assessment, 113: 395–409. Available from https://link.springer.com/article/10.1007/s10661-005-9091-7 [accessed 4 May 2020].
Sheelanere P., Noble B.F., Patrick R.J. 2013. Institutional requirements for watershed cumulative effects assessment and management: Lessons from a Canadian trans-boundary watershed. Land Use Policy, 30: 67–75.
Sinclair A.J., Doelle M., Duinker P. 2017. Looking up, down, and sideways: reconceiving cumulative effects assessment as a mindset. Environmental Impact Assessment Review, 62: 183–194.
Statistics Canada. 2016. Provincial/territorial boundary file. Boundary files. 2016 Census. Statistics Canada, Ottawa, ON. Available from https://www12.statcan.gc.ca/census-recensement/alternative_alternatif.cfm?l=eng&dispext=zip&teng=lpr_000b16a_e.zip&k=%20%20%20%2027960&loc=http://www12.statcan.gc.ca/census-recensement/2011/geo/bound-limit/files-fichiers/2016/lpr_000b16a_e.zip [accessed 15 March 2021].
Sullivan D., Beveridge M. 2005. Ecological monitoring and reporting: a survey of the Atlantic Coastal Action Program. Environment Canada Sustainable Communities and Ecosystems Division, Ottawa, ON
Theobald E.J., Ettinger A.K., Burgess H.K., DeBey L.B., Schmidt N.R., Froelich H.E., et al. 2015. Global change and local solutions: tapping the unrealized potential of citizen science for biodiversity research. Biological Conservation, 181: 236–244. Available from https://www.sciencedirect.com/science/article/pii/S0006320714004029 [accessed 21 March 2023].
Thompson K.-L., Lantz T.C., Ban N.C. 2020. A review of Indigenous Knowledge and participation in environmental monitoring. Ecology and Society,25(2): 10. Available from https://www.researchgate.net/publication/341123117_A_review_of_Indigenous_knowledge_and_participation_in_environmental_monitoring.
Wilson N.J., Mutter E., Inkster J., Satterfield T. 2018. Community-based monitoring as the practice of Indigenous governance: a case study of Indigenous-led water quality monitoring in the Yukon River Basin. Journal of Environmental Management, 210: 290–298. Available from https://www.sciencedirect.com/science/article/abs/pii/S0301479718300203 [accessed 17 December 2019].
Supplementary material
Supplementary Material 1 (DOCX / 18.9 KB).
- Download
- 18.98 KB
Supplementary Material 2 (DOCX / 13.3 KB).
- Download
- 13.37 KB
Supplementary Material 3 (XLSX / 97.2 KB).
- Download
- 97.30 KB
Supplementary Material 4 (XLSX / 119 KB).
- Download
- 119.88 KB
Supplementary Material 5 (DOCX / 133 KB).
- Download
- 133.58 KB
Supplementary Material 6 (DOCX / 33.9 KB).
- Download
- 33.93 KB
Supplementary Material 7 (XLSX / 2.41 MB).
- Download
- 2.42 MB
Supplementary Material 8 (DOCX / 19.9 KB).
- Download
- 20.00 KB
Information & Authors
Information
Published In
FACETS
Volume 9 • 2024
Pages: 1 - 19
Editor: Yann Joly
History
Received: 31 August 2022
Accepted: 24 January 2024
Version of record online: 11 June 2024
Copyright
© 2024 Authors Kidd, Courtenay, Swanson, and The Crown. This work is licensed under a Creative Commons Attribution 4.0 International License (CC BY 4.0), which permits unrestricted use, distribution, and reproduction in any medium, provided the original author(s) and source are credited.
Data Availability Statement
Data generated or analyzed during this study are provided in full within the published article and its supplementary materials.
Key Words
Sections
Subjects
Plain Language Summary
Improving environmental decision-making: A review of community-based monitoring in Canada
Authors
Author Contributions
Conceptualization: JK, JB, SA
Data curation: JK
Formal analysis: JK
Funding acquisition: SA
Methodology: JK, JB, SA
Project administration: SA
Supervision: SA
Validation: JK, JB, SA
Visualization: JK
Writing – original draft: JK
Writing – review & editing: JB, SC, HS, SA
Competing Interests
The authors declare there are no competing interests.
Funding Information
Global Water Futures: Prairie Water sub-grant
Natural Sciences and Engineering Research Council of Canada: Canada Graduate Scholarship-Master's, Discovery Grant
Metrics & Citations
Metrics
Other Metrics
Citations
Cite As
Jess Kidd, Jeremy Brammer, Simon Courtenay, Heidi Swanson, and Stephanie Avery-Gomm. 2024. Pan-Canadian review of community-based monitoring projects and their capacity to enhance environmental monitoring programs for cumulative effects assessments. FACETS.
9: 1-19.
https://doi.org/10.1139/facets-2022-0192
Export Citations
If you have the appropriate software installed, you can download article citation data to the citation manager of your choice. Simply select your manager software from the list below and click Download.
Cited by
1. Інформаційні та лазерні технології оцінювання киснево-вуглецевого балансу забруднення екологічного середовища