Introduction
Fundamental knowledge of movement ecology of freshwater fishes has become increasingly important for the management, conservation, and recovery of at-risk fishes, especially in areas where anthropogenic stressors are prevalent (
Lucas and Baras 2008;
Favaro et al. 2014;
Castañeda et al. 2021). Fish move in response to external state dynamics (e.g., maintain homeostasis) and internal abiotic and biotic factors (e.g., environmental gradients, competition) of their environment, whereby individuals balance expending resources to move with acquiring sufficient resources to grow and reproduce (
Brownscombe et al. 2017,
2022). The extent and timing of these movements shape population dynamics, structure fish communities, and influence energy pathways (
Nathan et al. 2008;
Brownscombe et al. 2017). Despite acknowledging the importance of fish movement in structuring aquatic communities and facilitating energy flow (
Torgersen et al. 2021), many questions remain regarding the variability in dispersal patterns within and across freshwater fish taxa (
Lennox et al. 2019). Fundamental knowledge of movement ecology of freshwater fishes has become increasingly important for management and recovery of at-risk fishes found in areas where anthropogenic stressors are prevalent (
Favaro et al. 2014;
Castañeda et al. 2021).
Changes in the structure and function of habitat related to climatic and anthropogenic stressors (e.g., linear development, mining, dams) can alter movement patterns of stream fishes or have direct consequences on abundance and recruitment (
Tamario et al. 2019). For migratory stream fishes, alteration or fragmentation of habitat can lead to changes in life history (i.e., migratory to lacustrine or resident;
Nelson et al. 2002), reduction in habitat quality and extent, and declines in abundance and range contraction (
Fuller et al. 2015;
Tamario et al. 2019;
van Puijenbroek et al. 2019). Understanding the prevailing movement patterns of stream fish populations is essential for predicting population responses to environmental change. More specifically, an important question directing management of mobile stream fish is whether populations align with the restricted movement paradigm (RMP), which describes populations as heterogeneous mixes of mostly stationary and few mobile fish, or alternatively if populations are comprised of primarily mobile individuals (
Gerking 1959;
Gowan et al. 1994;
Radinger and Wolter 2014).
The magnitude and extent of effects of stressors on stream ecosystems can fluctuate seasonally, based on the interplay of variations in habitat availability and fish movement dynamics. For example, during the open water season migratory fish found in large, free flowing river networks move long distances between discrete habitats to feed, rear, and reproduce (
Homel and Budy 2008;
Brennan et al. 2019;
Hodgson et al. 2020). Conversely during winter, movements are often shorter and less frequent because this season is more energetically costly for freshwater fishes (
Cunjak et al. 1998;
Shuter et al. 2012;
McMeans et al. 2023). Moreover, during the winter fish often become sedentary because they are forced to occupy a narrow range of habitats, due to severe limitations in the extent and quality of habitat relative to the open water season (
Cunjak 1995;
Brown et al. 2011). Constraints on the distribution of suitable habitat can be amplified across spatio-temporal dimensions (e.g., Dolly Varden (
Salvelinus malma) spawning habitat,
Mochnacz et al. 2020; Pacific Salmon (genus
Oncorhynchus),
Brennan et al. 2019) and emphasizes the importance of understanding the diversity of habitat use and movement patterns throughout the year to mitigate impacts of disturbance on migratory stream fishes (
Tamario et al. 2019).
Bull Trout (
Salvelinus confluentus) are a cold-water char found in North America that exhibit resident, fluvial, adfluvial, and anadromous life history strategies (
Dunham et al. 2008). While populations can occur in lakes, the species is most common in stream networks across its geographic range. Research on the movement of this species suggests that life history diversity exists below the population level (
Bahr and Shrimpton 2004;
Homel and Budy 2008). For example, adult, sub-adult, and juvenile life stages display a broad spectrum of movement patterns (i.e., stationary, mobile) across both temporal and spatial scales (
Muhlfeld and Marotz 2005;
Homel and Budy 2008;
Monnot et al. 2008). Such life history plasticity shapes the distribution of populations at both regional and local scales and facilitates persistence in highly stochastic systems (
Dunham and Rieman 1999). In addition, populations found in large, connected watersheds with minimal perturbations are likely to persist over long time periods (
Dunham and Rieman 1999;
Rieman and Dunham 2000). However, in fragmented systems some populations have either shifted from a fluvial to an adfluvial life history (
Nelson et al. 2002;
Gutowsky et al. 2015,
Al‐Chokhachy et al. 2019), or are in decline (
Schmetterling 2003). Currently, the species is listed as threatened and special concern in Canada and endangered in the United States (
United States Fish and Wildlife Service 1999,
2015;
COSEWIC 2012,
Government of Canada 2021). While our understanding of Bull Trout movement ecology has advanced in the southern and central portions of the geographic range, parallel research is lacking in the north where wild populations exist in minimally perturbed systems (
Mochnacz et al. 2013,
2021).
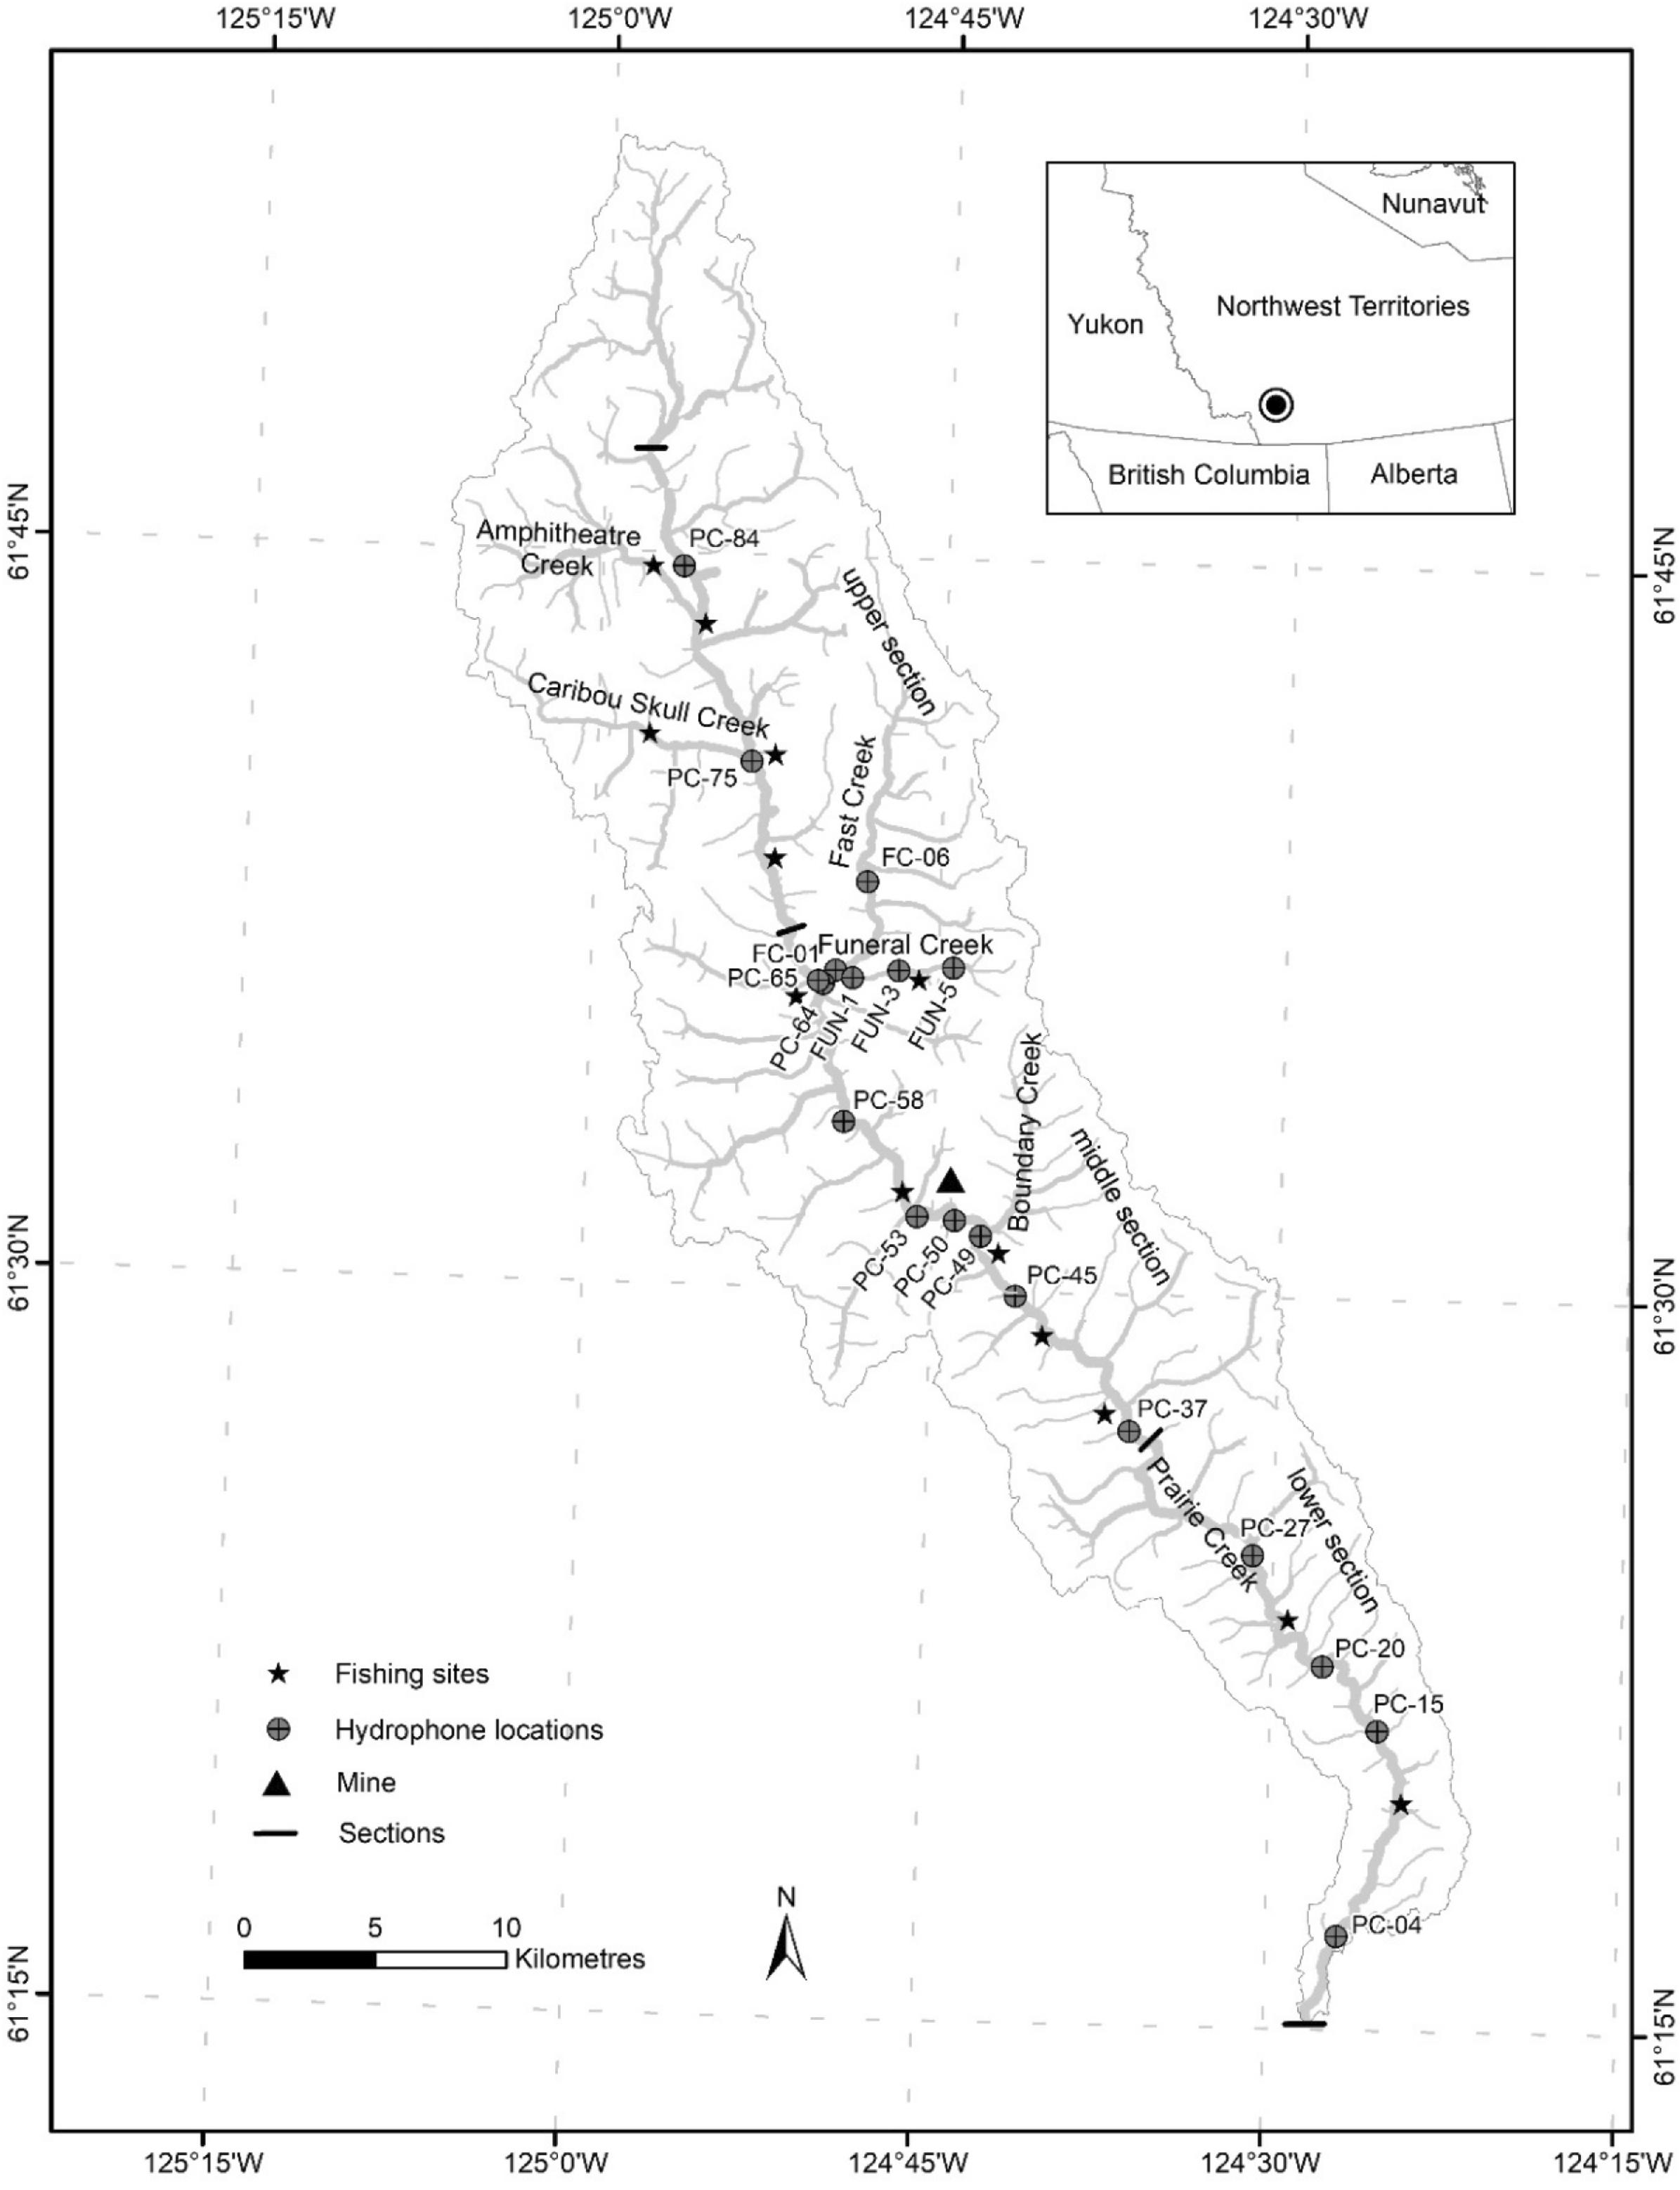
Given northern stream fishes experience short growing seasons and long, cold winters, during which suitable habitat can be spatially limiting (
Reist et al. 2006), we sought to document the year-round movement ecology of Bull Trout in a minimally perturbed and highly connected, northern stream network. We expected that some individuals would make minimal movements, within and across seasons, as a life history strategy to conserve energy in this harsh northern environment. To do this, we used telemetry data from Bull Trout tagged in the Prairie Creek watershed, Northwest Territories (NT), Canada, to describe movements and habitat use patterns of this population and discuss implications for conservation of northern populations.
Results
Of the 54 Bull Trout tagged, 9 (or 17%) were never detected following their release. An additional three fish were detected 2–4 times only within the tagging period (July 18–23 July 2011) and never detected again, so we excluded these fish from our analyses. From the 42 remaining fish, 92 129 detections from a total of 1 179 483 (or <8%) were removed as the time between detections were less than the minimum 35 s tag pulse rate (i.e., the second detection was removed in these cases). The 42 remaining Bull Trout were detected 1 087 312 times with an average of 25 888 times per fish (range 1–201 058 per fish) and ranged in fork length between 288 and 628 mm, while those that went undetected ranged between 293 and 565 mm. The mean fork lengths did not differ between those fish that were detected (345 mm) and those never detected (369 mm) by the array (
t-test:
t = 0.99, df = 14.5,
p = 0.34). For those fish detected, the number of detections per fish was not correlated to fish fork length (Pearson correlation:
n = 42,
r = 0.19,
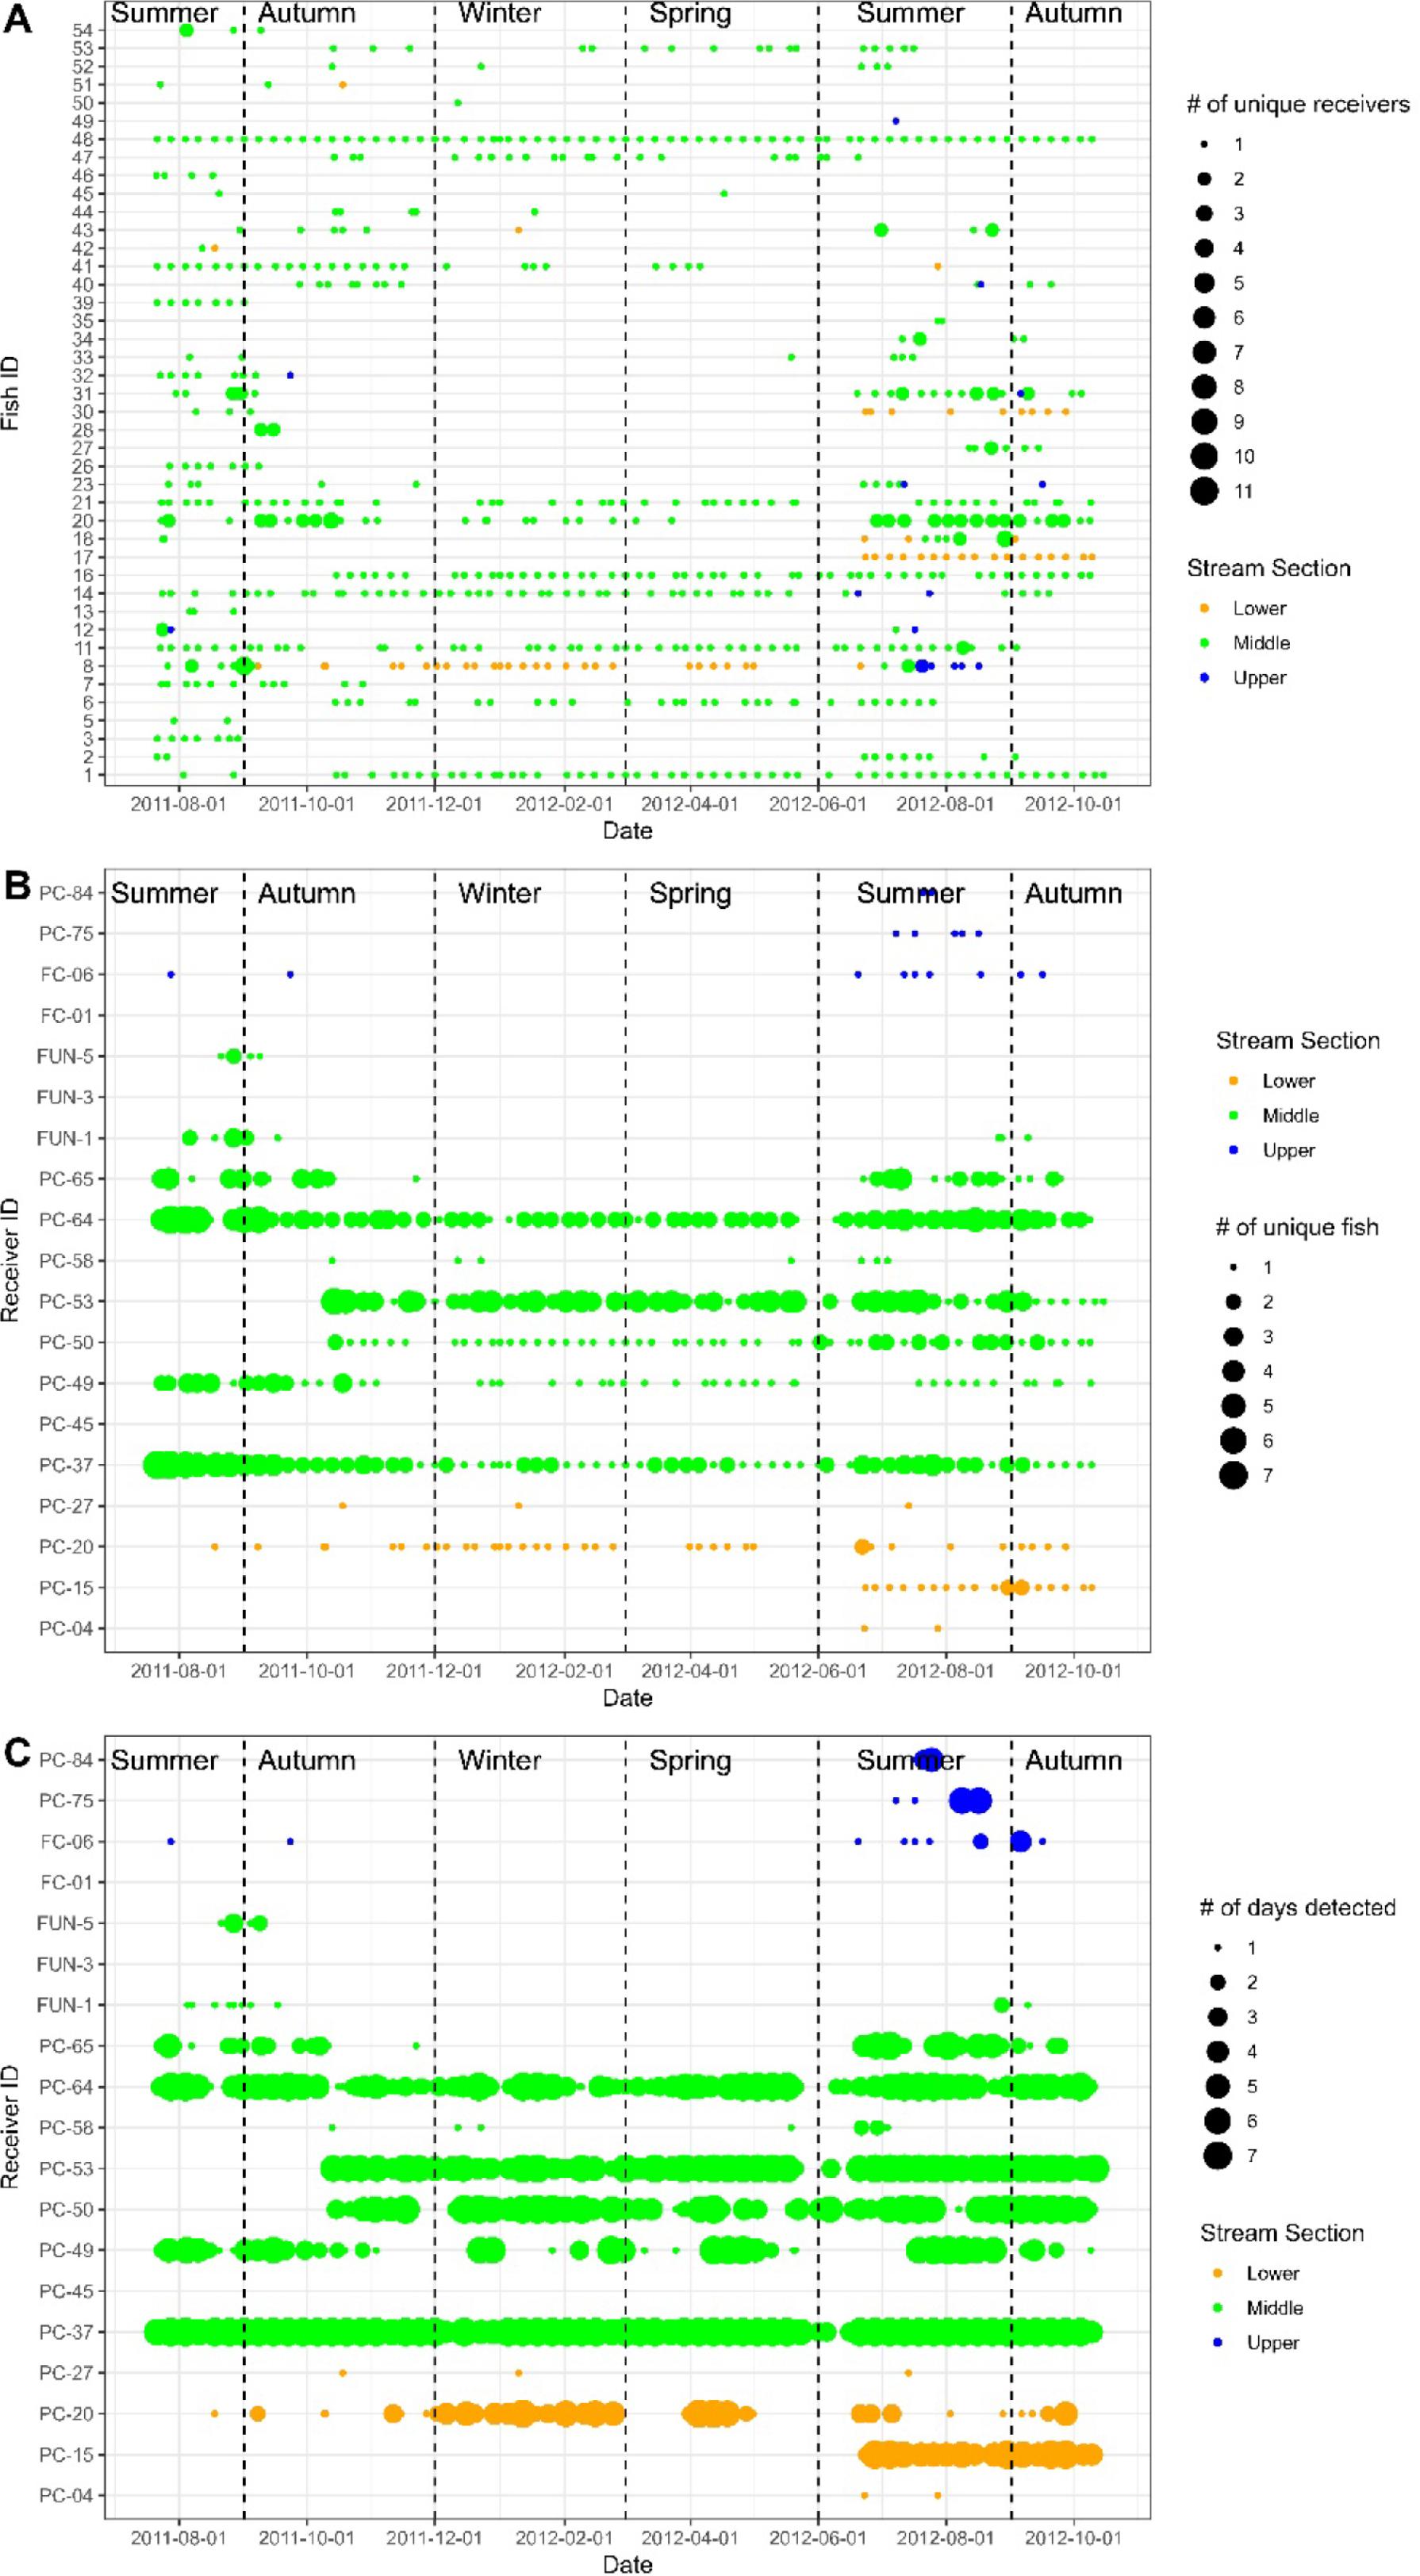
p = 0.23). Fish were detected at 16 of the 19 receivers deployed during the study, but the number of detections varied widely by receiver (range 8–360 599;
Fig. 2).
The 42 fish that were detected displayed high individual variation in movement patterns (
Fig. 2). Some fish (
n = 16 or 38%) were detected traveling total linear distances exceeding 10 km during the study (mean 26.9 km, range 11.7–115.9 km). Another group of fish (
n = 9 or 21%) was detected traveling total distances < 10 km (mean 4.6, range 1.4–9.5 km). The rest of the 42 fish (
n = 17 or 41%) were not detected making any within season movements during the study (i.e., detected at a single receiver within a season). For the fish that were detected moving, they moved an average of 11.5 km (range 0.3–64.9 km per fish) in distance per season.
Spatial distribution
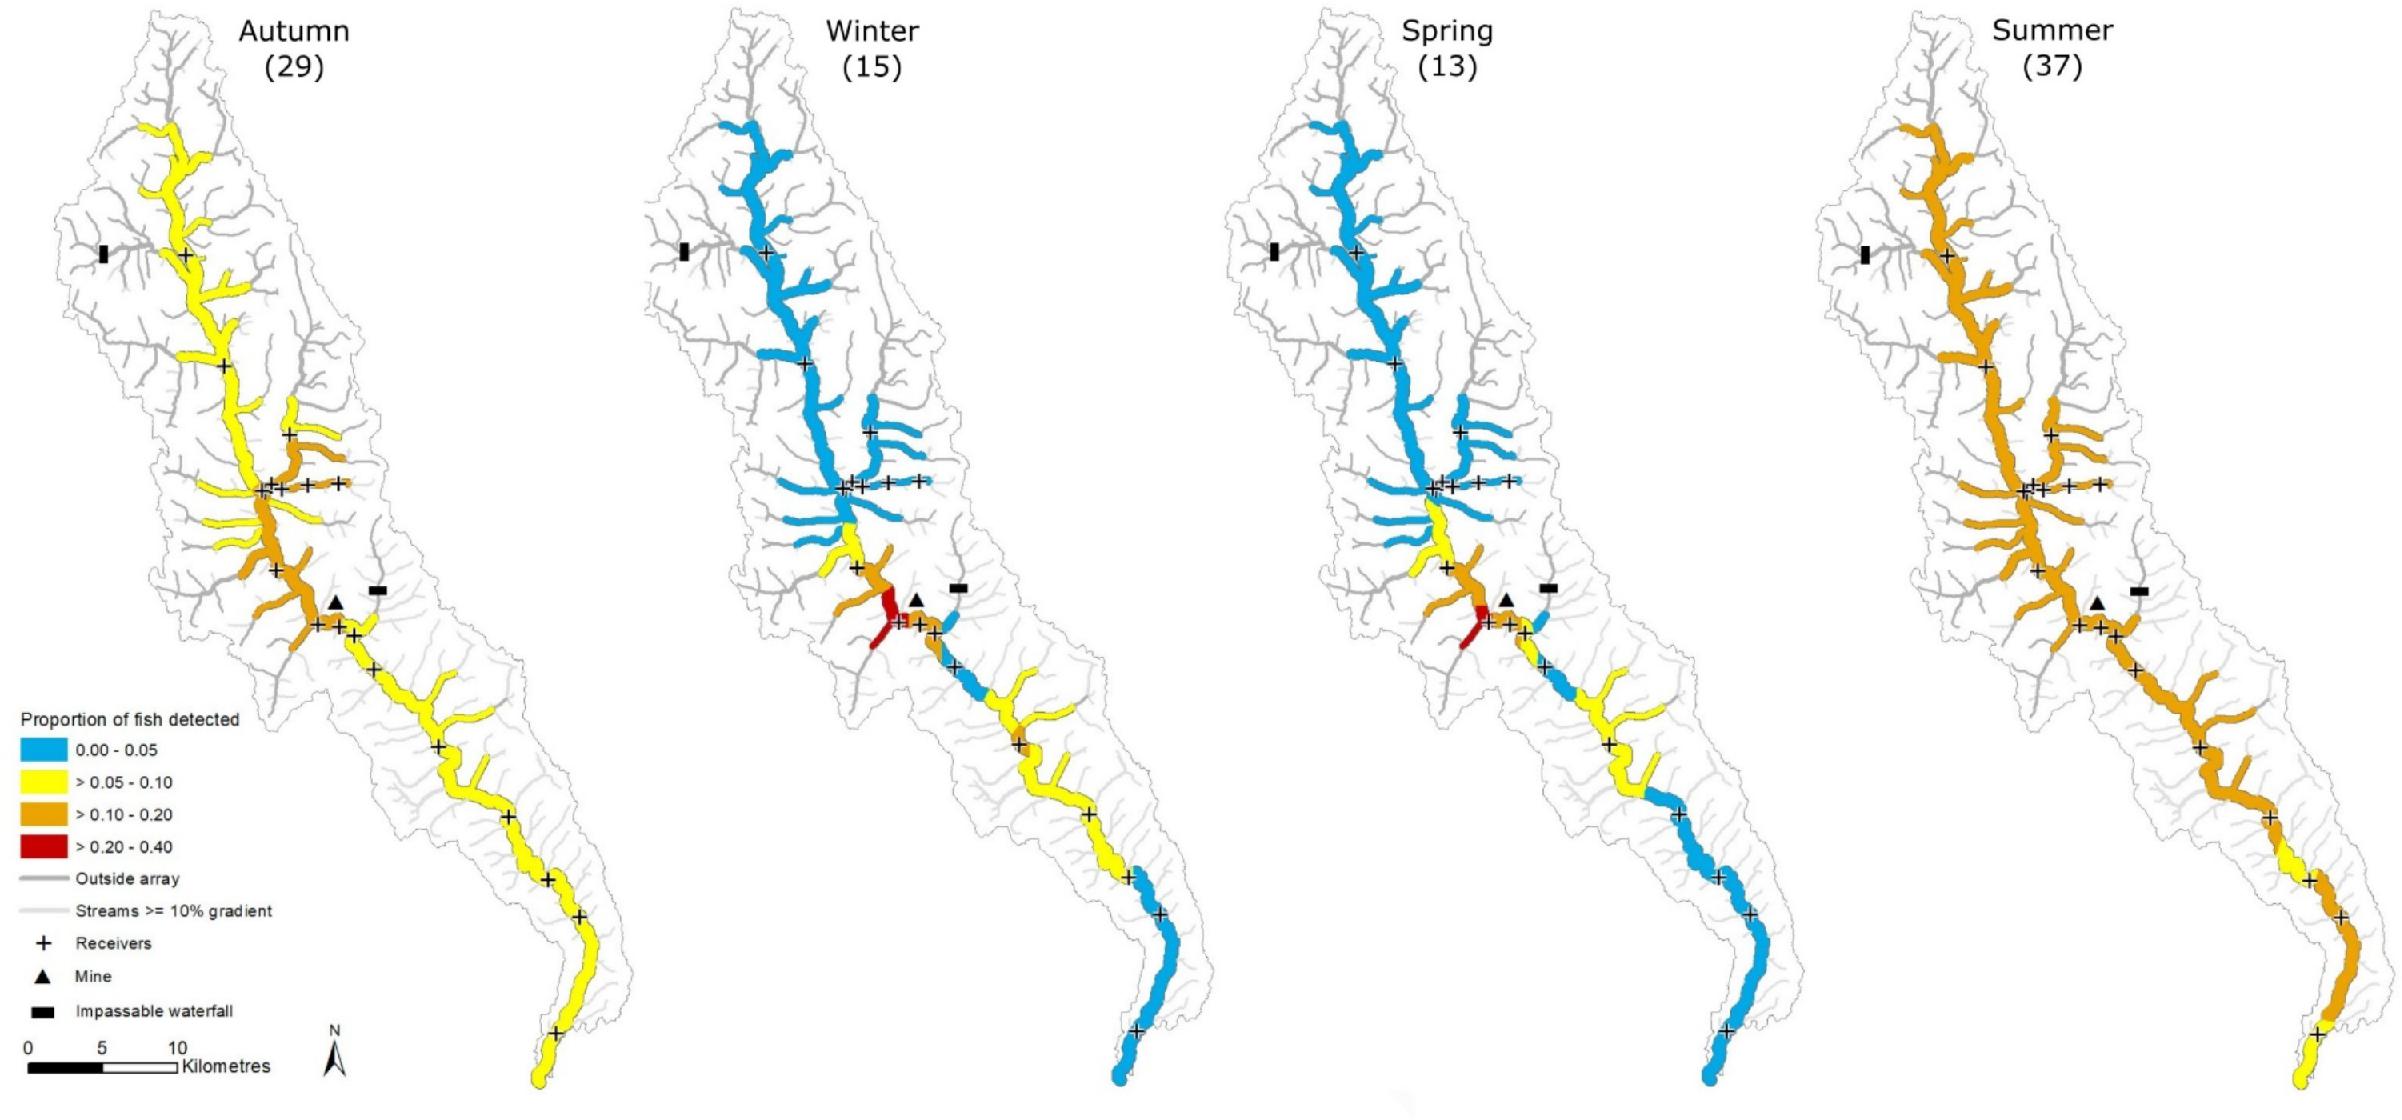
Bull Trout distribution varied seasonally throughout the study (
Figs. 2 and
3). Of the 1 087 312 post-filtered detections, 93.6% occurred in the middle section of Prairie Creek, while only 5.9% and <1% were in the lower and upper sections, respectively (
Fig. 2). Overall, fewer fish were detected in winter (
n = 16) and spring (
n = 14) compared to summer (
n = 39) and autumn (
n = 31) (
Fig. 2). During summer, fish were detected in all sections of Prairie Creek, with six individuals detected in each of the upper and lower sections, respectively, and 37 detected in the middle. During spring and winter, no fish were detected in the upper section and only one and two fish were detected in the lower section during these seasons, respectively (
Figs. 2a and
3). Most tagged Bull Trout stayed within a single section of Prairie Creek (particularly the middle) for the entirety of the study (
Fig. 2a). In fact, only one fish (tag 8) was detected in all three sections of Prairie Creek during the study, and 12 fish were recorded in two sections (
Fig. 2a). Fuzzy Kappa statistics indicated that the greatest spatial similarity in Bull Trout distribution occurred between winter–spring (0.80) and summer–autumn (0.74), whereas the greatest difference between seasons occurred between summer–winter (0.34) and summer–spring (0.33) (
Fig. 3). A larger proportion of fish were detected in tributaries during summer and autumn than in the winter and spring (
Figs. 2 and
3).
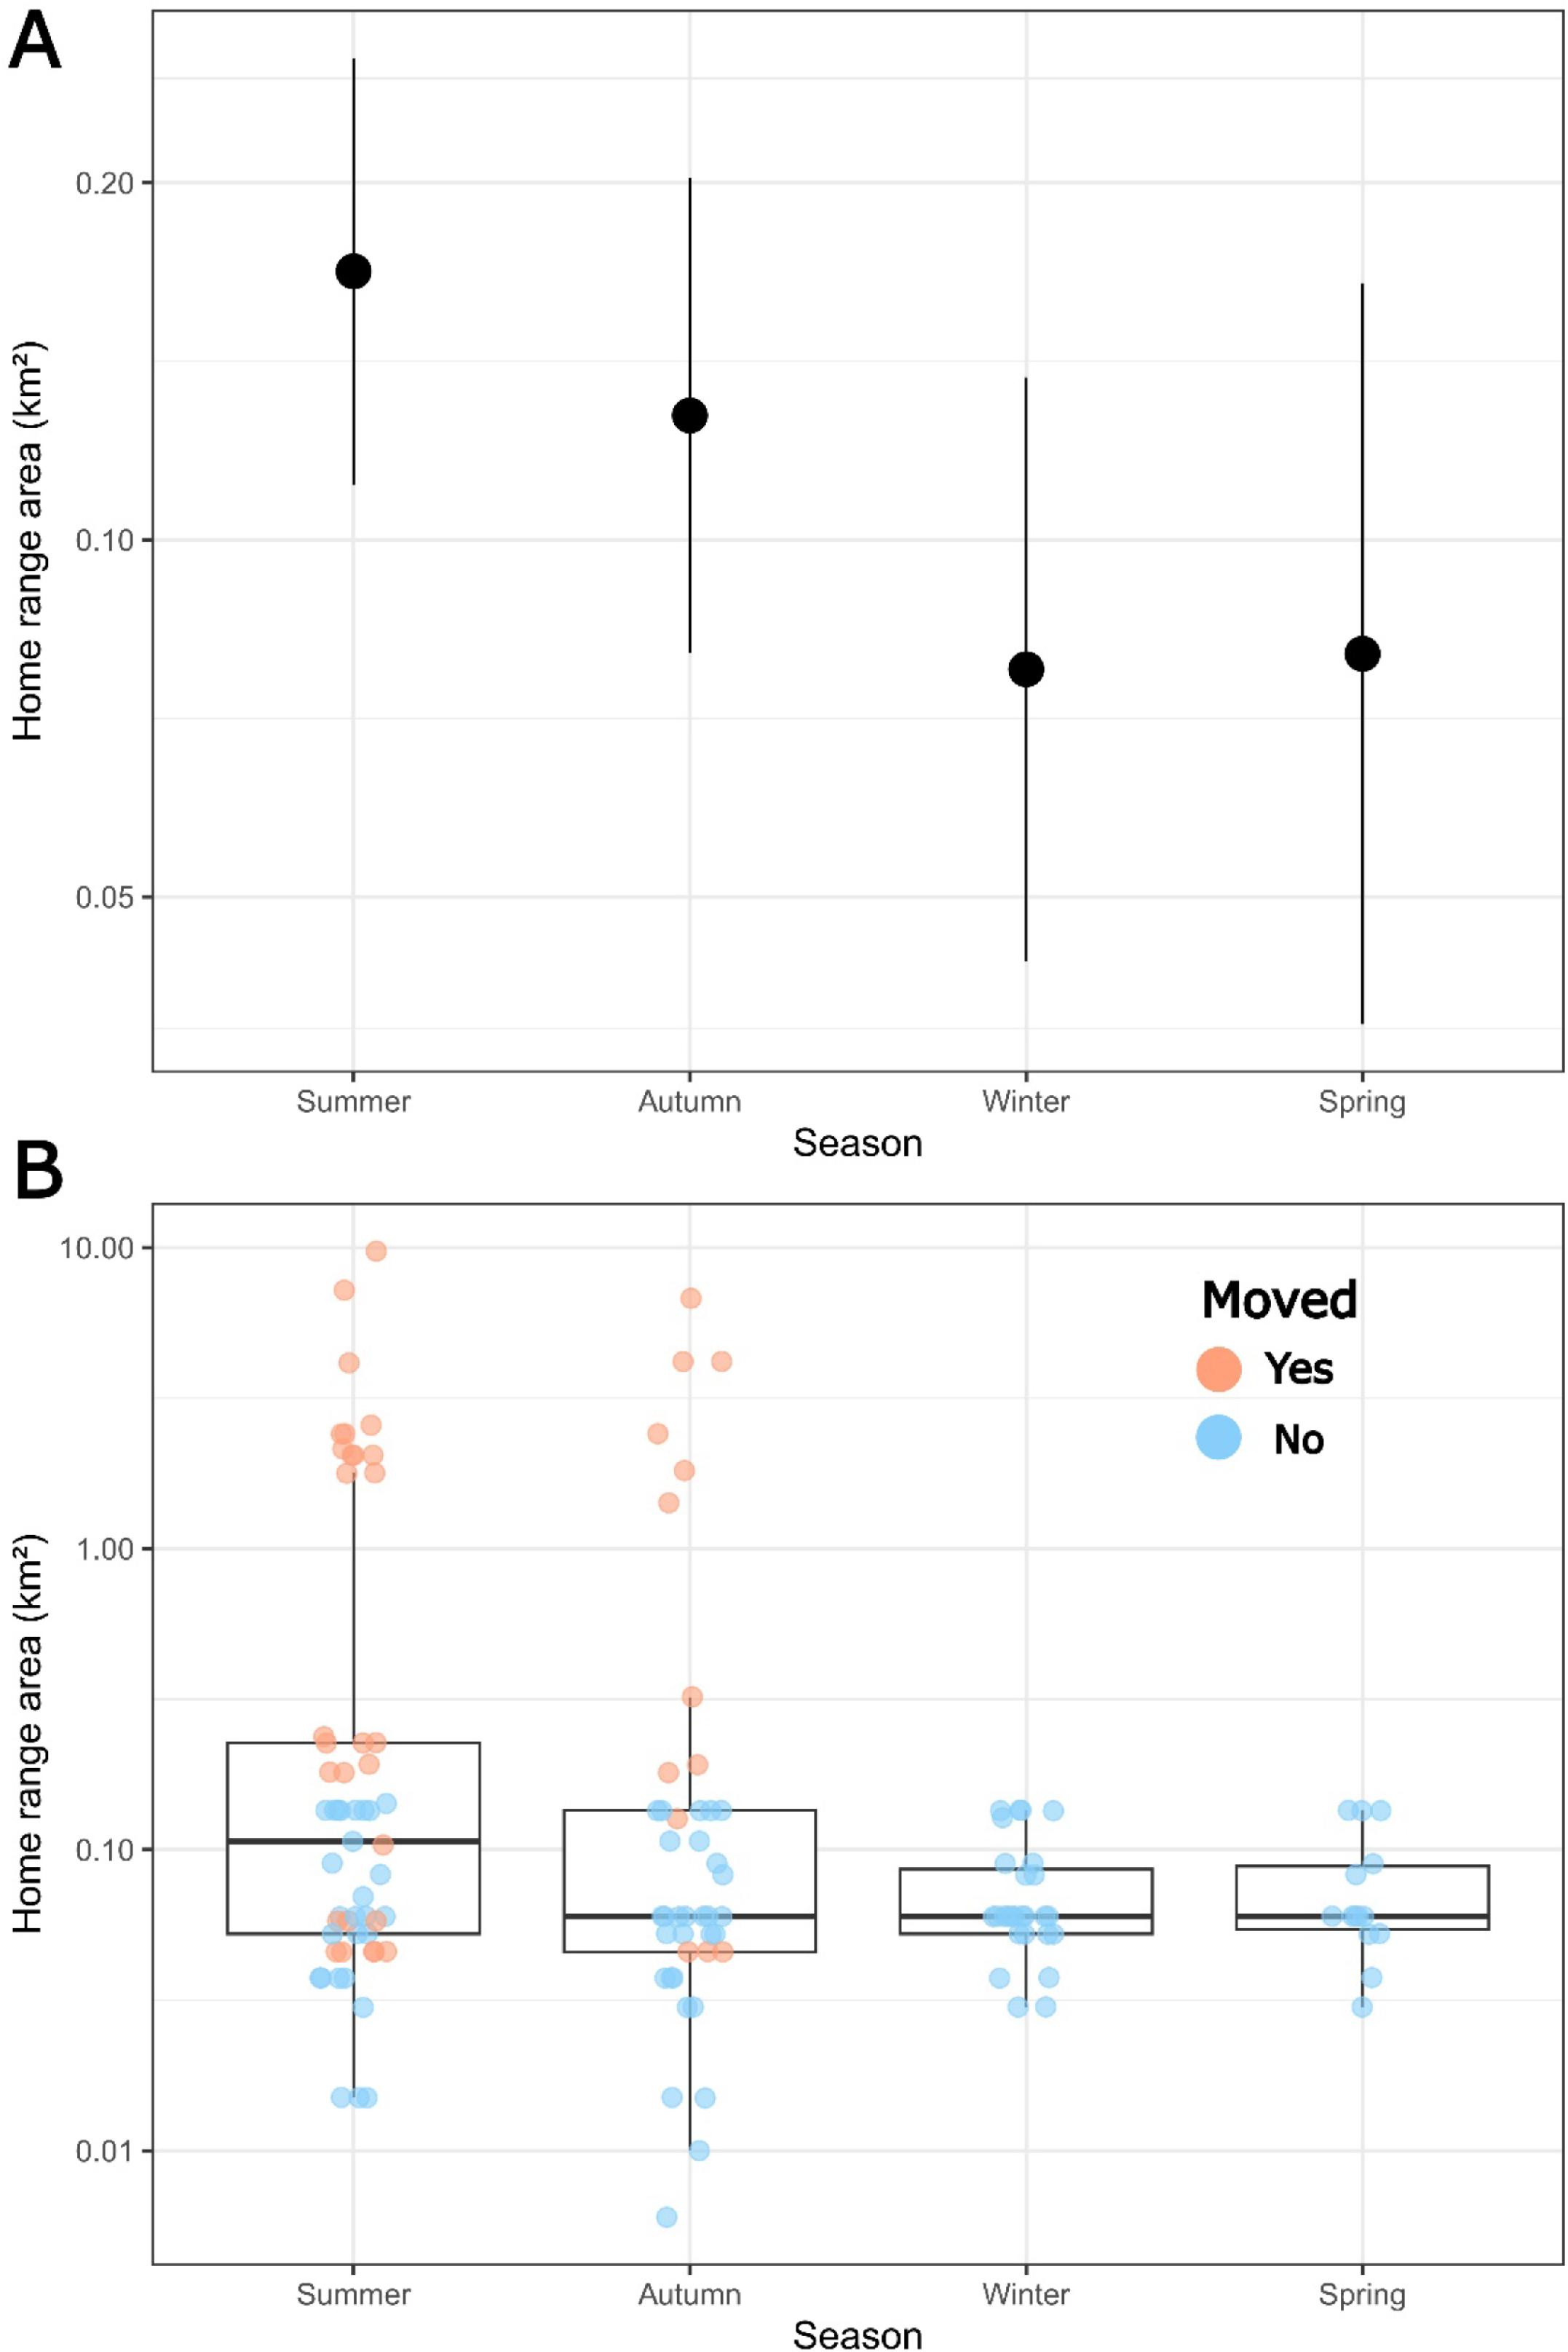
Analysis of variance (ANOVA) tests of fixed factors in the LMM found that season was a weakly significant factor describing differences in the sizes of the home ranges of tagged Bull Trout during the study period (
F3,99.0 = 2.969,
p = 0.04), while fish fork length and study year were not significant (
Table 1). On average, home ranges were largest in summer (marginal mean (95% confidence interval; CI): 0.17 (0.11–0.26) km
2) and autumn (0.13 (0.08–0.20) km
2) and smallest in winter (0.08 (0.04–0.14) km
2) and spring (0.07 (0.03–0.15) km
2) (
Fig. 4a). Pairwise multiple comparison post hoc tests between seasons found that on average summer home ranges were larger than those in winter (
t = 2.57,
p = 0.01) and in spring (
t = −2.15,
p = 0.03). No other significant between-season differences in home range size were found (all
p ≥ 0.1;
Fig. 4). Fixed effects in the LMM only accounted for 5% of total 36% variation in home ranges explained, while the random effects accounted for 31% (
Table 1). Individual seasonal home ranges spanned < 0.01 km
2 to nearly 10 km
2 (
Fig. 4b). The variation between individuals was accounted for mainly by 11 individuals who displayed seasonal home ranges >2 km
2, all of which occurred only in summer or autumn (
Fig. 4b). Notably, two of these individuals (Fish IDs 8 and 43) were found to have home ranges >2 km
2 in both summer and autumn. Larger home ranges in summer and autumn were mainly due to movement only being detected during these seasons (
Fig. 4b).
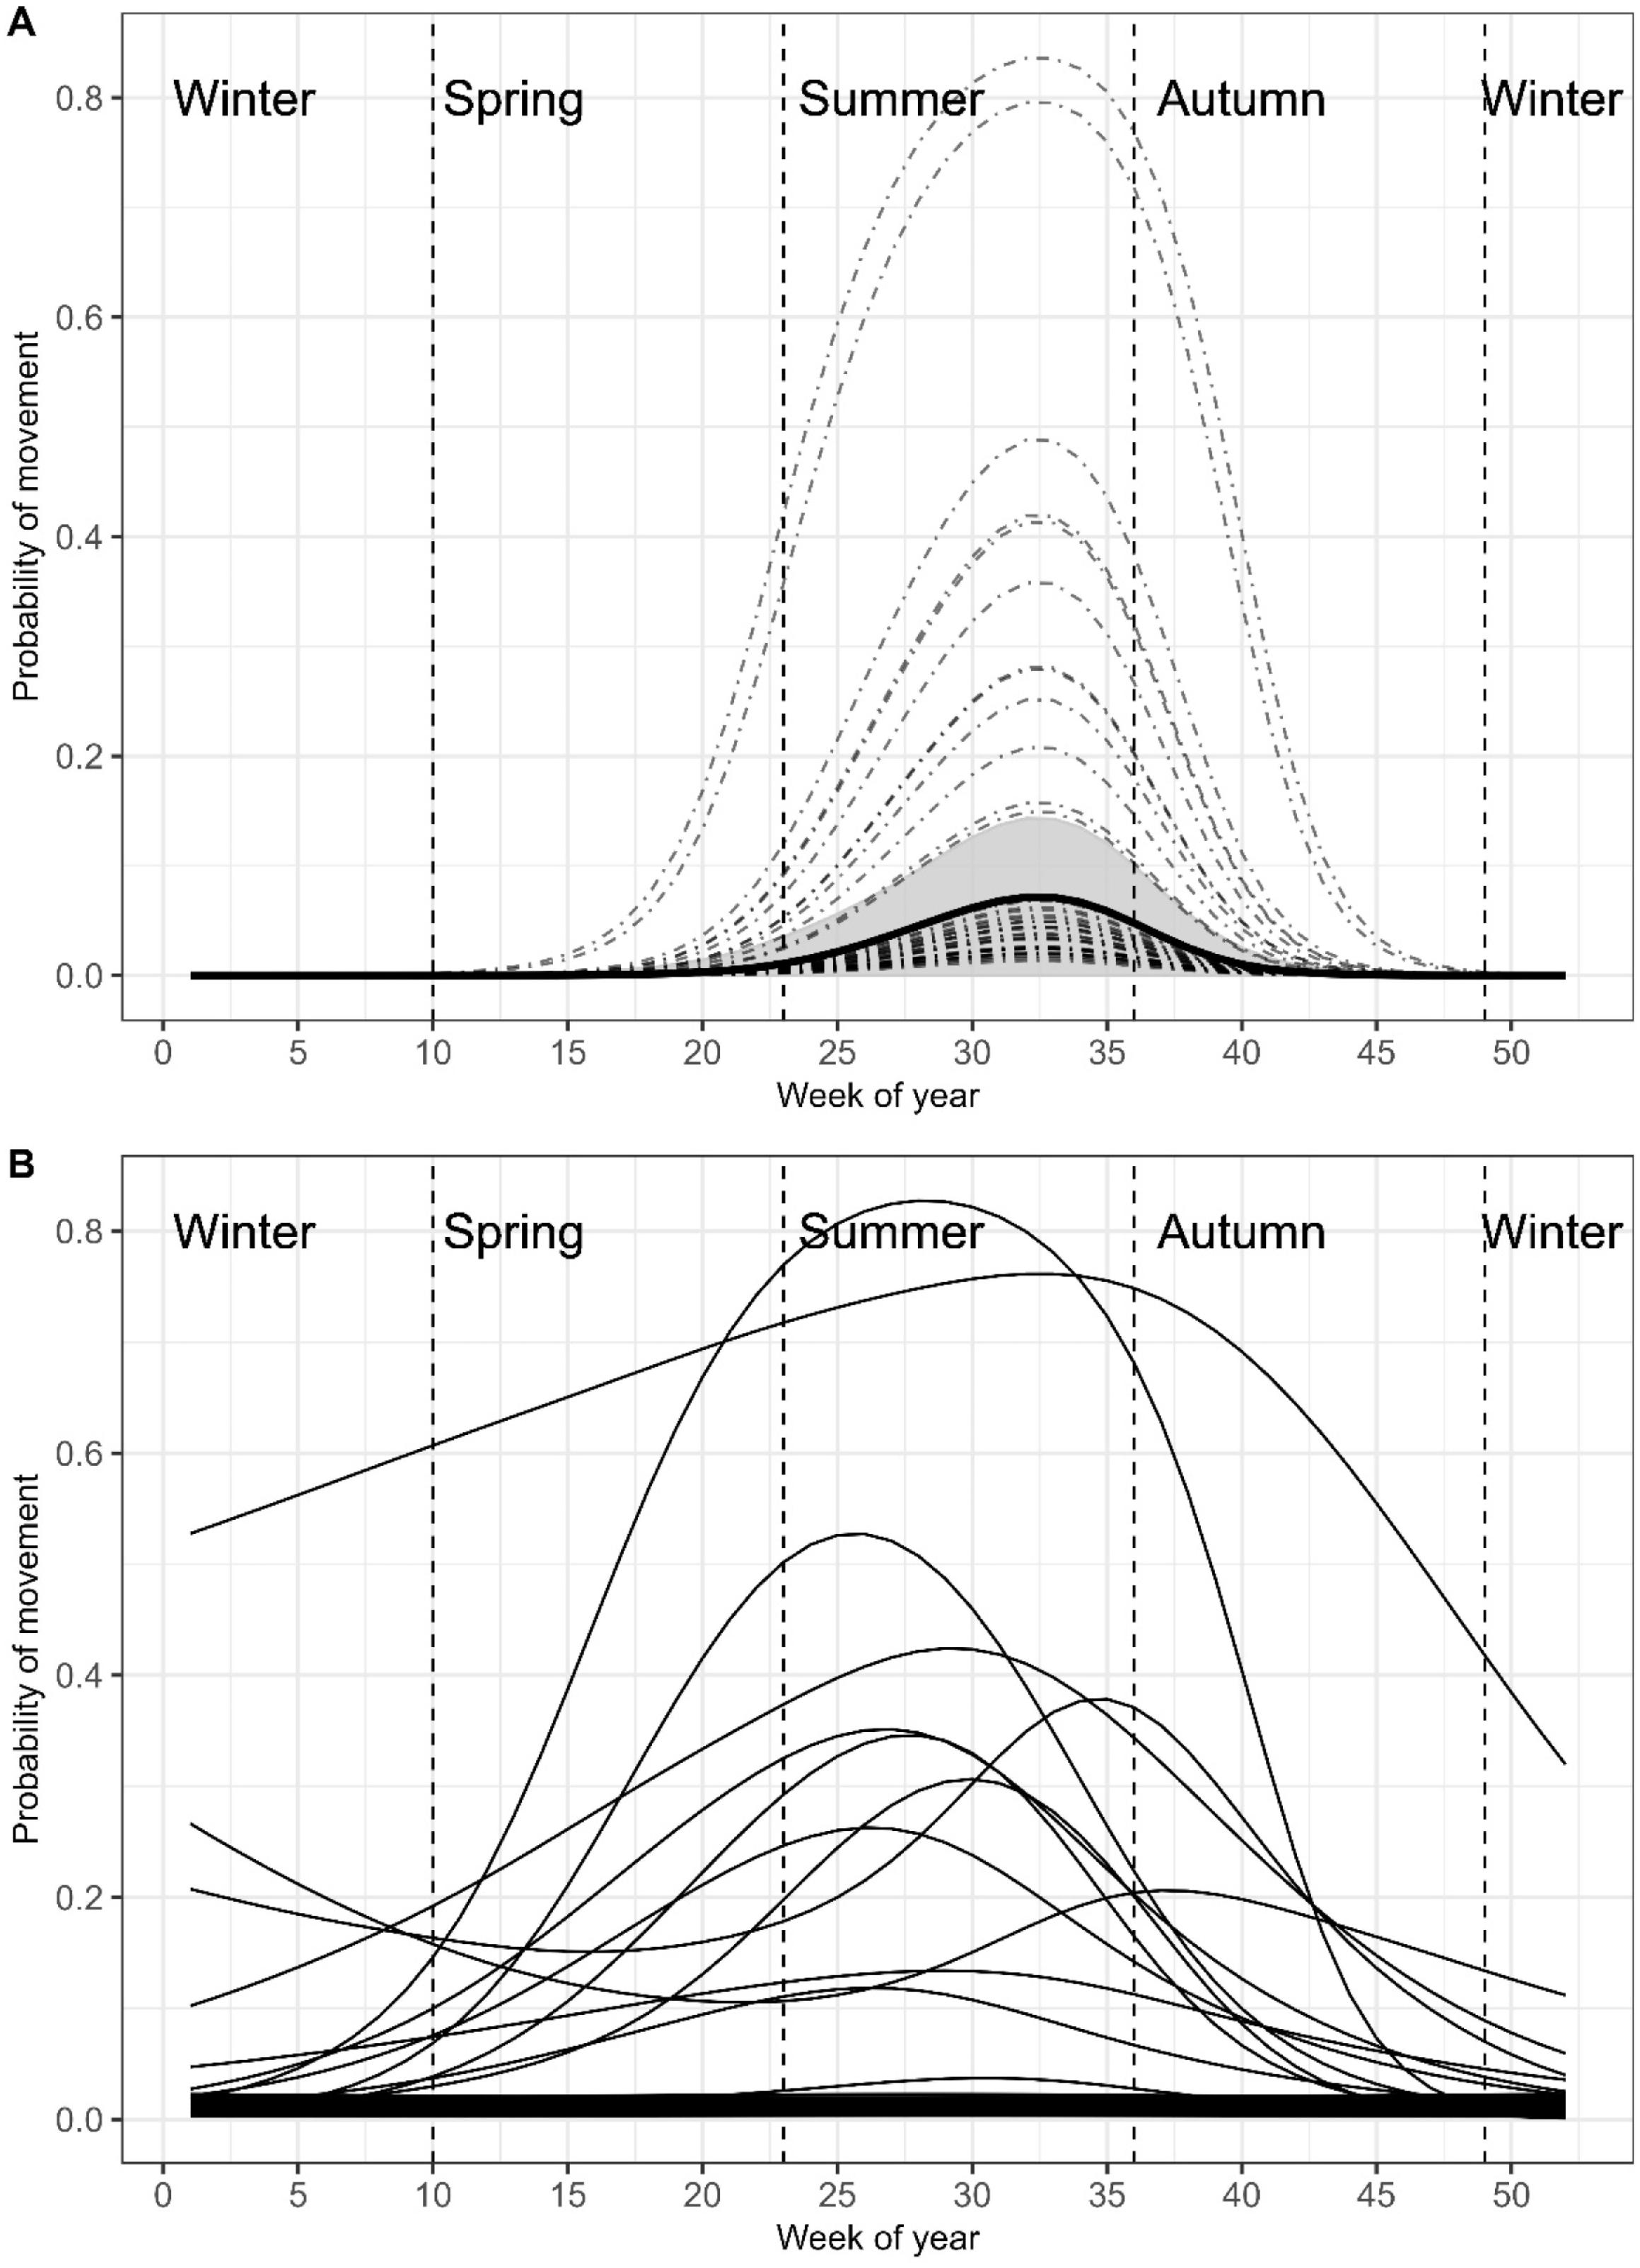
Probability of movement
Bull Trout did not move often during the study, with only 44 instances where an individual fish was detected on more than a single receiver per week (only 6% of unique fish/week combinations;
Fig. 2a). However, there was a significant weekly global trend in the probability of movement that followed a uni-modal pattern beginning in late-spring (GAMM-1 in
Table 1 and
Fig. 5a). On average, detections at multiple receivers were low, with average probability peaking in mid-summer (week 33; 0.08 ± 0.02–0.15, 95% CI) and becoming unlikely by early autumn (week 44;
Fig. 5a). There was no significant effect of body size or year (
Table 1), but there was a significant global weekly effect on movement probability, with the intercepts of the weekly pattern varying greatly between individual fish (
Figs. 2 and
5a). Most fish had negligible movement probabilities throughout the year, 10 fish having low-moderate (20%–50%) peak probabilities, and 2 fish having high peak movement probabilities (>75%). The 44 weekly between receiver movements were made by 13 different individuals, with 18 being made by tag 20, 7 by tag 31, and 5 by tag 8. The rest of the fish that moved only did so two times each (
Fig. 2). In addition to large variation in probability of movement among fish, the timing of the peak probability also varied between fish (GAMM-2 in
Table 1 and
Fig. 5b). Of the 13 fish whose individual movement probability curves were not flat lined at zero, all but one peaked during summer, with one fish peaking in early autumn (
Fig. 5b). Together, results of the random intercept (GAMM-1) and group level smoother (GAMM-2) GAMMs both indicate that probability of movement was on average greatest in summer with a large degree of individual variation in peak probability existing between tagged fish.
Bull Trout made even fewer large scale movements between the lower, middle, and upper sections of the Prairie Creek watershed. At a weekly scale, only five between section movements occurred, three in summer and two in autumn. At the seasonal scale, fish traversed between sections 12 times, with eight trips occurring in summer and the remaining four in autumn. No between-section movements were detected in spring or winter (
Fig. 2).
Discussion
Using acoustic telemetry, we observed large individual variation in movements and spatial distributions of Bull Trout in Prairie Creek, NT corresponding to two groups. The first group exhibited the greatest seasonal variations in habitat use, moving most (range 11.7–115.9 km) and occupying the largest home ranges in summer and autumn, while exhibiting little movement during winter and spring. The second group made negligible movements within and across seasons and resided in localized areas. The average distance that fish traveled within a season was 11.5 km (range 0.3–64.9 km per fish). Movements outside late summer and early fall migrations were limited in spatial extent, suggesting individuals were able to fulfill their seasonal habitat requirements (e.g., foraging, overwintering) in relatively short river reaches of Prairie Creek or tributaries. High site fidelity, small home ranges, and stationarity for long periods by many individuals aligns with the RMP; however, evidence of this life history strategy should be viewed cautiously, given the capability of our hydrophone array to detect small-scale movements (<10 km). We encourage others to formally test the RMP hypothesis in other northern Bull Trout populations to determine if the life history we describe for the Prairie Creek Bull population represents a regional divergence from more southerly populations.
We observed a large degree of individual variation in movement, where most tagged Bull Trout (62%) exhibited negligible or low movement, while the remaining fish (38%) moved greater distances. All of the within-season movements took place in summer and autumn. The strong seasonal effect on movements in the Prairie Creek watershed is consistent with patterns reported in other Bull Trout populations (
Bahr and Shrimpton 2004;
Starcevich et al. 2012;
Chudnow 2021). Despite similar timing of movements, the fish tagged in our study traveled considerably shorter distances and had much smaller home ranges than reported elsewhere (Salmon River,
Schoby and Keely 2011; Columbia-Snake rivers,
Starcevich et al. 2012; Fraser River,
Chudnow 2021). Although body size is acknowledged as a strong predictor of home range size (
Burbank et al. 2023), it was not a strong predictor in our study, which aligns with other telemetry studies on adfluvial and fluvial Bull Trout (
Schoby and Keeley 2011;
Gutowsky et al. 2015). Interestingly, water body size has emerged as a strong predictor of home range size in lotic fishes (
Burbank et al. 2023) and could partly explain the disparity in home range size between our study and those done in much larger watersheds (e.g., Fraser River,
Chudnow 2021; Kinbasket Reservoir,
Gutowsky et al. 2015).
The large proportion of small movers relative to large movers (∼2:1 ratio) we observed in Prairie Creek differs from what others report (7%,
Starcevich et al. 2012; 22%,
Chudnow 2021) and may reflect a life history adjustment to maximize growth opportunities in a barren northern watershed. Prairie Creek differs from more southerly stream systems (<60°N) in the following ways: it has a less abundant and patchy fish community; a smaller proportion of spawning, rearing, and winter habitat in tributaries (
Mochnacz et al. 2021); and has longer (8 months), colder winters (mean air temperature = −19.5 °C) and shorter growing seasons. Given these differences, it is possible that fish move less often and shorter distances because higher energetic costs of longer movements do not yield higher foraging opportunities (
Brownscombe et al. 2022). Occupying areas with higher flow in mid to lower reaches of Prairie Creek could be more energetically profitable than upstream reaches and tributaries, where riparian vegetation is particularly sparse and prey species are rare (N.J. Mochnacz, unpublished data) (
Kawaguchi and Nakano 2001;
Allan et al. 2003;
Tank et al. 2010). Additionally, completing all life processes (spawning, feeding, and rearing) in small areas (e.g., <10 km reach) requires fish to expend less energy migrating longer distances to reproduce. Other chars commonly exhibit similar life history plasticity to optimize growth and persistence in unique environments (
Klemetsen 2010;
Chavarie et al. 2016).
Few and short movements of tagged Bull Trout in Prairie Creek implies high habitat specificity throughout the year, despite having access to a broad suite of streams across this watershed. Such restricted movement has several plausible explanations. First, the most energetically profitable habitats (prey bearing, thermally optimal) are not wide-spread throughout the year in stream networks (
Armstrong et al. 2021) and these habitats are even more sparsely distributed across sub-Arctic watersheds (
Prowse et al. 2006b;
Reist et al. 2006). In the Prairie Creek watershed, the availability of suitable spawning and rearing is much lower than similar stream systems further south where this species occurs (
Rich et al. 2003;
Rodtka et al. 2015;
Mochnacz et al. 2021). Consequently, our results suggest that Bull Trout are able to fulfill all life cycle requirements in short reaches of the middle and lower sections of Prairie Creek and some tributaries. Second, individuals may seek to inhabit areas that lack predators. However, predation pressure seems unlikely to restrict movement in Prairie Creek because Bull Trout are the apex aquatic predator in this system (
Mochnacz et al. 2021). Lastly, it is possible that many of the fish we tagged did not move to spawning locations because they were not mature or did not spawn during our study. The latter (alternate year spawning) is commonly seen in Bull Trout populations, including this one (
Johnston et al. 2007;
Mochnacz et al. 2013;
Chudnow 2021). Similar full year residence in local areas has been observed in other populations, but far less frequently than what we report (
Starcevich et al. 2012;
Chudnow 2021).
Habitat specificity was most pronounced during the winter where fish were seldomly observed moving even small distances (>1 km), and most fish resided in the middle section of Prairie Creek. Others report similar lack of movement during winter (
Bahr and Shrimpton 2004;
Starcevich et al. 2012;
Chudnow 2021), but to our knowledge this is the least amount of movement reported during the winter for any fluvial population across the geographic range. Such limited movement in Prairie Creek could be driven by limited availability of suitable winter habitat, also seen in stream networks south of 60°N, but exacerbated by extreme winter conditions in sub-Arctic river systems (
Prowse et al. 2006a). Recent research in this watershed demonstrates that the availability of thermally viable winter habitat is severely limited by ice conditions in tributaries (
Mochnacz et al. 2023) and emphasizes that Prairie Creek serves as an essential winter habitat for this population. As latitude increases the availability of viable spawning and overwintering habitat becomes even more limited for ecologically similar species (
Dunmall et al. 2016;
Mochnacz et al. 2020). Another important contextual consideration is that winter movement ecology is not well-reported for this species (
Al-Chokhachy et al. 2010), due to the challenge of collecting data during winter—a common problem that limits the depth of knowledge on movement patterns for many fishes in North America (
Brown et al. 2011;
Shuter et al. 2012). Therefore, the limited movement we report for the Prairie Creek population could be common for this species in the winter but not well-documented across the geographic range.
Of the 54 fish tagged in this study, 42 were relocated, while 12 (22%) were either not detected by the array or detected a few times immediately following tagging and never again. There were also a number of fish detected a few receivers (2–4) throughout the study but had large gaps (weeks to several months) in their detection history. There are several possible explanations for nondetection of some tags. First, failing to detect some proportion of fish after tagging is common due to mortality, tag loss, or tag malfunction. In other telemetry studies on Bull Trout, nondetection after tagging ranged between 13% and 45% (
Schoby and Keeley 2011;
Gutowsky et al. 2015;
Chudnow 2021) and our results fall well within this range. Second, the ability of our array to detect movements was limited by the spatial arrangement (on average ∼10 km between receivers), rate of movement, and detecting environment. For example, there were three fish that were detected by our array immediately following tagging and then never detected again. These fish either moved to local areas not capable of detection by our receiver array (e.g., moved into tributaries or between receiver detection ranges), or they migrated downstream at a rapid rate without being detected and moved into the South Nahanni River. Even in larger river systems, where hydrophones are presumably detecting tags more effectively because they are in better receiving environments (i.e., less noise), nondetection rates are similar to what we observed (16% nondetection,
Gutowsky et al. 2015), providing confidence in our findings.