The changing agricultural landscape in Canada’s Mixedwood Plains Ecozone (2011–2022) and the implications for biodiversity
Abstract
The prairies and savannahs historically found in the Mixedwood Plains Ecozone have been largely converted into farmland, the dominant present-day land cover. Consequently, many species native to these grasslands have shifted to inhabiting suitable agricultural lands. More recently, agricultural intensification has led to the conversion of pastures and hay fields to annual crops, further removing habitat suitable for the persistence of grassland species. We quantified the shift from pasture and forage to annual crops as well as the dynamics among agricultural lands and other land covers in the Mixedwood Plains Ecozone, predicting biodiversity implications by providing a case study on Eastern Meadowlark (Sturnella magna (Linnaeus, 1758)). The total agricultural land area changed little over the study period, but area of pasture and forage decreased while row crop area increased. The loss of agricultural lands to urbanization was partly offset by the conversion of forests and wetlands; however, the farmland gained was of lesser agricultural quality than the farmland lost. Declines in Eastern Meadowlark abundance correlated significantly with carrying capacity loss, suggesting that habitat availability is a limiting factor for this species. We highlight the importance of land management policies to minimize the impacts of land conversion on biodiversity and agricultural production.
1. Introduction
The agricultural landscape in Canada changed dramatically over the last half of the 20th century, shifting from extensive to more intensive agriculture, as global agricultural industrialization drove improvements in mechanization, plant breeding, farm consolidation, irrigation, increased use of nutrients and pesticides, and shifts to intense livestock management (Parson 1999). While these changes have vastly increased the productivity of farmland, they have come at a cost to environmental sustainability. For example, advances in plant breeding have made it possible to grow crops such as soy at more northerly latitudes (Government of Canada 2017), expanding the area of native habitat that could be converted to farmland; an estimated 65%–70% of Canada’s suitable agricultural lands were converted from natural areas by the 21st century (Gauthier and Wiken 2003).
Agricultural intensification is recognized globally as a significant driver of biodiversity loss (Dudley and Alexander 2017; FAO 2019, 2020; IPBES 2019) and wildlife distributions (Fontaine et al. 2017), suggesting that changes to on-farm practices and agricultural policies may have important wildlife conservation effects. We use publicly available spatial data to measure recent changes in agricultural land use in Canada’s Mixedwood Plains Ecozone to estimate native biodiversity impacts.
Canada’s Mixedwood Plains Ecozone extends from its southern and western edges in Ontario along Lakes Huron, Erie, and Ontario, and the St. Lawrence River and extends into southern portions of Quebec along the St. Lawrence lowlands (Crins et al. 2009). Agriculture is the dominant land cover, comprising 55% of the land area (calculated from Natural Resources Canada (2020) not including open water). As a result, the ecozone is one of Canada’s main agricultural regions and it contains 34% of Canada’s farms (based on intersecting Census of Agriculture consolidated subdivisions; Statistics Canada 2021a) and 14% of Canada’s farmland (calculated from Natural Resources Canada 2020). The region accounts for the majority of Canada’s corn, soy, and dairy production (Statistics Canada 2018, 2021a, 2023). The Mixedwood Plains Ecozone is also densely settled—home to approximately 20.1 million people in 2021, an increase of 10.4% since 2011 (Statistics Canada 2021b, 2022a).
Despite the high level of human disturbance in the Mixedwood Plains Ecozone, it remains an ecologically diverse area of Canada where remnant forests and wetlands provide habitat for thousands of plant and animal species. Historically the ecozone was a mosaic of forests, wetlands, alvars, freshwater ecosystems, and, in the southwest, tallgrass prairies and savannahs (Crins et al. 2009), most of which have been converted to urban and agricultural lands (Natural Resources Canada 2020). Tallgrass prairie and savannah habitat are among the most threatened and rare ecosystems within the ecozone and are estimated to currently cover less than 3% (as of 1992) of their historic extent (Environment Canada 2010). These prairies and savannahs would likely have been habitat for many grassland specialists that as native grassland habitat was converted, likely either disappeared from the landscape or adapted to using suitable farmland. At present, with the near-total loss of native grassland habitat in the ecozone, grassland species that rely on suitable farmland habitat such as pastures and hay fields face a renewed threat from the decline of perennial crops.
The Eastern Meadowlark (Sturnella magna (Linnaeus, 1758)) is one such grassland species that inhabited the tallgrass prairies of the Mixedwood Plains Ecozone prior to European arrival (Askins 1999). Meadowlarks were able to benefit from the expansion of pastures and hay fields across southern Ontario and Quebec during the 19th century, but are currently in decline (COSEWIC 2011) and listed as Threatened by Canada’s Species at Risk Act and Ontario’s Endangered Species Act. Declines have been primarily attributed to habitat loss by means of conversion of pastures and hay fields to row crops, reforestation, urbanization, earlier and more frequent mowing of hay, predation and parasitism, habitat fragmentation, and pesticide use (COSEWIC 2011). The lack of remaining native habitat in the ecozone means Eastern Meadowlarks face regional extirpation if suitable farmland habitat is not conserved or grassland habitat restored.
Data from Statistics Canada’s Census of Agriculture show that farmland area in Ontario and Quebec has decreased from 8.5 million ha in 2011 to 7.9 million ha in 2021 (Statistics Canada 2022b), the equivalent of losing 154 ha of farmland per day. This oft-cited farmland loss has been primarily attributed to the increasing human population and associated urban sprawl (AgMedia Inc. 2014; Ontario Farmland Trust 2022; CBC News 2023). Similarly, the Institut de la statistique du Québec reported a loss of 440 000 ha of farmland in Quebec during the 2000s and 2010s (Institut de la statistique du Québec 2023). Historical census data reveal that this trend is not new, with the total farmland area having declined by 44% in Ontario from the 1920s to the 2000s and 51% in Quebec from the 1950s to the 2010s and the number of farms having declined by 74% in Ontario and 78% in Quebec during the same time periods (Smith 2015; Ruiz 2019). Smith (2015) also showed that, in Ontario, the overall cropland area has been stable since the 1920s but that conversion from perennial pastures to annual crops has occurred. However, the Census of Agriculture reports farmland area as all lands on farms, including wetlands and forests, rather than lands actively in use for agriculture, thus obscuring habitat conversion. When lands not actively in use for agriculture are removed, the census shows a more moderate loss of 98 000 ha—from 5.9 million ha in 2011 to 5.8 million ha in 2021, or 27 ha per day in Ontario and Quebec. The census data also do not inform the dynamics among agriculture and other land cover types, such as urban lands, forest, and wetlands. We aimed to address the shortcomings of the Census of Agriculture data by assessing agricultural land change in the Mixedwood Plains Ecozone using land cover datasets derived from remotely sensed data. Previous studies have also examined land change in the Quebec portion of the Mixedwood Plains Ecozone using remotely sensed data or aerial photographs (Jobin et al. 2010, 2014; Dauphin and Jobin 2016; Drapeau et al. 2019). However, the most recent study periods were from 1993 to 2001 (Jobin et al. 2010) and 1993 to 2014 (Drapeau et al. 2019); the former assessed land use and relative change at an ecoregion scale and land change dynamics at a 1 km resolution, while the latter assessed agricultural land change at a bioclimatic zone scale, similar to the ecoregion scale.
The ability to assess land cover using remotely sensed data has improved in recent years. Multiple publicly available land cover datasets are available in Canada that identify agricultural land as well as distinguish among types of agriculture. We used the best available datasets to assess land cover change with respect to the agricultural landscape in the Mixedwood Plains Ecozone. We quantified the shift from perennial pasture and forage (hereafter referred to as pasture/forage) to annual row crops as well as conversion from agriculture to and from other land cover types. We hypothesize that the shifting agricultural landscape affects biodiversity and provide a case study quantifying the potential implications on the threatened Eastern Meadowlark population, comparing modelled carrying capacity to changes in abundance reported by a breeding bird atlas.
2. Methods
2.1. Study area and period
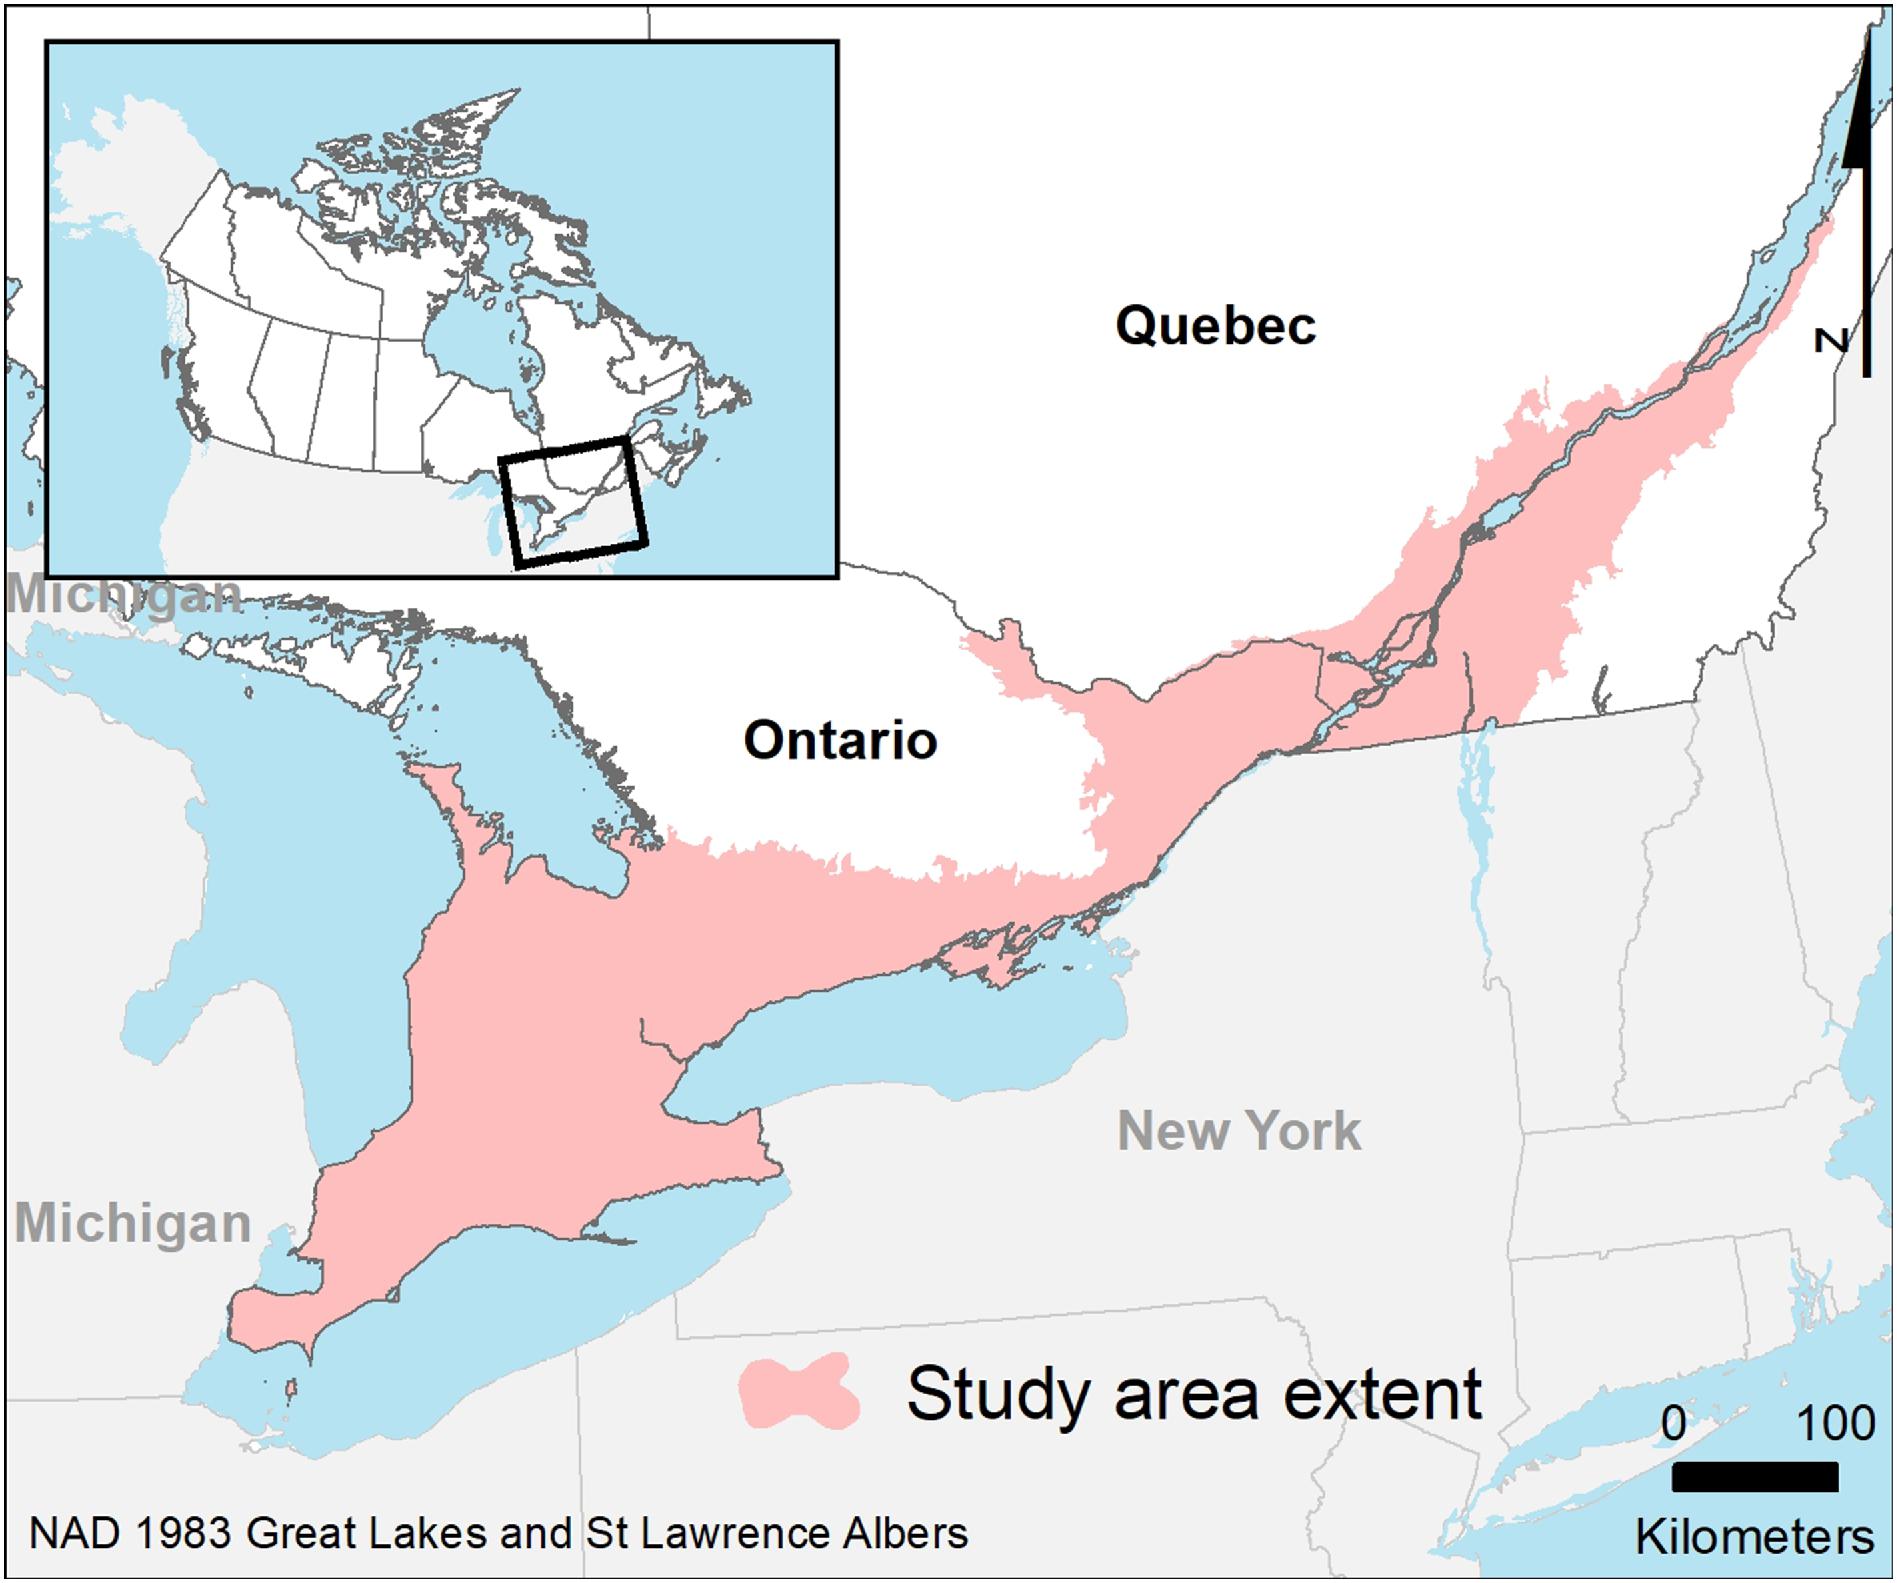
The study area was the Canadian portion of North America’s Mixedwood Plains Ecozone, an 11.3 million ha area of land and freshwater that stretches from the mouth of the St. Lawrence River in the east to Lake Huron in the west. Historically, this ecozone was primarily composed of temperate mixed and broadleaf forests, wetlands, lakes, and rivers, but also smaller areas of tallgrass prairie and savannah ecosystems (Greidanus 2021). We divided the study area into 25 km2 hexbins within which we calculated land cover change, patch size change, and performed our case study analysis. Partial hexbins, smaller than 15 km2, which were exclusively located on the periphery of the study area, were not included in the analysis. Manitoulin Island and St. Joseph Island were also excluded because row crops and pasture/forage were not differentiated there in some datasets. The final study area (Fig. 1) was 10.4 million ha, 92% of Canada’s Mixedwood Plains Ecozone. The study period was 2011–2022, which matched the availability of the main input dataset used in this study.
Fig. 1.
2.2. Land cover change
We used Agriculture and Agri-Food Canada’s Annual Crop Inventory (ACI; Agriculture and Agri-Food Canada 2022) and Land Use Time Series (LUTS; Agriculture and Agri-Food Canada 2023) to assess land cover change with respect to farmland across the study area. We classified the landscape into six land cover types: (1) annual crops, (2) pasture/forage (which includes tame grasses, alfalfa, and clover), (3) anthropogenic, (4) forest, (5) wetland, and (6) grassland (not used for agriculture) and shrubland. Other land cover types such as open water and rocky barrens were not included because they are not typically converted to and from farmland. Next, we calculated the area of row crops and pasture/forage for each hexbin at the beginning and end of the study period using two different methods (below) and determined the area that changed from row crops and pasture/forage to another land cover type (and vice versa) over the study period.
2.2.1. Classifying agricultural lands
The ACI and LUTS both differentiated between row crops and pasture/forage, but neither were adequate for this analysis on their own. The ACI was unable to consistently differentiate pasture/forage and shrubland and did not perform well with non-agricultural land cover types. The LUTS differentiated annual and perennial crops for the 2015 and 2020 datasets, but not the 2010 dataset, which would have limited our study to two data points, 5 years apart.
We therefore used the ACI data to differentiate row crops and pasture/forage and LUTS data to determine the extent of the agriculture to limit false-positive agriculture classifications. Shrubland, a problematic land cover class in the ACI data, which was frequently misclassified with pasture/forage, we merged with pasture/forage. Next, we masked the ACI data with the merged shrubland and pasture/forage with the agriculture extent from the temporally closest LUTS dataset to create the final annual crop and pasture/forage layers. Although the LUTS data differentiate annual and perennial agriculture (which is generally synonymous with row crops and pasture/forage) for 2015 and 2020, we used the same methodology for consistency across all years. The result was a raster for each year from 2011 to 2022 with a best estimate for row crop and pasture/forage extent.
Land classified as agriculture in the LUTS data but classified as a land cover type other than agriculture or shrubland in the ACI data was not included as annual crops or pasture/forage. We validated the results of the classification by choosing 100 hexbins at random and randomly distributing 100 points on lands classified as annual crop and 100 points on lands classified as pasture/forage and using Google Earth historical imagery from 2011 to 2013 and 2020 to 2022 and Google Street View from the same years to confirm the classifications. We excluded locations within 50 m of patch edges for random point selection because our source datasets were reprojected, which may cause edge alignment issues. We also ensured points were at least 100 m apart. Not all points were able to be validated due to uncertainty in the interpretation of the imagery or lack of imagery, so we arbitrarily chose a cutoff of a minimum of 50 validated points. If that minimum was not met, a second random point selection process was completed.
2.2.2. Calculating agricultural land area
Single year remotely sensed data may include inaccuracies due to poor atmospheric conditions, abnormal ground conditions, and crop rotation; for example, corn and soy rotations may periodically be seeded with a forage crop (Parsons et al. 2020). Because of these potential inaccuracies, we used two methods to determine a best estimate for the area of row crops and pasture/forage for the beginning and end of the study period: (1) We fit a linear regression to the tabulated area of agriculture for each of the 12 years in the study period. The intercept of the regression was the agricultural area at the beginning of the study period and the intercept minus the slope multiplied by 12 was the agricultural area at the end of the study period. (2) We used a majority rule method for the 3-year blocks of 2011 through 2013 and 2020 through 2022. Any single pixel was classified as a specific land cover type if it was classified as such in 2 or 3 years of the 3-year blocks. We validated the results of each method by regressing the results of one against the other. Our final reported area was the average of the two methods.
2.2.3. Calculating land change
We used the annual crop and pasture/forage extents calculated using the majority rule method to determine land change to and from other land cover types. For each pixel that either became or ceased being row crop or pasture/forage over the study period, we determined which land cover type it became or was and tabulated the results by hexbin. We validated land change in the same method as agricultural land classification.
2.3. Patch size
Contiguous agricultural patches were defined as row crop or pasture/forage areas unbroken by roads or other land cover types. Roads are a cause of mortality, fragmentation, and reduced habitat quantity and quality for many animals including birds (Rytwinski and Fahrig 2015) and all classes of roads are known to affect certain wildlife groups like insects (Muñoz et al. 2015), so we did not discriminate by road class as a source of habitat fragmentation. Adjacent row crop and pasture/forage fields were considered separate patches. Patch size was calculated by summing all raster cells of the same cover type, either row crop or pasture/forage, that touched on their sides. Cells that touched on their vertices were not considered contiguous. The total number of patches as well as the mean patch size was calculated for the entire study area for the beginning and the end of the study period using agricultural extent from the majority rule method. Additionally, we calculated patch size and number by hexbin; however, this approach is vulnerable to habitat patches that straddle hexbins. In such cases, hexbins were split, thus giving an overestimation of the number of patches and an underestimation of the average patch size. We quantified this error comparing the patch size and number for the whole study area to the cumulative totals from all hexbins.
2.4. Case study: Eastern Meadowlark carrying capacity and relative abundance
Eastern Meadowlark is a grassland bird species that, within our study area, breeds in pastures, hay fields, and other meadow habitats. Eastern Meadowlarks have been found to have territories as small as 1.2 ha but an average territory size between 2.8 and 3.2 ha (COSEWIC 2011). We calculated Eastern Meadowlark carrying capacity for each hexbin as the sum of the number of average territories (3 ha) that can fit in each pasture/forage patch larger than 1.2 ha. Fields between 1.2 and 3 ha were counted as one territory. This hypothetical carrying capacity, which assumes the habitat in each pasture/forage patch is suitable for the species, was calculated for the beginning and the end of the study period. Similar to the patch size calculations, a source of error for carrying capacity estimation was patches that straddled multiple hexbins. We quantified this error by calculating carrying capacity for the whole study area and comparing to the cumulative totals from all hexbins. Additionally, because grassland bird distribution has been shown to be little affected by low use roads (Forman et al. 2002), we also quantified the error associated with dividing habitat patches by roads. We first buffered pasture/forage patches by 30 m, approximately 1.5 × the standard road right of way width of 20.1 m (66 feet). Thus, buffered pasture/forage patches would entirely cross road rights of way where patches were adjacent to the road, giving a 10 m margin for error. Buffered patches that intersected were determined to be adjacent and if the intersecting area also intersected a local road (Statistics Canada 2020) then those adjacent patches were merged and the road area between them was included as part of the new patch.
Next, we compared the changes in hypothetical carrying capacity of Eastern Meadowlark in each hexbin to realized changes of Eastern Meadowlark relative abundance. We used data from the Ontario Breeding Bird Atlas (OBBA), a bi-decadal record of avifauna breeding evidence in Ontario, to calculate the change in relative abundance for each hexbin in the study period. We used geospatially referenced point count data from the second OBBA (2001–2005; Birds Canada 2023a) and from the first 3 years of the third OBBA (2021–2025; Birds Canada 2023b). Unfortunately, we could not complete this analysis for the Quebec portion of the study area because point count data were collected for only one atlas period. We were also unable to use Breeding Bird Survey data as a substitute for atlas data in Quebec because of the small number of suitable survey routes with Eastern Meadowlark observations within the study area. We aggregated point counts by hexbin and calculated Eastern Meadowlark relative abundance as the number of meadowlarks detected per point count per hexbin during the point count observation period of May 24 to July 10 (Ontario Breeding Bird Atlas 2021), which is fully enveloped by the Eastern Meadowlark breeding season of May 15 to July 31 (Ontario Breeding Bird Atlas 2023). We assessed the correlation between carrying capacity and meadowlark relative abundance using linear regressions. Only hexbins with at least one point count in each of the two atlas periods were retained for abundance analysis.
3. Results
3.1. Land cover change
Both the majority rule and intercept methods used to calculate agricultural area produced comparable results. The results from the intercept method, when regressed against the results of the majority rule method, produced an R2 value of 0.998 for row crops and 0.982 for pasture/forage, although the intercept method calculated, on average, a slightly smaller area as indicated by the slope of 0.964 for row crops and 0.948 for pasture/forage. We estimated that at the beginning of the study period there were 3.40 million ha of annual crops and 1.70 million ha of pasture/forage in the study area (Table 1). The area of row crops increased by 0.44 million ha to 3.84 million ha by the end of the study period, an annual increase of 1.08%. Pasture/forage decreased by 0.44 million ha to 1.27 million ha by the end of the study period, an annual decrease of 2.14%. The total area of agriculture remained virtually unchanged over the study period, increasing by only 0.005 million ha.
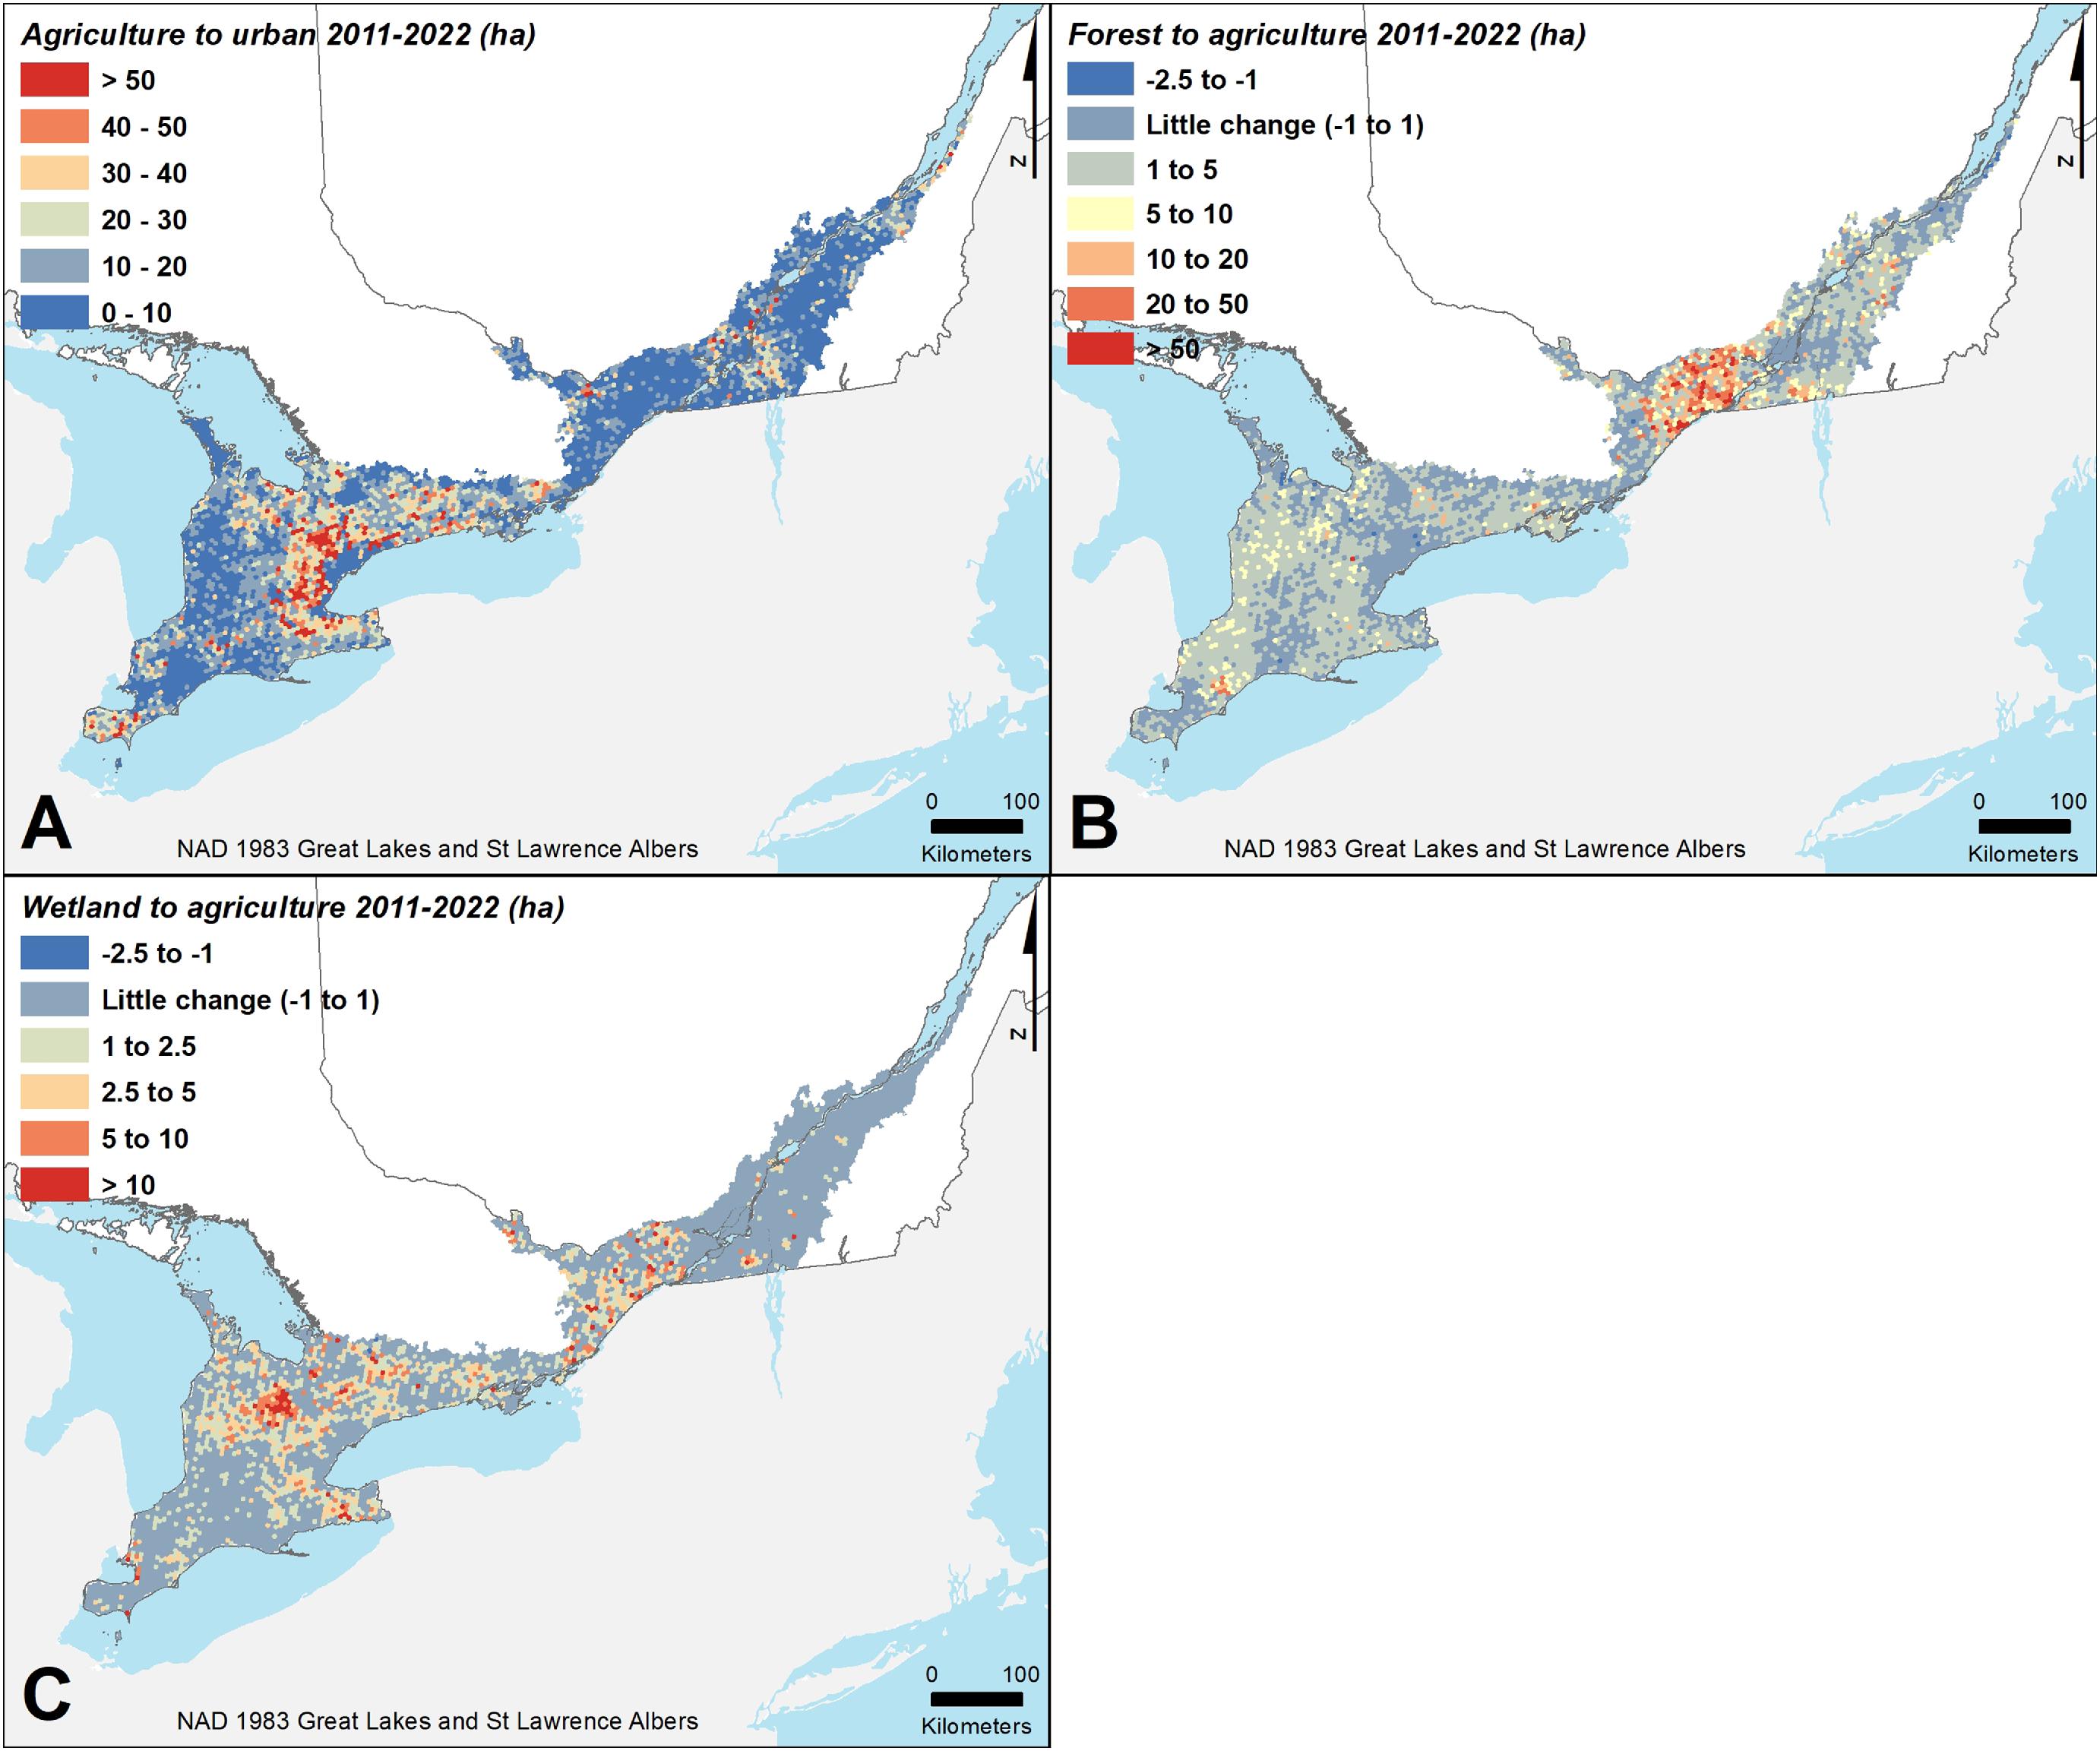
The conversion of pasture/forage to annual crops was the largest land cover change that we observed, with a net total of 334 000 ha converted (Table 2; 357 000 ha converted from pasture/forage to row crops and 23 000 ha converted from row crops to pasture/forage). Conversion of pasture/forage to annual crops was largely along the edge of the Canadian Shield where most of the pasture/forage in the Mixedwood Plains remains (Fig. 2). Over 65 000 ha of agriculture were converted to urban, primarily in the Greater Toronto Area (Fig. 3). There was a net loss of over 15 000 ha of forest to agriculture (15 860 ha of forest to agriculture and 840 ha of agriculture to forest), with a hotspot of deforestation for agriculture in far eastern Ontario (east of the Rideau River system) where approximately 6000 ha of forest were converted (Fig. 3). There was negligible conversion of row crops to forest; conversion of agriculture to forest was driven nearly entirely by the conversion of pasture/forage to forest. Over 5400 ha of wetlands were converted to agriculture with a hotspot in the County of Dufferin region of southern Ontario (Fig. 3), while 50 ha were converted from agriculture to wetlands.
Fig. 2.
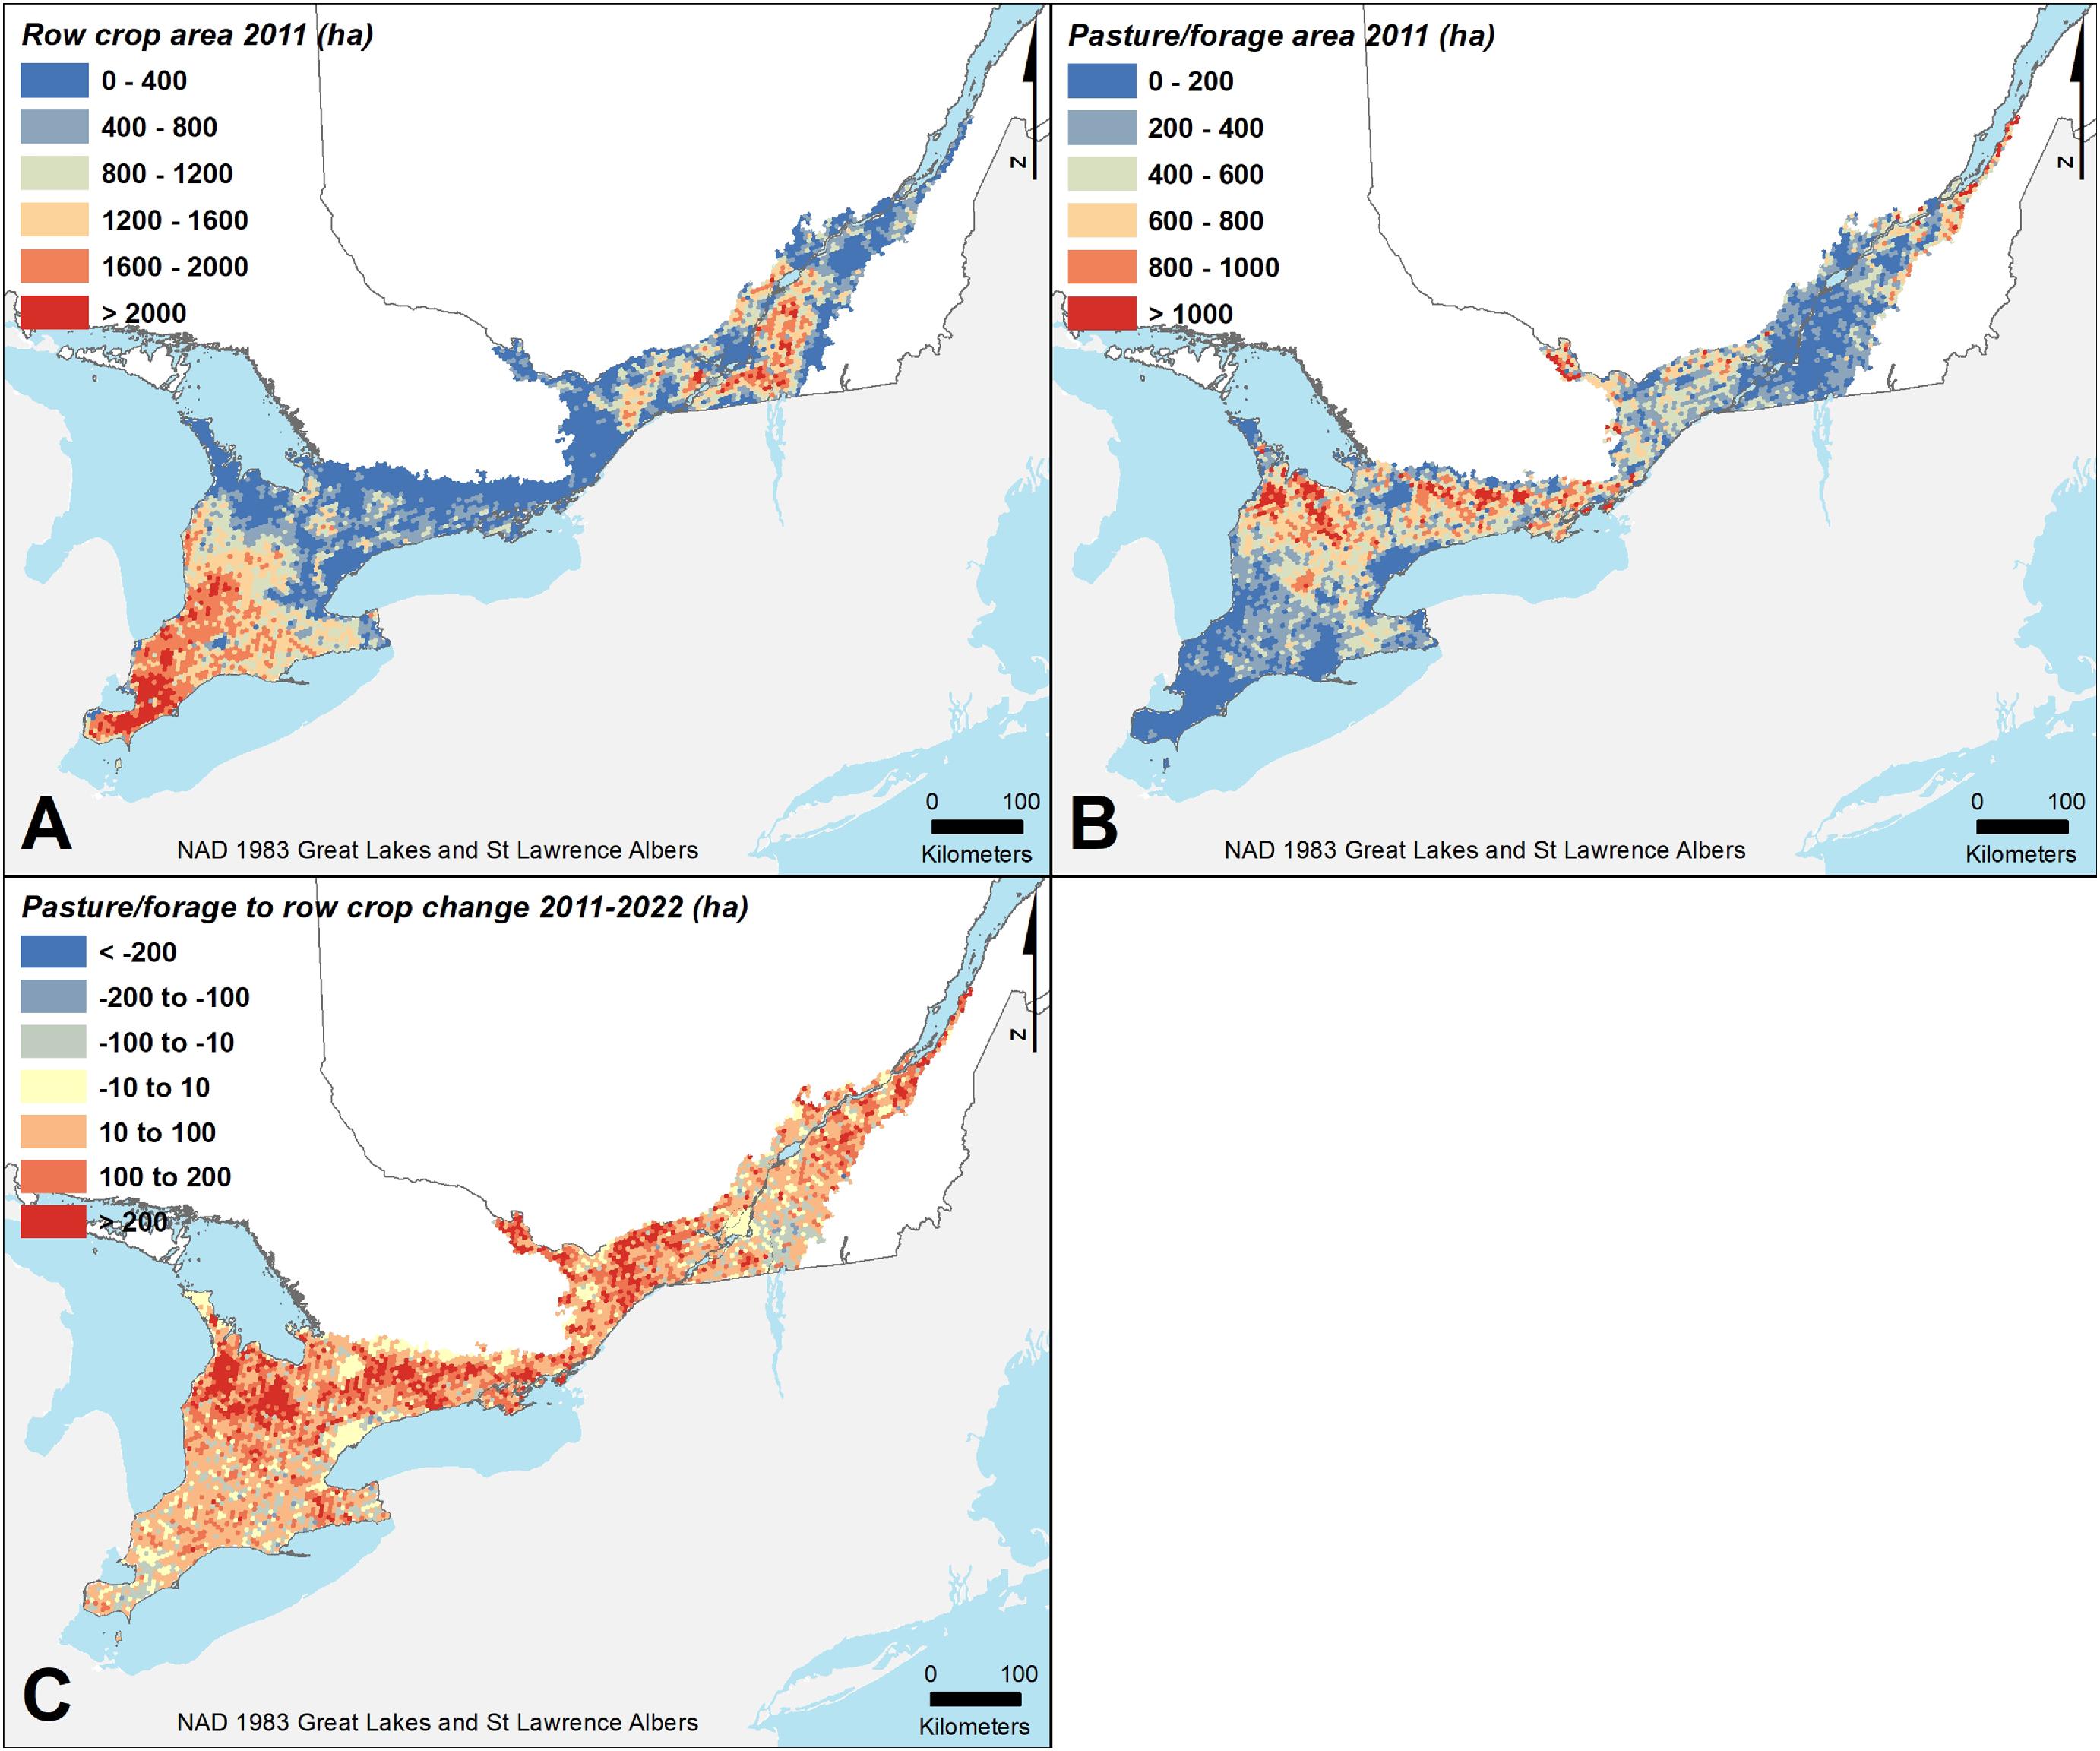
Fig. 3.
Validating database landcover change using aerial and street level imagery confirmed the classification of row crops and pasture/forage was highly successful (100% and 96%, respectively; Table 3). Classification success of lands converted from pasture/forage to row crops was also very good (88%); however, classification success of lands converted from row crops to pasture/forage was relatively poor (69%). Errors associated with classifying conversion of row crops to pasture/forage were all misclassifications of either row crops as pasture/forage or vice versa. Classification success of conversion of agriculture to urban and forest to agriculture was high (92.5% and 98%, respectively) and wetland to agriculture was poor (62.7%). Errors associated with wetland conversion to agriculture were mostly classification errors of agriculture as wetland, specifically, agriculture that had been wetland prior to the study period.
Table 1.
| Land cover | Study period start (1000 ha) | Study period end (1000 ha) | Change (%) |
|---|---|---|---|
| Row crop | 3400 | 3840 | 12.9 |
| Pasture/forage | 1700 | 1270 | −25.3 |
| Total agriculture | 5100 | 5110 | 0.2 |
Note: Values are the summed averages of the majority rule method and the intercept method as calculated for the 4266 hexbins in the study area.
Table 2.
| Land cover change | To (1000 ha) | From (1000 ha) | Net change (1000 ha) |
|---|---|---|---|
| Pasture/forage to/from row crop | 357 | 23 | 334 |
| Agriculture to/from urban | 65 | 0 | 65 |
| Forest to/from agriculture | 16 | 1 | 15 |
| Wetland to/from agriculture | 5 | 0 | 5 |
Note: Values are the sums from the 4266 hexbins in the study area as calculated by the majority rule method.
Table 3.
| PF | RC | PF to RC | RC to PF | AG to UR | FO to AG | WE to AG | |
|---|---|---|---|---|---|---|---|
| Total points assessed | 100 | 100 | 94 | 89 | 93 | 100 | 51 |
| Classification errors | 4 | 0 | 11 | 28 | 7 | 2 | 19 |
| Success (%) | 96.0 | 100.0 | 88.3 | 68.5 | 92.5 | 98.0 | 62.7 |
3.2. Patch size and Eastern Meadowlark carrying capacity and relative abundance
Over the study period, mean patch size of annual crops based on the entire study area increased 37(25)% from 17.0(14.3) to 23.2(17.9) ha, while mean patch size of perennial pasture/forage increased 7(4)% from 2.8(2.7) to 3.0(2.8) ha (values in parentheses are those calculated using the per-hexbin method and do not account for patches split between hexbins). The patch count per hexbin of annual row crops decreased 19(11)% from 47.6(56.2) to 38.5(49.8), while the patch count of perennial pasture/forage decreased 26(24)% from 140.0(146.6) to 103.1(111.9). The hypothetical carrying capacity of Eastern Meadowlarks for the entire study area decreased 20% from 499 400 pairs to 397 800 pairs. Cumulative carrying capacity based on individual hexbin calculations decreased 21% from 498 100 pairs to 393 000 pairs and carrying capacity accounting for local roads decreased 21% from 515 600 pairs to 405 900 pairs.
The OBBA data showed that the mean Eastern Meadowlark count per point count per hexbin (hereafter referred to as abundance) decreased by 28.8% from 0.234 to 0.166 between the second and third atlas. Change in OBBA abundance per hexbin correlated significantly (linear regression; P < 0.001) with change in hypothetical carrying capacity, with each loss of capacity of 100 pairs per hexbin resulting in a decrease of 0.09 detected birds per point count per hexbin.
4. Discussion
By measuring agricultural land use change from 2011 to 2022, we showed a large and increased conversion of perennial pasture/forage cover to annual crop land across the Mixedwood Plains Ecozone in Ontario and Quebec, Canada. We linked this change to declining suitable habitat for Eastern Meadowlark that correlated with decadal trends in meadowlark population size. We also found that total farmland area has changed little over the decade, because farmland losses to urbanization were partially offset by the conversion of forests and wetlands to farmland.
4.1. The changing agricultural landscape
Although the absolute agricultural area in the Mixedwood Plains changed little over the study period, we found a dramatic shift from perennial pasture/forage agriculture to annual row crops as well as a more modest shift of where agricultural lands were located. The overall loss of 0.44 million ha of pasture/forage resulted in a loss rate of 2.1% per year (25.9% total) over the study period. By comparison, the rate of loss was approximately three times greater than the 90 year (1921–2011) average annual decline of pasture and hay in Ontario (approximately 0.7% per year; estimate using data presented in graphs from Smith (2015) and Statistics Canada (2022b). The conversion of pasture/forage to row crops in the Mixedwood Plains during the 20th century was driven, at least in part, by the ability to grow crops like soy at more northerly latitudes (Bowly 2013), an increase in pork and poultry production (Jobin et al. 2014; Smith 2015; Ruiz 2019), and a shift from pasture grazed to confinement fed animals (Smith 2015) particularly in dairy production (Jobin et al. 2014). The underlying factors associated with the increased rate of conversion of pasture/forage in recent years have yet to be studied but may include increased commodity prices for annual crops relative to hay/forage, increased crop yields, increased agricultural land prices and taxes, and increased pressures from urbanization leading to more intensive agriculture. A growing population increases the pressure to maximize food production, which favours higher yield annual crops and feedlot animal production. For example, confinement fed dairy production per unit area of farmland was found to be more than double that of grass-fed dairy production in the northeastern United States (Rotz et al. 2020), so in certain cases output could be maximized by growing silage crops for feedlots rather than hay or grazing livestock on pastures.
A total of 65 000 ha of agricultural lands were lost to urbanization from 2011 to 2022, but those losses were at least partially offset by gains of agricultural lands from converting forest and wetlands to agricultural cropland (15 000 and 5400 ha, respectively). Although there was little net change in total agricultural area, there is potential productivity loss because of where the losses and gains were located. The Canada Land Inventory (Agriculture and Agri-Food Canada 1998) has assessed soil quality for agriculture where lands in Canada are ranked from 1 (excellent soil quality) to 7 (poor soil quality). Agricultural losses in the study area were located on slightly but significantly (P < 0.01) higher quality soil (mean 2.9) than the gains (mean 3.0). Indeed, the loss of dependable agricultural land to urbanization has been documented in Canada, with 46% of urban areas located on class 1, 2, or 3 soils in 2001, up from 44% in 1971 (Bollman 2005). Although the difference in soil quality between lost and gained agricultural land is minor, it likely reflects a decline in potential productivity per unit area of farmland across the study area.
The complexity of land use change and differences among datasets impose interesting challenges for land use monitoring. Overall, the area of agricultural land remained very constant over the study period, increasing slightly from 5.10 to 5.11 million ha. However, using only the 2010 and 2020 LUTS datasets, agricultural land across the study area was 5.78 million ha in 2010 and 5.70 million ha in 2020. This is either a slight underestimation in agricultural area as calculated by our methods and/or the LUTS dataset included some non-agricultural lands as agriculture. The majority rule method is prone to underestimation because it requires agreement across years. This leaves lands for which there is no majority agreement as unclassified. Unclassified land cover could have caused an underestimation in conversion to and from cropland, pasture/forage, and other land cover types, indicating that our findings are best considered as estimates and not exact values.
4.2. Implications for biodiversity
The shift from perennial pasture/forage to annual row crops is likely to result in a loss of biodiversity of both flora and fauna on the agricultural landscape. Pasture/forage habitat tends to have higher plant species richness and structural heterogeneity, which can increase grassland biodiversity (Becerra et al. 2017) compared to row crops (Weibull et al. 2003; Fédoroff et al. 2005), which are typically even-structure, monocultures by design. Pasture/forage habitats have been shown to support a higher richness or diversity of various animal taxa such as Lepidoptera and birds when compared to row crops (Weibull et al. 2003; Wilson et al. 2017) and Martin et al. (2020) found more species of birds and certain invertebrate groups occurred in untilled perennial fields than tilled annual fields in eastern Ontario. In the Mixedwood Plains Ecozone where more than 97% of the native tallgrass prairie and savannah have been lost since European arrival (Environment Canada 2010), species such as the Eastern Meadowlark and Bobolink (Dolichonyx oryzivorus (Linneaus, 1758)) are reliant on pasture/forage habitat and are at risk for reasons including habitat loss. Eastern Meadowlarks, for example, prefer older fields dominated by grass with a short and patchy vegetation structure, more litter, and little bare ground (COSEWIC 2011; Environment and Climate Change Canada 2022), habitat features absent in row crops. Grassland species obligates like these are most at risk from the conversion of pasture/forage to row crops.
Based on our calculations of the theoretical carrying capacity of Eastern Meadowlarks, the study area had a carrying capacity of 499 400 pairs at the beginning of the study period and 397 800 pairs at the end of the study period, a loss of 20%. This estimated carrying capacity makes assumptions that all pasture/forage habitat is suitable for the species, which may not be true for alfalfa, clover, and other forage crops that are mowed early and frequently, and that the minimum patch size and nesting density are both average and homogenous. Our per-hexbin carrying capacity calculation, which we used to compare OBBA data, was similar (0.3% lower at the beginning of the study period and 1.2% lower at the end of the study period) indicating that habitat patches with overlapping hexbins had little effect on carrying capacity estimates. Including local roads as part of the patches also produced very similar results (3.2% increase at the beginning of the study period and 2.0% increase at the end of the study period); however, this method did add 78 000 ha at the beginning of the study period and 36 000 ha at the end of the study period of potential Eastern Meadowlark habitat despite the additional area being unsuitable road surface. Despite these assumptions and potential sources of error, the estimated carrying capacity is very similar to a recent Canadian population estimate for Eastern Meadowlarks of 680 000 adults, of which 99% is in Ontario and Quebec (Environment and Climate Change Canada 2022). Estimates made using the OBBA data suggest Eastern Meadowlarks are declining at a rate of 14.4% per decade (28.8% between survey periods), and these declines, compared across hexbins, correlated significantly with declines in estimated carrying capacity. The correlation between OBBA data and our estimated carrying capacity as well as the similarity in predicted rates of decline provides strong inference that habitat is indeed a limiting factor and is perhaps the largest reason for the decline of Eastern Meadowlarks in the Mixedwood Plains Ecozone.
Our analysis also revealed that mean patch size of both annual crops and perennial pasture/forage increased over the study period while patch count decreased. An increased field size and associated decreased field count will decrease the configurational heterogeneity of the landscape, which will likely decrease biodiversity in the landscape (Fahrig et al. 2011). Smaller fields have also been found to have higher biodiversity of birds, plants, and invertebrates in eastern Ontario (Fahrig et al. 2015), also indicating that the increased field patch size in the Mixedwood Plains Ecozone will likely negatively impact biodiversity. Although biodiversity may decrease alongside configurational heterogeneity, some species may benefit from increased field size. For example, Eastern Meadowlark has an average territory size of ∼3 ha (COSEWIC 2011), so some fields may become suitable for the species as field size increases. It is likely that agricultural field size increased in the 20th century primarily because mechanization made it possible to increase per-farm agricultural area, and indeed farm size did increase over the 20th century in Ontario (Smith 2015). Field size increases during the study period could be a result of agricultural intensification associated with farm consolidation and larger machinery and consequent removal of hedgerows or other dividing habitats, and thus a decrease in heterogeneity of the agricultural landscape.
The conversion of forest and wetland to agricultural land has been occurring on a large scale since the colonization of the study area by Europeans (Crins et al. 2009; Penfound and Vaz 2022). Wetlands, for example, are estimated to have lost 68% of their original area in southern Ontario due to land conversion (Penfound and Vaz 2022). In addition to the direct impacts on the native biodiversity within wetlands and forests, deforestation and wetland removal may impact species within the surrounding agricultural landscape. Increased forest edge, for example, has been shown to increase open country birds in eastern Ontario (Rabbetts et al. 2023) and in agricultural landscapes in Europe vascular plant, bird, and invertebrate richness increased with semi-natural habitat cover (Billeter et al. 2008). Deforestation and wetland removal are also eliminating high-value ecosystems that provide millions of dollars a year in ecosystem services such as flood and drought mitigation, ecosystem goods, climate regulation, carbon sequestration, and natural pest control (Ninan and Inoue 2013; Mitsch et al. 2015; Martínez Pastur et al. 2018). The estimated 15 000 ha of forest and 5400 ha of wetland lost to conversion to agriculture would be contributing $63 and $322 million/year in ecosystem services value, respectively, based on estimates for temperate forest and wetland from eastern Ontario and southwestern Quebec (Dupras et al. 2016). The ecosystem services provided by forests and wetlands are also beneficial to agricultural production. For example, wetlands are known to increase resilience to climate change (Endter-Wada et al. 2020) and forest pollinators can benefit insect pollination-dependent annual crops (Monasterolo et al. 2015). Of note is that wetland loss in the study area was nearly exclusive to Ontario (94% of the total loss), perhaps in part due to net-zero wetland loss legislation introduced in Quebec in 2017 (National Assembly of Quebec 2017) and relatively weak wetland protection policies in Ontario (Rich 2014). However, in 2010, wetlands covered 2.1% of the Ontario portion of the study area versus 1.1% of the Quebec portion of the study area (Agriculture and Agri-Food Canada 2023) so there were fewer wetlands to lose in Quebec. The amount of forest and wetland converted to urban lands was not assessed.
5. Conclusions
Demand for land for housing, business, and agriculture will continue to increase in concert with Canada’s increasing human population. These demands must be reconciled with the need to conserve native ecosystems and their flora and fauna and improve the resiliency of farmland to impacts of climate change. At present in the Mixedwood Plains Ecozone, conversion of perennial crops to annual crops and continued deforestation and loss of wetlands for agriculture as well as the loss of agriculture to urbanization impact species and reduce ecosystem services. There are few government policies that incentivize stewardship of natural habitats or provide rewards that offset lost revenue associated with retaining natural habitats; however, there are conservation plans and frameworks that apply to the Mixedwood Plains Ecozone that provide opportunities and guidance for the stewardship of natural habitats and the species within (e.g., Jobin et al. 2013; ECCC's The Strategic Conservation Framework for Species at Risk—Agriculture Sector pending publication in 2024; National Biodiversity Strategies and Action Plans pending release in 2024) as well as funding sources that promote biodiversity conservation on farmland such as Alternative Land Use Services, the Species at Risk Farm Incentive Program, and the Sustainable Agriculture Program. Land use policies should consider impacts on biodiversity and agricultural production by exploring options to limit the expansion of urban boundaries onto farmlands and natural land covers as well as the expansion of farmlands onto natural land covers. In addition, development of federal and provincial agricultural policies incentivizing the retention of biodiverse habitats on farms as a public good provided by agricultural producers in the Mixedwood Plains Ecozone could contribute to halting and reversing biodiversity loss.
Acknowledgements
We would like to thank Emily Lindsay and Melodie Green from Agriculture and Agri-Food Canada for their methodology advice and assistance accessing datasets. We would also like to thank the Canadian Wildlife Federation for supporting this research and the two anonymous reviewers who provided valuable feedback.
References
AgMedia Inc. 2014. Most of Canada’s farmland loss occurs in Ontario and Quebec | Better Farming [online]. Available from https://www.betterfarming.com/online-news/most-canada%E2%80%99s-farmland-loss-occurs-ontario-and-quebec-56631 [accessed August 2023].
Agriculture and Agri-Food Canada. 1998. Canada Land Inventory [online]. Available from https://sis.agr.gc.ca/cansis/nsdb/cli/index.html [accessed August 2023].
Agriculture and Agri-Food Canada. 2022. Annual Crop Inventory—Open Government Portal [online]. Available from https://open.canada.ca/data/en/dataset/ba2645d5-4458-414d-b196-6303ac06c1c9 [accessed August 2023].
Agriculture and Agri-Food Canada. 2023. AAFC Land Use—Open Government Portal [online]. Available from https://open.canada.ca/data/en/dataset/fa84a70f-03ad-4946-b0f8-a3b481dd5248 [accessed August 2023].
Askins R.A. 1999. History of grassland birds in eastern North America. Studies in Avian Biology, 19: 60–71.
Becerra T.A., Engle D.M., Fuhlendorf S.D., Elmore R.D. 2017. Preference for grassland heterogeneity: implications for biodiversity in the Great Plains. Society & Natural Resources, 30(5): 601–612.
Billeter R., Liira J., Bailey D., Bugter R., Arens P., Augenstein I., et al. 2008. Indicators for biodiversity in agricultural landscapes: a pan-European study. Journal of Applied Ecology, 45: 141–150.
Birds Canada. 2023a. Ontario Breeding Bird Atlas (2001–2005): point count data. Data accessed from NatureCounts, a node of the Avian Knowledge Network, Birds Canada [online]. Available from https://www.naturecounts.ca/ [accessed October 2023].
Birds Canada. 2023b. Ontario Breeding Bird Atlas (2021–2025): point count data. Data accessed from NatureCounts, a node of the Avian Knowledge Network, Birds Canada [online]. Available from https://www.naturecounts.ca/ [accessed October 2023].
Bollman R.D. 2005. The loss of dependable agricultural land in Canada. Rural and small town Canada Analysis Bulletin, 6.
Bowley P.M. 2013. A century of soybeans: scientific research and mixed farming in agricultural Southern Ontario, 1881–1983. Ph.D. thesis, University of Guelph, Guelph, Ontario. 270p.
CBC News. 2023. What’s happening to Canada’s farmland? [online]. Available from https://www.cbc.ca/news/canada/canada-prime-farmland-1.6877661 [accessed November 2023].
COSEWIC. 2011. COSEWIC assessment and status report on the Eastern Meadowlark Sturnella magna in Canada. Committee on the Status of Endangered Wildlife in Canada, Ottawa [online]. Available from https://www.sararegistry.gc.ca/virtual_sara/files/cosewic/sr_eastern_meadowlark_0911_eng.pdf [accessed December 2023].
Crins W.J., Gray P.A., Uhlig P.W.C., Wester M.C. 2009. The Ecosystems of Ontario, Part 1: Ecozones and Ecoregions. SIB TER IMA TR-01. Ministry of Natural Resources, Ontario [online]. Available from https://files.ontario.ca/mnrf-ecosystemspart1-accessible-july2018-en-2020-01-16.pdf [accessed December 2023].
Dauphin D., Jobin B. 2016. Changements de l'occupation du sol dans la plaine inondable du lac Saint-Pierre entre les années 1950 et 1997. Le Naturaliste canadien, 140: 42–52.
Drapeau P., Leduc A., Jobin B., Imbeau L., Desrochers M. 2019. Changement d'habitat et de répartition des oiseaux nicheurs d'un atlas à l'autre. In Deuxième atlas des oiseaux nicheurs du Québec méridional. Edited by M. Robert, M.-H. Hachey, D. Lepage, A.R. Couturier. Regroupement QuébecOiseaux, Service canadien de la faune (Environnement et Changement climatique Canada), and Études d'Oiseaux Canada, Montréal. pp. 35–55.
Dudley N., Alexander S. 2017. Agriculture and biodiversity: a review. Biodiversity, 18: 45–49.
Dupras J., L'Ecuyer-Sauvageau C., Auclair J., He J., Poder T. 2016. Natural capital: the economic value of the National Capital Commission’s Green Network. National Capital Commission, Ottawa [online]. Available from https://ncc-website-2.s3.amazonaws.com/documents/natural_capital_economic_value_ncc_green_network_final_dec_1_web.pdf [accessed November 2023].
Endter-Wada J., Kettenring K.M., Sutton-Grier A. 2020. Protecting wetlands for people: strategic policy action can help wetlands mitigate risks and enhance resilience. Environmental Science & Policy, 108: 37–44.
Environment and Climate Change Canada. 2022. Eastern Meadowlark (Sturnella magna): recovery strategy [proposed] 2022 [online]. Available from https://www.canada.ca/en/environment-climate-change/services/species-risk-public-registry/recovery-strategies/eastern-meadowlark-proposed-2022.html [accessed December 2023].
Environment Canada. 2010. Canadian biodiversity: ecosystem status and trends 2010 [online]. Available from http://130.179.67.140/dataset/cdnbiodiv2010report [accessed November 2023].
Fahrig L., Baudry J., Brotons L., Burel F.G., Crist T.O., Fuller R.J., et al. 2011. Functional landscape heterogeneity and animal biodiversity in agricultural landscapes. Ecology Letters, 14: 101–112.
Fahrig L., Girard J., Duro D., Pasher J., Smith A., Javorek S., et al. 2015. Farmlands with smaller crop fields have higher within-field biodiversity. Agriculture, Ecosystem & Environment, 200: 219–234.
FAO. 2019. The state of the world’s biodiversity for food and agriculture. In FAO Commission on Genetic Resources for Food and Agriculture Assessments, Rome. Edited by J. Bélanger, D. Pilling.
FAO, IFAD, UNICEF, WFP, and WHO. 2020. The state of food security and nutrition in the world 2020. Transforming food systems for affordable healthy diets [online].
Fédoroff É., Ponge J.-F., Dubs F., Fernández-González F., Lavelle P. 2005. Small-scale response of plant species to land-use intensification. Agriculture Ecosystems & Environment, 105: 283–290.
Fontaine J.J., Jorgensen C.F., Stuber E.F., Gruber L.F., Bishop A.A., Lusk J.J., et al. 2017. Species distributions models in wildlife planning: agricultural policy and wildlife management in the great plains. Wildlife Society Bulletin, 41: 194–204.
Forman R., Reineking B., Hersperger A. 2002. Road traffic and nearby grassland bird patterns in a suburbanizing landscape. Environmental Management, 29: 782–800.
Gauthier D.A., Wiken E.B. 2003. Monitoring the conservation of grassland habitats, Prairie Ecozone, Canada. Environmental Monitoring and Assessment, 88: 343–364.
Government of Canada. 2017. Soy story: a short history of glycine max in Canada [online]. Available from https://www150.statcan.gc.ca/n1/pub/21-004-x/2017001/article/14779-eng.htm [accessed November 2023].
Greidanus L. 2021. Hinterland who's who—mixed woods forest [online]. Available from https://www.hww.ca/en/wild-spaces/mixed-woods-forest.html [accessed November 2023].
Institut de la statistique du Québec. 2023. Acceleration of land artificialization and loss of agricultural land [online]. Available from https://statistique.quebec.ca/en/communique/acceleration-of-land-artificialization-and-loss-of-agricultural-land [accessed November 2023].
IPBES. 2019. Summary for policymakers of the global assessment report on biodiversity and ecosystem services of the Intergovernmental Science-Policy Platform on Biodiversity and Ecosystem Services. Edited by S. Díaz, J. Settele, E.S. Brondízio, H. Ngo, M. Guèze, J. Agard, et al. et al. IPBES secretariat. Bonn, Germany. pp. 1–56.
Jobin B., Latendresse C., Grenier M., Maisonneuve C., Sebbane A. 2010. Recent landscape change at the ecoregion scale in southern Québec (Canada), 1993–2001. Environmental Monitoring and Assessment, 164: 631–647.
Jobin B., Langevin R., Allard M., Labrecque S., Dauphin D., Benoit M., Aquin P. 2013. Evaluation of a landscape analysis approach for migratory birds and species at risk habitat conservation planning in the Mixedwood Plains Ecozone: case study in Lake Saint-Pierre. Environment Canada, Canadian Wildlife Service, Quebec Region, Quebec, Technical report series No. 527. 69p.
Jobin B., Latendresse C., Baril A., Maisonneuve C., Boutin C., Côté D. 2014. A half-century analysis of landscape dynamics in southern Québec, Canada. Environmental Monitoring and Assessment, 186: 2215–2229.
Martin A.E., Collins S.J., Crowe S., Girard J., Naujokaitis-Lewis I., Smith A.C., et al. 2020. Effects of farmland heterogeneity on biodiversity are similar to—or even larger than—the effects of farming practices. Agriculture Ecosystems & Environment, 288: 106698.
Martínez Pastur G., Perera A.H., Peterson U., Iverson L.R. 2018. Ecosystem services from forest landscapes: an overview. In Ecosystem services from forest landscapes: broadscale considerations. Edited by A.H. Perera, U. Peterson, G.M. Pastur, L.R. Iverson. Springer International Publishing, Cham. pp. 1–10.
Mitsch W.J., Bernal B., Hernandez M.E. 2015. Ecosystem services of wetlands. International Journal of Biodiversity Science, Ecosystem Services & Management, 11: 1–4.
Monasterolo M., Musicante M.L., Valladares G.R., Salvo A. 2015. Soybean crops may benefit from forest pollinators. Agriculture Ecosystems & Environment, 202: 217–222.
Muñoz P.T., Torres F.P., Megías A.G. 2015. Effects of roads on insects: a review. Biodiversity and Conservation, 24: 659–682.
National Assembly of Quebec. 2017. An Act respecting the conservation of wetlands and bodies of water [online]. Available from https://www.publicationsduquebec.gouv.qc.ca/fileadmin/Fichiers_client/lois_et_reglements/LoisAnnuelles/en/2017/2017C14A.PDF [accessed December 2023].
Natural Resources Canada. 2020. Land Cover of Canada [online]. Available from https://open.canada.ca/data/en/dataset/ee1580ab-a23d-4f86-a09b-79763677eb47 [accessed June 2023].
Ninan K.N., Inoue M. 2013. Valuing forest ecosystem services: what we know and what we don't. Ecological Economics, 93: 137–149.
Ontario Breeding Bird Atlas. 2021. Ontario Breeding Bird Atlas-3 Instructions for Point Counts [online]. Available from https://www.birdsontario.org/wp-content/uploads/Instructions-for-Point-Counts-June-2021.pdf [accessed November 2023].
Ontario Breeding Bird Atlas. 2023. Ontario Breeding Bird Atlas-3 safe dates/breeding dates (taxonomic order) [online]. Available from https://www.birdsontario.org/wp-content/uploads/SafeDatesEnglish_taxonomic2023-03-06.pdf [accessed November 2023].
Ontario Farmland Trust. 2022. Ontario losing 319 acres of farmland every Day [online]. Available from https://ontariofarmlandtrust.ca/2022/07/04/ontario-losing-319-acres-of-farmland-every-day/ [accessed November 2023].
Parson H.E. 1999. Regional trends of agricultural restructuring in Canada. Canadian Journal of Regional Science, 22(3): 343–356.
Parsons J., Hewlett J., Tranel J. 2020. Fitting annual forages in a crop rotation [online]. Available from https://cap.unl.edu/forage/fitting-annual-forages-crop-rotation [accessed November 2023].
Penfound E., Vaz E. 2022. Analysis of 200 years of change in ontario wetland systems. Applied Geography, 138: 102625.
Rabbetts M., Fahrig L., Mitchell G.W., Hannah K.C., Collins S.J., Wilson S. 2023. Direct and indirect effects of agricultural land cover on avian biodiversity in eastern Canada. Biodiversity and Conservation, 32: 1403–1421.
Rich K. 2014. Is it time for a comprehensive wetland policy in Ontario? 2014 Great Lakes Wetlands Day Proceedings, Ontario. pp. 72–76.
Rotz C.A., Holly M., de Long A., Egan F., Kleinman P.J. 2020. An environmental assessment of grass-based dairy production in the northeastern United States. Agricultural Systems, 184: 102887.
Ruiz J. 2019. Modernisation de l'agriculture et occupation des terres agricoles au Québec (1951–2011). Cahiers de géographie du Québec, 63: 213–230.
Rytwinski T., Fahrig L. 2015. The impacts of roads and traffic on terrestrial animal populations. In Handbook of road ecology. Edited by R. van der Ree, D.J. Smith, C. Grilo. John Wiley & Sons, Ltd. pp. 237–246.
Smith P. 2015. Long-term temporal trends in agri-environment and agricultural land use in Ontario, Canada: transformation, transition and significance. Journal of Geography and Geology, 7: 32–55.
Statistics Canada. 2016a. Coastal Waters (polygons), Boundary files - 2016 Census [online]. Available from https://open.canada.ca/data/en/dataset/6c78fb2f-d23b-45b4-b3af-cc6f6cc4fff8 [accessed November 2020].
Statistics Canada. 2016b. Provinces/Territories, Cartographic Boundary File - 2016 Census [online]. Available from https://open.canada.ca/data/en/dataset/a883eb14-0c0e-45c4-b8c4-b54c4a819edb [accessed November 2020].
Statistics Canada. 2018. Milk production and utilization [online]. Available from https://www150.statcan.gc.ca/t1/tbl1/en/tv.action?pid=3210011301 [accessed November 2023].
Statistics Canada. 2020. Intercensal—road network files [online]. Available from https://www12.statcan.gc.ca/census-recensement/2011/geo/RNF-FRR/index-s-eng.cfm?year=20 [accessed July 2023].
Statistics Canada. 2021a. Census of Agriculture: data linked to geographic boundaries [online]. Available from https://open.canada.ca/data/en/dataset/b944bd53-49e5-4a80-83e5-1048d3abf38d [accessed December 2023].
Statistics Canada. 2021b. Population and dwelling counts, for Canada and census subdivisions (municipalities), 2011 and 2006 censuses [online]. Available from https://www12.statcan.gc.ca/census-recensement/2011/dp-pd/hlt-fst/pd-pl/Table-Tableau.cfm?LANG=Eng&T=301&S=3&O=D [accessed November 2023].
Statistics Canada. 2022a. Population and dwelling counts: Canada, provinces and territories, and census subdivisions (municipalities) [online]. Available from https://www150.statcan.gc.ca/t1/tbl1/en/tv.action?pid=9810000202 [accessed November 2023].
Statistics Canada. 2022b. Land use, Census of Agriculture historical data [online]. Available from https://www150.statcan.gc.ca/t1/tbl1/en/tv.action?pid=3210015301 [accessed November 2023].
Statistics Canada. 2023. The Daily—principal field crop areas, 2023 [online]. Available from https://www150.statcan.gc.ca/n1/daily-quotidien/230426/dq230426a-eng.htm [accessed November 2023].
USCB (United States Census Bureau). 2018. States, Cartographic Boundary Files [online]. Available from https://www.census.gov/geographies/mapping-files/time-series/geo/carto-boundary-file.html [accessed October 2022].
Weibull A.-C., Östman Ö., Granqvist Å. 2003. Species richness in agroecosystems: the effect of landscape, habitat and farm management. Biodiversity and Conservation, 12: 1335–1355.
Wilson S., Mitchell G.W., Pasher J., McGovern M., Hudson M.-A.R., Fahrig L. 2017. Influence of crop type, heterogeneity and woody structure on avian biodiversity in agricultural landscapes. Ecological Indicators, 83: 218–226.
Supplementary material
Supplementary Material 1 (ZIP / 1.82 KB).
- Download
- 1.82 MB
Information & Authors
Information
Published In
FACETS
Volume 9 • Number 1 • January 2024
Pages: 1 - 11
Editor: Peter G. Kevan
History
Received: 30 January 2024
Accepted: 29 July 2024
Version of record online: 11 October 2024
Copyright
© 2024 The Author(s). This work is licensed under a Creative Commons Attribution 4.0 International License (CC BY 4.0), which permits unrestricted use, distribution, and reproduction in any medium, provided the original author(s) and source are credited.
Data Availability Statement
All relevant data are within the paper and in the Supplementary Material.
Key Words
Sections
Subjects
Authors
Author Contributions
Conceptualization: VKF, JFW, CC
Formal analysis: VKF
Methodology: VKF
Supervision: CC
Writing – original draft: VKF, JFW
Writing – review & editing: CC
Competing Interests
We, the authors, declare no competing interests.
Metrics & Citations
Metrics
Other Metrics
Citations
Cite As
Vincent K. Fyson, John F. Wilmshurst, and Carolyn Callaghan. 2024. The changing agricultural landscape in Canada’s Mixedwood Plains Ecozone (2011–2022) and the implications for biodiversity. FACETS.
9: 1-11.
https://doi.org/10.1139/facets-2024-0019
Export Citations
If you have the appropriate software installed, you can download article citation data to the citation manager of your choice. Simply select your manager software from the list below and click Download.
There are no citations for this item