Abstract

In temperate rivers, where environmental conditions vary seasonally, many fishes migrate among summer, spawning, and winter habitats. Dams disrupt these migrations, limiting access to habitat and potentially affecting populations. Bigmouth Buffalo (Ictiobus cyprinellus) is a species of fish with at-risk populations in central Canada. The impact of dams on the extent of Bigmouth Buffalo migration and the overlap between summer and winter home ranges is unknown. Here, we assessed the migratory history of 80 Bigmouth Buffalo tagged with acoustic transmitters in the Red River (USA and Canada), a large binational waterway regulated by semi-passable dams. We sought to understand when and why Bigmouth Buffalo migrate, and how river use varies seasonally. Following more than 6 years of data collection, we found that the degree and probability of overlap between winter and summer home ranges varied by river section between barriers. Importantly, overlap was lowest in the longest continuous river section where well-defined migratory behaviours were observed. The results of this study reveal previously unknown details about Bigmouth Buffalo migration, demonstrate the consequences of river fragmentation on geographic space use, and highlight the importance of river connectivity to fish migration.

Graphical Abstract

Introduction

Efforts to conserve migratory animals are routinely challenged by increasing anthropogenic disturbance and limited baseline data on habitat patch use (Bauer et al. 2016; Cohen et al. 2018; Marra et al. 2019). Migration is an essential component of life history strategies in heterogenous environments, yet access to high-quality habitat may be limited if disturbance impacts structural connectivity. As disturbance often precedes initial data collection, conservation planning must rely on the status quo or establish quasi-baselines (Franklin et al. 2024). Information on habitat patch use is especially salient to conservation efforts directed towards migrants that are impacted by climate change and at risk because of severed connectivity (Nuñez et al. 2013; Keeley et al. 2021).
In aquatic ecosystems, barriers such as dams and weirs disrupt both longitudinal and lateral connectivity within and among networks of flowing waters and adjacent habitats (Grill et al. 2019). This impedes the flow of nutrients and aquatic organisms to fundamentally alter the environmental conditions to which species and populations have adapted. These barriers confine aquatic organisms to fragments of a river network, limiting the accessibility of geographical space and therefore hampering the ability to move between seasonally changing habitats with different ecological niche conditions (Rahel and McLaughlin 2018; Franklin et al. 2024). Ultimately, the interplay between barrier positioning and habitat heterogeneity influences accessibility to habitat with seasonally-specific suitability.
Bigmouth Buffalo (I. cyprinellus) is a potamodromous North American freshwater fish and the largest member of the family Catostomidae. It is the only catostomid to use a filter-feeding strategy and strain plankton from the water (Stewart and Watkinson 2004). The species currently holds the record for oldest teleost, with the most recent maximum age estimate of 127 years (Lackmann et al. 2023). As with other periodic life history strategists (Winemiller and Rose 1992), Bigmouth Buffalo have delayed maturity, broadcast spawn with no parental care, reproduce infrequently, and exhibit high fecundity (Lackmann et al. 2019). At the northern extent of its range in south-central Canada, reproduction occurs from late-May to early-June in shallow marshes, flooded riverbanks, or lake shores (Stewart and Watkinson 2004). Precipitous declines in Canadian populations during the mid-late 20th century have been attributed to commercial fishing, habitat fragmentation, and potential competition with naturalized Common Carp (Cyprinus carpio; Goodchild 1989). In response, the Committee on the Status of Endangered Wildlife in Canada (COSEWIC) assessed the Saskatchewan-Nelson River populations as “species of concern” (COSEWIC 2009). Shortly thereafter, Bigmouth Buffalo was listed as Special Concern under the federal Species at Risk Act in 2011 (Fisheries and Oceans Canada 2020).
Bigmouth Buffalo occupy several watersheds across North America where dams and barriers are ubiquitous (Barbarossa et al. 2020). In one of the few riverine systems where Bigmouth Buffalo movement has been assessed, the Red River of the Hudson Bay Basin, home ranges can exceed hundreds of kilometers in undisrupted stretches of river (Enders et al. 2019). Where rivers span degrees of latitude and resource availability changes seasonally, habitat fragmentation is likely to disrupt migratory behaviours (Fretwell and Lucas 1970; Fretwell 1972). Examining how and when Bigmouth Buffalo occupy habitats in fragmented systems is a logical step toward uncovering the factors impacting an already imperiled species.
To better understand the effects of river fragmentation on Bigmouth Buffalo migration and seasonal home ranges, we examined 6.5 years of passive telemetry data collected in the Red River watershed. Specifically, we investigated the conditions under which Bigmouth Buffalo moved between summer and winter home ranges, and the overlap between these ranges, across river sections characterized by varying lengths. Due to the potential for seasonally changing habitat suitability and high habitat heterogeneity in the river network (Enders et al. 2019), Bigmouth Buffalo should exhibit distinct summer and winter home ranges (i.e., minimal overlap). Because Bigmouth Buffalo have large home ranges but limited dam passage in this river system (Enders et al. 2019), we hypothesized that the degree of seasonal home range overlap is a function of unrestricted geographic space as delineated by river section. In this context, the probability of home range overlap will be minimized where Bigmouth Buffalo are most at liberty to find the seasonally available resources and conditions that maximize fitness among the heterogenous riverscape. This research is intended to enhance the long-term survival of Bigmouth Buffalo by uncovering consequences of habitat fragmentation, thereby informing effective management strategies for the species.

Methods

Study site

The study area is contained within the Lake Winnipeg watershed (∼1 000 000 km2), which encompasses parts of Alberta, Saskatchewan, Manitoba, Ontario, Minnesota, North Dakota, South Dakota, and Montana (Fig. 1—inset map). Land use in the watershed is dominated by cropland agriculture with considerable nutrient inputs draining north into Lake Winnipeg (ECCC 2020). In the current study, 80 Bigmouth Buffalo were tracked in the Red River sub-watershed, including the eastward flowing Assiniboine River and northward flowing Red River of the North (herein referred to as the Red River; Fig. 1). Given the low elevation landscape, the Red River sub-watershed is prone to both recurring flooding and periods of low discharge.
Fig. 1.
Fig. 1. Map of the Lake Winnipeg watershed (inset map) and focal area with tagging locations and receiver arrays. Barriers (lock and dam, floodway control structure, low-head dam, and rock arch rapid (RAR) are defined by black rectangles. Receiver arrays are colored based on river section from home range overlap analysis (Wahpeton, ND to Fargo, ND (W-F); Fargo North RAR to Riverside RAR (F-R); Riverside RAR to Drayton Dam (R-D); Drayton Dam to St. Andrews Lock and Dam, MB (D-S); St. Andrews Lock and Dam to Lake Winnipeg, MB (S-L); and Lake Winnipeg, MB (LW)). Map source: State of North Dakota, Esri, TomTom, Garmin, FAO, NOAA, USGS, EPA, NPS, USFWS.
The Red River is the largest river in the sub-watershed and forms the boundary between Minnesota and North Dakota, flowing approximately 885 river kilometers (rkm) north from Minnesota/North Dakota (ND), USA to Manitoba (MB), Canada. It is a low-energy, suspended sediment, mud-dominated, meandering river that occupies a shallow valley eroded into a clay plain with an alluvium that is primarily silt (Brooks 2003; Brooks 2017). Within the United States the river is typically one continuous run with some riffles present in the sections between Fargo and Riverside (F-R) and Wahpeton to Fargo (W-F; Fig. 1). Between Wahpeton and Drayton (W-F, F-R, R-D; Fig. 1), the river has high sinuosity (ranges from 1.7 to 2.3) and a low gradient (ranges from 0.04 to 0.25 m·km−1; Topp et al. 1994). In Canada (D-S, S-L, LW; Fig. 1), the Red River widens to eventually form a large delta (Netley-Libau Marsh) at the south end of Lake Winnipeg. Most of this reach is influenced by Lake Winnipeg seiche.
There are four types of barriers (lock and dam, low-head dam, radial arm floodgates, rock arch rapid (RAR)) that may cause fragmentation along the river, including: Kidder RAR (ND), Hickson RAR (ND), Christine RAR (ND), Fargo South RAR (ND), Midtown RAR (ND), Fargo North RAR (ND), Riverside RAR (ND), Drayton Dam (ND), Red River Floodway Control Structure (MB), and St. Andrews Lock and Dam (SALD; MB) (Fig. 1). We evaluated migration as well as summer and winter home ranges within and across sections of the Red River that were divided by partial movement barriers (Fargo North RAR, Riverside RAR, Drayton Dam, SALD; Fig. 1). These structures were previously shown to restrict movement resulting in low transition probabilities (Enders et al. 2019). Further details of these sections and partial movement barriers are described below.
The cities of Fargo-Moorhead along the Red River were the locations of the Fargo North (built in ca. 1933), Fargo Midtown (built in ca. 1961) and Fargo South (built in ca. 1933) dams, originally constructed for flood control. From 1999 to 2003, these three dams were converted to RAR to eliminate a hydraulic roller drowning hazard, mimic the microhabitat of natural rapids, and improve fish passage (Aadland et al. 2005). The resulting structures provide a step-pool channel with a centerline slope of 5% to allow passage of weaker swimming species (Aadland 2010).
The Riverside Dam (built ca. 1922) was located in the City of Grand Forks, North Dakota, approximately 476 rkm from the mouth of Lake Winnipeg. Originally designed for municipal water supply, the structure was modified in 2001 into one of the world's largest full river width RAR to manage erosion, eliminate a dangerous hydraulic roller, and provide fish passage and spawning habitat (Aadland 2010). The conversion from low-head dam to rapids was achieved by constructing a wedge of fieldstone and cobble into a 5% slope (3% near shore) over the existing dam, above which ten boulder weirs now provide grade control, pool habitat, and fish-passable velocities (Aadland 2010).
The Drayton Dam at rkm 327 was constructed in 1964 to supply water for agricultural and municipal uses. The dam was originally designed as a concrete weir with a spillway length of 68.5 m and a crest elevation of 3.7 m above the natural riverbed. Operated as a run-of-the-river water control structure, the Drayton Dam was never intended to readily facilitate fish passage. The most recent evaluation of fish movement indicates that upstream passage is indeed limited for Bigmouth Buffalo (Enders et al. 2019).
The Red River Floodway, a trapezoidal-shaped diversion canal about 48 km long and 160–370 m wide, was constructed in response to a devastating flood in 1950 (Brooks 2017). The floodway begins just upstream (south) of Winnipeg, bypassing the city on the east side, before rejoining the river just downstream of the St. Andrews Lock and Dam. The Floodway Control Structure is just downstream of the Floodway entrance in the mainstem of the Red River. It regulates the Red River through Winnipeg when discharge exceeds 900–1000 m3·s−1 by raising submerged radial arm gates to divert a portion of flow into the Floodway channel (Brooks 2017). During operation, the control structure is a barrier to upstream fish movement.
The St. Andrews Lock and Dam (SALD) at rkm 44 is located in Lockport, Manitoba. The lock and dam was operational in 1910 and designed for flood control and navigation over Lister Rapids. In 1913, the structure was retrofitted with a concrete alternate orifice and slot fishway with two sloping chutes running north and south. Fish can move upstream through the fishway or lock, when operated, and downstream through the fishway, lock, or over the dam (Enders et al. 2019). Species found in the fishway include Walleye (Sander vitreum), Sauger (Sander canadense), Saugeye (S. vitreum x S. canadense), White Sucker (Catostomus commersonii), Shorthead Redhorse (Moxostoma macrolepidotum), Channel Catfish (Ictalurus punctatus), Common Carp (Cyprinus carpio), Silver Chub (Macrhybopsis storeriana), River Shiner (Notropis blennius), Mooneye (Hiodon tergisus), Goldeye (Hiodon alosoides), White Bass (Morone chrysops), and Freshwater Drum (Aplodinotus grunniens) (Willis 1994). Although Bigmouth Buffalo have not been documented in the fishway, they are known to pass the St. Andrews Lock and Dam, both upstream and downstream (Enders et al. 2019).

Receiver deployment

Acoustic telemetry receiver stations (Innovasea, VR2W and VR2Tx, Nova Scotia, Canada, n = 235) were established in the Red River, Assiniboine River, and Lake Winnipeg beginning in 2016. Because the current study is part of a larger, multi-species (n = 9) fish movement research and monitoring program in the basin, receiver distribution and spacing was decided by two main factors: (1) equipment availability through time and (2) location and number tagged. Receivers were gradually added to the study system as they became available (Table S1). Most fish in the overall program have been tagged in S-L, LW, and near the city of Winnipeg, with relatively less tagging outside of Canada. Based on these factors, receiver spacing in the Red River was 30 km in the USA portion of the river, 20 km from the USA border to the south end of Winnipeg, 10 km from Winnipeg to the St. Andrews Lock and Dam, and 5 km from St. Andrews Lock and Dam to Lake Winnipeg (Fig. 1). Five receivers were deployed with a 30 km spacing in the Assiniboine River up to the Portage Diversion (rkm 151; Fig. 1). In 2016, receivers deployed at Drayton, ND, Halstad, MN, and Grand Forks, ND were replaced with the 30 km spacing design. Receivers were further deployed in distributary channels and wetlands associated with Netley-Libau Marsh (n = 8) and into several smaller Red River tributaries, including: Devil’s Creek, Cook’s Creek, Seine River, La Salle River, Rat River, Roseau River, Red Lake River, and Sheyenne River. Receivers in Lake Winnipeg were arranged in a 5 km grid from the mouth of the Red River to just north of Gimli, a 7 km grid from Gimli to the Narrows, and a 14 km grid into the North Basin. By 2022, the total distance covered by the receiver network in rivers was approximately 860 rkm (Fig. 1). All river deployments were switched to VR2Tx receivers in 2017, with the exception of section LW where ∼30% of receivers were still VR2W models in the final study year (Fig. 1, Table S1). Range testing was conducted at a receiver station in the Red River (rkm 24) in 2016, 2017, and 2018 (Table S2).
Receivers were connected to a 12.7 mm threaded rod (∼50 cm long) with four cable ties. The threaded rod was fixed to the center of a ∼45 cm × 45 cm × 10 cm granite block that weight ∼50 kg. A rope ∼12 m long was attached to an eye bolt fastened to the top of the threaded rod. The rope was further attached to a ∼11-14 kg cross net anchor. The anchor was deployed upstream at which time the boat drifted until the rope was nearly tight. The granite block was then lowered in an upright orientation to the bottom, near the thalweg.

Fish capture and tagging

Bigmouth Buffalo (n = 80) were captured by boat electrofishing at eight tagging locations in the Red River drainage (Fig. 1). Tagging efforts spanned 2 years with 40 fish tagged in the La Salle (n = 20) and Seine Rivers (n = 20) in 2016. The additional 40 fish were tagged in 2017 between the Fargo/Sheyenne (n = 8), Halstad (n = 4), Drayton (n = 8), St. Andrews (n = 9), Selkirk (n = 9), and Netley-Libau Marsh (n = 2) tagging locations. Tagging efforts targeted Bigmouth Buffalo near the confluence of major tributaries, downstream of dams, and floodplain habitats. All Bigmouth Buffalo were tagged within 4 rkm of the Red River proper (Fig. 1). Fish were indiscriminately captured and held in tanks filled with ambient river water before being measured for weight (nearest gram), fork length (mm), and total length (mm). Tag burden was minimized by only retaining animals with a body mass > 1.2 kg (<2% tag:body mass; Crossin et al. 2017). To avoid the use of chemical anesthesia, retained fish were placed into the Portable Electroanesthesia System (PES., Smith-Root, Vancouver, WA, USA) for immobilization during surgery. The PES was set to 100 Hz, 25% duty cycle, and 40 V. Pulsed direct current is an appropriate sedation for adult fish because it provides a surgery window of 250–350 s and fish recover quickly with minimal impact to vertebral integrity (Vandergoot et al. 2011). Upon sedation, fish were placed in a padded v-shaped trough. Ambient river water was continuously pumped over the gills using a recirculating flow-through pump system to maintain normal respiration during the surgical period (<5 min). A small incision was made posterior to the pectoral girdle just dorsal of the ventral midline. Sex was determined by attempting to examine gonads through the incision; however, the sex assignment was uncertain for >50% of tagged fish. An acoustic transmitter (Innovasea, V16-4 H, 16 mm diameter, 24 g, 6.5-year battery life, average transmission delay of 120 s with a pseudo-random uniform interval between 80 and 160 s) was inserted posteriorly into the peritoneal cavity. The incision was closed with three to four interrupted stitches (standard surgical knots; 3-0 polydioxanone-II violet monofilament suture; Ethicon, Cincinnati, OH, USA). The tag and all other surgical equipment were soaked in a disinfectant (Betadine; Avrio Health L.P., New York, New York) and rinsed in filtered water prior to use. Surgical gloves were worn to reduce the risk of infection. Post-surgery, fish were placed in a recovery tank for 10–15 min. All fish achieved full recovery as evidenced by their ability to maintain equilibrium and strong reflex reaction to grabbing the caudal peduncle. Upon recovery, fish were released at the tagging location. Fish capture and surgical procedures were approved by Fisheries and Oceans Canada's Ontario, Prairie and Arctic Animal Care Committee (OPA-ACC; FWI-ACC-2016-018, FWI-ACC-2017-001), following the Canadian Council on Animal Care (CCAC) guidelines; and the University of Nebraska-Lincoln's Institutional Animal Care and Use Committee (IACUC; Project ID: 1208), accredited by the Association for Assessment and Accreditation of Laboratory Animal Care (AAALAC).
We used a one-way ANOVA to test for differences in body size (fork length) among tagging locations. Length was log-transformed to achieve homogeneity of variance as indicated by a Levene Test. Pairwise comparisons were evaluated with a Tukey HSD test (α = 0.05). Residuals were visually inspected to further validate the model (Zuur et al. 2010).

Environmental variables

Environmental variables for the Red River were downloaded from online gauging datasets using R packages tidyhydat (Water Survey of Canada, Albers 2017) and dataRetrieval (USGS, De Cicco et al. 2022). Starting in 2017, most receiver models in the river network were VR2Tx that also recorded temperature. Water quality data, collected bi-weekly during the open water season by the City of Winnipeg for each year (e.g., https://legacy.winnipeg.ca/waterandwaste/sewage/monitoring/2017RiversReports.stm), were included to increase the spatial resolution of turbidity and water temperature data. Temperature, discharge, and turbidity data (Fig. 2) were interpolated for any given location and date using distance-based interpolation from the gstat package in R (Pebesma 2004; Gräler et al. 2016).
Fig. 2.
Fig. 2. The locations of the collected water temperature, turbidity, and discharge time series data, with the relative size of the circle indicating the number of observations at that location. Map source: State of North Dakota, Esri, HERE, Garmin, FAO, NOAA, USGS, EPA, and NPS.

Telemetry analysis

Erroneous detections (e.g., due to noise or code collisions) and impossible movements were removed prior to the analysis (Pincock et al. 2010). Initial data processing was completed using the R package actel, which provides a reproducible method for identifying erroneous detections, generating outputs for future analysis, and visualizing fish movements (Flávio and Baktoft 2020). Actel computes movement events based on thresholds of time between detections and minimum number of detections. The initial data filtering procedure identified movements for individual fish when at least two detections were recorded on a receiver. A new movement event was logged when the fish was detected again outside of the one-hour time interval at any given receiver (Flávio and Baktoft 2020).

Fish excluded from analysis

Of 3 689 629 detections, 430 were identified as erroneous based on speed and jump checks in the actel data filtering system. These erroneous detections arose due to overlapping detection ranges and impossible movement speeds among receivers in the Netley-Libau Marsh and the Winnipeg River. Of the 80 tagged Bigmouth Buffalo, one fish was never detected, and nine others were not detected for longer than 1-year post-release, with many failing to transmit in the final year of monitoring (2022) due to battery depletion. Only fish that were considered active for the entire year (detected before the first day of the year of interest and detected after the year of interest) were used for migratory analysis (see below). This criterion subsequently removed the movements from the year when a fish was tagged. The number of individuals included in the analysis ranged between 36 and 69 each study year from 2017 to 2022 (Table S3).

Migration assignment

We defined migration as the directed movement of an individual over a distance greater than that associated with regular daily activities, resulting in redistribution across the landscape for some fitness benefit (Dingle and Drake 2007; Semlitsch 2010). Under this definition, we classified the movements of Bigmouth Buffalo through visual inspection of latitudinal positions over time, changepoint analysis, and metrics that are associated with migratory behaviour (successive unidirectional movements at increased speed). Changepoint analysis allows for the identification of points in a time series where a statistical property changes rapidly (Killick et al. 2012). Due to the orientation of the Red River and the direction of migratory movements, latitude was a sufficient proxy for a fishes broad-scale position in the riverscape (Fig. 1). Detections in the Assiniboine River were excluded from migration assignment because of the small number of fish (n = 4) that occupied the river for extended periods of time. We converted the detected locations of each Bigmouth Buffalo into a time series of daily latitude using the last observation carried forward (LOCF) to fill in days where the fish was not detected (Colborne et al. 2019). The daily latitude of each individual was subset by year before changepoints were identified based on the mean using the changepoint package in R (Killick and Eckley 2014; Killick et al. 2022) and the binary segmentation method, specifying a maximum number of two changepoints (one fall and one spring migration in a year). Outside of the previously documented periods for migrations (April—May, September—October), Bigmouth Buffalo home ranges are typically less than 90 rkm (Enders et al. 2019). Therefore, if an individual made successive unidirectional movements—at speeds > 0.5 m·s−1—to a site > 90 rkm away this increased our confidence that the movement was associated with a migration. Movement speed was calculated automatically by the residency analysis in actel.
Migration assignment was based on a set of rules (see Box S1 for detailed definitions) and conducted by two researchers independently. Discrepancies in the assignments were resolved by joint consensus. Upstream migration was assigned to southward movements from a summer to a winter site, and downstream migrations were assigned to northward movements from a winter to a summer site. We deemed the end of a migration as the first time of arrival on the last day of directed movement (i.e., subsequent movement event was at the same receiver) or the time before a movement in the opposite direction. If an individual appeared to stop or change direction, but then continued its initial path within a two-week period, the movement was still considered to be a migration.
Once each migratory event (upstream departure, upstream destination, downstream departure, downstream destination) was classified, we summarized the characteristics of these events by determining Julian day, water temperature (°C), and latitude of each event. We also determined the total migration distance (rkm) for the upstream and downstream migrations. The cumulative number of fish migrating each week was overlayed on a heatmap of interpolated temperature, flow, and turbidity. To define the migration periods, yearly logistic curves were fit using nonlinear least squares to the cumulative number of fish that migrated each week. A logistic curve has three parameters, the asymptote (aymp = 1), a midpoint when rate is steepest (mid), and a scale parameter which sets the slope of the curve (scale). The logistic curves were fit with nonlinear least squares using a self-starting logistic model (SSLogis) from the R package stats (R Core Team 2023). To determine the statistical significance of the coefficient estimates, we calculated the p-value associated with the Wald statistic. The fitted curve was then used to determine the spring and fall migration periods as all values >0 and <1 for the model fit to the cumulative number of migrators per week in the respective period.

Repeatability

Observations of migratory events for individuals on multiple occasions allowed us to calculate repeatability or the amount of behavioural variation arising from individual differences (Bell et al. 2009). Here, repeatability can be considered as the proportion of total variation in migration that can be attributed to differences between (compared to within) individuals (Nakagawa and Schielzeth 2010). We determined the repeatability and adjusted repeatability of characteristics (i.e., Julian day, water temperature, and latitude of departure and destination; and distance moved) associated with each Bigmouth Buffalo migration (herein referred to as migratory event characteristic) using linear mixed effects models for each migratory event characteristic as the response variables, and transmitter as a random effect (Nakagawa and Schielzeth 2010). Repeatability and adjusted repeatability were calculated using the rptR package in R calculating 95% confidence intervals from 10 000 bootstrap iterations and p-values were estimated using likelihood ratio tests, with a significance level of α = 0.05 (Stoffel et al. 2017). Year was tested as a fixed effect to account for: (1) annual changes in confounding factors that might influence phenology of the trait in question (Biro and Stamps 2015); and (2) estimate relative repeatability across years (i.e., adjusted repeatability), which is typically greater than the estimate of repeatability that ignores time related change (Kürten et al. 2022). Statistical assumptions were visually assessed and validated for each model.

Summer and winter habitat overlap

Daily LOCF datasets of fish locations were split into winter and summer seasons for all fish—regardless of meeting the conditions for migration—by removing the period defined as spring or fall migration using the fitted values from the logistic regression. Overlap between summer and winter ranges was determined using the R package riverdist (Tyers 2022), where values ranged from 0 to 1. A value of 0 represented no overlap whereas all values > 0 were converted to 1 and represented overlap between summer and winter ranges. River sections were defined by potential impediments to movement (Fig. 1). These structures were previously shown to restrict movement resulting in low transition probabilities (Enders et al. 2019). Fish were assigned to the river section in which they cumulatively spent the most time per season. This assignment was then compared to where they spent the most time overall to determine site fidelity (i.e., a binary indicator of whether the fish were in the area most used). Movements into tributaries were also included in seasonal linear home range, with tributaries included in the section where their confluence occurred. Fish that spent most of their time in the Wahpeton to Fargo (W-F) or Lake Winnipeg (LW) sections for a given season were not included in the analysis due to low sample size upstream of the Fargo North RAR and the change from linear (upstream or downstream) to multidirectional movement paths associated with the lake. The proportion of the section used was calculated by dividing home range size by total length of the most used section; values greater than one (i.e., indicating passage across at least one of the obstacles dividing sections) were set to one. Linear mixed models (lme4, Bates et al. 2015) were used to determine: (1) the effect of river section, section use, year, and season, grouped by individual (random intercept), on log-transformed seasonal home range size (distribution = Gaussian); and (2) the effect of river section, section use, grouped by individual (random intercept), on the probability of overlap (distribution = binomial, link = logit). The model was validated by visual inspection of the residuals. While home range and body size are typically related (Mcloughlin and Ferguson 2000), Bigmouth Buffalo lengths were considerably skewed among river sections, thus preventing us from including this term in the analysis of home range size and overlap.

Results

Total length of Bigmouth Buffalo differed significantly by tagging area (F2,77 = 12.75, p < 0.01), with those in the Red River downstream of SALD being significantly larger (0.684 m ± 0.015 SD) than all other areas (Tukey HSD, p < 0.05 in all cases). Fish tagged between Drayton Dam and SALD (0.587 m ± 0.010 SD) were not significantly different than those tagged between Fargo North RAR and Riverside RAR (0.593 m ± 0.020 SD). There were no fish tagged between Riverside RAR and Drayton Dam or between Wahpeton to Fargo North RAR (Fig. 1).

Characteristics of migration

Bigmouth Buffalo only met the criteria for migration in the longest unimpeded section of river (Fig. 3). Generally, these movements were directed downstream in the spring, departing from areas near Drayton Dam to locations around the La Salle and Seine rivers in Canada where a large proportion of fish were tagged (mean distance = 210 rkm ± 107 SD). Subsequent upstream movements in the fall were from Canada to locations in the United States, generally downstream of Drayton Dam (rkm 280–310; 82% of destinations). In smaller sections of the river and the Assiniboine, movement patterns tended to be less directed (Fig. 3). Individuals in the section downstream of SALD moved regularly between the dam and into Netley-Libau Marsh, occasionally spending time in Lake Winnipeg. One individual moved approximately 60 km from the mouth of the Red River to Traverse Bay in the southeast portion of Lake Winnipeg. Individuals in the upper portions of the array (sections R-D, F-R, W-F; Fig. 1) often remained in their tagging section, but some individuals made longer distance movements outside of the reach in which they were tagged. Bigmouth Buffalo movement patterns were typically within the Red River proper for the majority of this study. Only two individuals spent greater than 50% of their time in tributaries, but over 88% were detected moving into a tributary at some point. The average proportion of time spent in tributaries was estimated at 13.2% (SD = 16.3%).
Fig. 3.
Fig. 3. Daily movements of three individual fish (IDs 19234, red dots, 20035, green dots, and 14985, blue dots) that represent typical movements in different sections of the river, with barriers indicated by the red horizontal lines, along with an orange horizontal line indicating the rehabilitated Riverside Dam (ND) and Fargo North Dam locations, and a green horizontal line indicating the confluence of the Red River with Lake Winnipeg. Map source: State of North Dakota, Esri, HERE, Garmin, FAO, NOAA, USGS, EPA, and NPS.
Migratory individuals generally moved from the United States to Manitoba in the river section between SALD and Drayton Dam. Spring movements from overwinter to spawning/summer ranges often began between rkm 252 and rkm 370 (near Drayton Dam; 70% of departures). Directed movements typically ceased between rkm 102 and rkm 112 (near the La Salle River; 63% of destinations). Most downstream migratory movements occurred after ice out when temperatures were rising. Downstream departure water temperatures averaged 10.6 °C (SD = 5.92), opposed to destination temperatures on the day of arrival of 12.6 °C (SD = 5.48). Upstream migration movements in the fall usually started between rkm 72 and rkm 132 (near the city of Winnipeg; 81% of departures) and ended below the Drayton Dam (rkm 280–310; 82% of destinations). The notable exception to this pattern occurred in 2019 and 2022, the only years that directed movements concluded upstream of Drayton Dam. Upstream migrations coincided with decreasing temperatures where departures (16.5 °C ± 0.7 SD) had higher temperatures than the destination areas (12.9 °C ± 1.0 SD) on the day of arrival. Temperature on the day of arrival to downstream destinations was on average 3.6 °C lower than the temperature on the day of departure (paired one way t test,p < 0.05).
The average speed of fish migrating upstream was 0.273 m·s−1 (n = 1093, SD = 0.141) with a range of 0.003–0.883 m·s−1 compared to fish migrating downstream with an average of 0.715 m·s−1 (n = 988, SD = 0.464) and range of 0.002–1.960 m·s−1. Speeds during non-migratory behaviours averaged 0.374 m·s−1 (SD = 0.323) with observed maximum speed of 2.46 m·s−1. Movement speeds exceeding 1.75 m·s−1 (n = 20) were only observed between receiver arrays with spacing of less than 10 rkm. Movement speed had a weak positive correlation with temperature (r = 0.21, p < 0.01) and day length (r = 0.30, p < 0.01).
There were differences in the proportion of migratory individuals between years and between tagging locations (Fig. 4). Fish tagged in the La Salle and Seine rivers consistently had higher proportions of migratory individuals than the other tagging locations. There was additional variation in the proportion of migratory individuals across years within tagging groups; however, the proportion of migratory individuals in the entire tagged population remained relatively stable (Fig. 4). Of Bigmouth Buffalo that migrated at some point (n = 39), most individuals (n = 31) skipped migratory movements during at least two years of observation. Of individuals that were consistent in migratory behaviour (skipped one or fewer migrations, n = 8), all except one of those individuals were tagged in the La Salle or Seine rivers.
Fig. 4.
Fig. 4. Percentage of Bigmouth Buffalo migrating each year by tagging group and across all groups. The Netley-Libau Marsh, Halstad, and Fargo/Sheyenne tagging groups were excluded from the depiction as no observed migrations were recorded for fish in these locations.
Most (75%) of the 20 fish tagged downstream of SALD were able to pass upstream of the structure at some point and three individuals passed three or more times. Upstream passages only occurred between April and September, with the highest number recorded in August (n = 11). Seven fish that successfully passed SALD also made migratory movements. Only one of these individuals showed consistent annual migratory behaviour after passing the dam. While eight of the fish did not migrate after passing SALD, most remained in upstream sections for several years. For example, after passing SALD in the fall of 2019, one individual swam to areas near the Halstad tagging location where it remained for the entire study (Fig. 1). Bigmouth Buffalo were not observed traveling upstream through the Red River floodway control structure while it was in operation (Fig. 1).
The majority of tagged individuals were able to pass upstream over Drayton Dam during the study (n = 43), with a total of 120 upstream passage events. Nine fish were detected at the closest downstream receiver but never passed the dam. Due to receiver spacing, we cannot determine if those fish made passage attempts. Upstream passages over Drayton Dam did not occur outside of March-October. April (n = 48) and May (n = 29) had the highest number of passes followed by September (n = 12), October (n = 11), June (n = 11), July (n = 5), March (n = 2), and August (n = 2). Many of the spring passes were associated with migratory individuals that overwintered downstream of the dam and moved upstream before making a return trip downstream. Upstream passage over the other dams was less common, with 27 of these events recorded at the Riverside RAR and only four over the Fargo RAR.

Repeatability of migratory characteristics

Repeatability analyses for Bigmouth Buffalo phenology of migratory events showed that individual repeatability was <0.4, such that fish reached their winter destinations with some annual consistency (Julian day; upstream destination: R = 0.192, p = 0.023; Table 1). Further, individuals tended to depart from the same winter location (latitude of upstream departure: R = 0.215, p < 0.015; Table 1) and returned to similar spawning/summer locations (latitude of downstream destination; R = 0.548, p < 0.001; Table 1; and downstream departure: R = 0.222, p < 0.008; Table 1) annually. Stream temperatures at the onset of downstream migration were consistent across years (temperature of downstream departure: R = 0.328, p = 0.002; Table 1). The timing of spring migration (Julian day of downstream departure), the distance of fall migration (distance upstream), the temperature when spring migrations ended (downstream destination temperature), and the latitude of winter locations (latitude of the upstream destination) were inconsistent across years (p > 0.05 in all instances; Table 1). Adding year as a fixed effect to the linear mixed effect models prior to calculating repeatability accounted for some of the model variance and increased estimates (Table 1).
Table 1.
Table 1. Repeatability estimates (R) for migration events across years for Bigmouth Buffalo with two or more years of observations.
  Agreement repeatabilityAdjusted repeatability (year as fixed effect)
MetricEventRSECI (95%)pRSECI (95%)p
Julian DayUpstream departurea0.0110.0560.000–0.1870.4980.1700.1000.000–0.3730.040
 Upstream destinationa0.1360.0970.000–0.3420.0720.2810.1080.053–0.4810.002
 Downstream departureb0.0600.0750.000–0.2540.2950.4280.1090.190–0.617<0.001
 Downstream destinationb0.0000.0520.000–0.1761.0000.0000.0000.000–0.0000.500
DistanceUpstreama0.0000.0500.000–0.1731.0000.0470.0690.000–0.2340.271
 Downstreamb0.1490.0960.000–0.3500.0570.3530.1120.114–0.554<0.001
TemperatureUpstream departurea0.0000.0500.000–0.1711.0000.0150.0590.000–0.1960.431
 Upstream destinationa0.1290.0910.000–0.3270.0780.3080.1090.078–0.4990.001
 Downstream departureb0.3280.1090.099–0.5240.0020.4960.1040.262–0.669<0.001
 Downstream destinationb0.0000.0500.000–0.1711.0000.0750.0800.000–0.2730.245
LatitudeUpstream departurea0.2150.1030.003–0.4110.0150.1840.1010.000–0.3850.027
 Upstream destinationa0.0850.0810.000–0.2730.1840.1160.0900.000–0.3150.083
 Downstream departureb0.2220.1040.010–0.4210.0080.4190.1090.183–0.605<0.001
 Downstream destinationb0.5480.0990.317–0.703<0.0010.5670.0980.341–0.723<0.001

Note: Confidence intervals were estimated through parametric bootstrapping and p-values are estimated through likelihood ratio tests (Stoffel et al. 2017). Sample sizes are denoted by superscripts (= 30 individuals, 108 observations; b = 29 individuals, 105 observations). Statistical significance is defined by asterisks (p < 0.001***, p < 0.01**, p < 0.05*). Upstream departure = leaving summer range; Upstream destination = arriving at winter range; Downstream departure = leaving winter range; Downstream destination = arriving at summer range.

Migratory periods

The start, end, and length of the migration periods were variable across years and seasons (Fig. 5). Spring migration was initiated alongside distinct changes in several measured environmental variables including an increase of water temperature, higher flows, and a spike in turbidity (Fig. 5). No clear change was observed in the measured environmental variables to indicate the end of spring migration or start of fall migration (Fig. 5). The midpoint of the spring migration ranged from early April (week 14 in 2021) to early May (week 19 in 2020), depending on year (Table 2). The widest spring migration start date range was in 2022 (scale parameter = 0.67) and the narrowest in 2021 (scale parameter = 2.70, Table 2). Fall migration midpoint ranged from late September to late October (Table 2). The widest fall migration start date range was in 2018 (scale parameter = 0.61) and the narrowest in 2021 (scale parameter = 1.68, Table 2).
Fig. 5.
Fig. 5. Cumulative weekly proportion of migratory Bigmouth Buffalo in their summer habitat for each year in the spring (green points) and fall (blue points) with the predicted values from the logistic regressions (grey lines) used to determine seasons (1 = summer, 0 = winter), overlayed on a heatmap of the interpolated temperature, discharge, and turbidity across latitudes between Drayton Dam, ND (lower most latitude, upstream) and the St. Andrews Lock and Dam, MB (uppermost latitude, downstream).
Table 2.
Table 2. Parameter values (mid, scale), estimate (E), standard error (SE), Wald Statistic (WS), and p-value (p) for logistic curves fit using non–linear least squares to weekly cumulative number of fish that started their migration per year and season.
ParameterYearSeasonESEWSp
mid2017Fall38.10.0902422<0.001***
Spring15.10.0386390<0.001***
2018Fall37.60.03241160<0.001***
Spring18.60.0730255<0.001***
2019Fall36.10.0491735<0.001***
Spring18.10.0914198<0.001***
2020Fall37.10.1270292<0.001***
Spring19.00.0783243<0.001***
2021Fall34.70.1300267<0.001***
Spring14.50.1280113<0.001***
2022Spring18.00.1180152<0.001***
scale2017Fall1.340.079416.8<0.001***
Spring0.670.034219.5<0.001***
2018Fall0.610.028222<0.001***
Spring1.090.064317<0.001***
2019Fall0.840.043219<0.001***
Spring1.760.080522<0.001***
2020Fall1.250.112011<0.001***
Spring1.040.068915<0.001***
2021Fall1.680.114015<0.001***
Spring1.420.113013<0.001***
2022Spring2.700.104026<0.001***

Note: Statistical significance is defined by asterisks (p < 0.001***).

Summer and winter range size and overlap

On average, winter mean home ranges were smaller (23.5 km) than summer mean home ranges (48.9 km, Fig. 6a). On average, seasonal home ranges encompassed a greater percentage of the total river section in summer (35.4%) than winter (13.3%, Fig. 6b) and was highest in summer in the section of river between SALD and Lake Winnipeg where measured geographic space was most limited (90%, Fig. 6b). The top two models for summer and winter home range size included season, and one of the top two models further contained site fidelity (top model is presented in Table 3), all other models ΔAIC > 2 (Table S4). Home range size was significantly larger in the summer and when fish were outside their most used section. The proportion of variance explained by the random effect of individual ID was low (ICC = 0.06) and including ID as a random effect was a small improvement to the explained variance (marginal R2 = 0.128, conditional R2 = 0.184). There remained a sizable portion of the variance in home range size not explained by the model. Importantly, the absence of river section from the top model indicated that it provided little explanatory power (Table 3).
Fig. 6.
Fig. 6. Home range size (a) and proportional use (b) across seasons (winter, summer) and river sections (Fargo North Dam, ND to Riverside Dam (F-R), Riverside Dam to Drayton Dam (R-D), ND, Drayton Dam to St. Andrews Lock and Dam, MB (D-S), and St. Andrews Lock and Dam to Lake Winnipeg, MB (S-L)); overlap (when > 0) between winter and summer home range (c); and predicted probability of overlap across river sections (d).
Table 3.
Table 3. Results of linear mixed models for seasonal (winter and summer) log transformed home range size (n = 683) and overlap (0, 1) between consecutive winter and summer home ranges (n = 321), for different river sections (Fargo North Dam, ND to Riverside Dam, ND (F-R), Riverside Dam, ND and Drayton Dam, ND (R-D), and St. Andrews Lock and Dam to Lake Winnipeg, MB (S-L)), with individual fish as random effects (N = 75, 69).
 log(range)
PredictorsEstimatesCIp
(Intercept)10.209.90–10.51<0.001***
Season (winter)−1.06−1.26 to −0.86<0.001***
InAreaMostUsed (fidelity)−0.29−0.58 to −0.000.047*
Random effects   
σ21.78  
τ000.12  
ICC0.06  
N75  
Observations683  
Marginal R2/conditional R20.128/0.184  
 Overlap
PredictorsOdds RatiosCIp
(Intercept)0.360.23–0.55<0.001***
Section (F-R)2.781.03–7.490.043*
Section (R-D)0.620.19–2.090.445
Section (S-L)6.372.94–13.82<0.001***
Random effects   
σ23.29  
τ000.87  
ICC0.21  
N69  
Observations321  
Marginal R2/conditional R20.134/0.315  

Note: InAreaMostUsed represents whether fish showed fidelity to the river section in which they used for the greatest number of days. For the home range size model, the intercept estimate can be used to calculate the effects for Summer and where fish passed in-stream structures, i.e., Section Passage. For the overlap model, the intercept estimate can be used to calculate the effect the section of river between Drayton Dam, ND and Andrews Lock and Dam, MB (D-S), on the probability of overlap. Statistical significance is defined by asterisks (p < 0.001***, p < 0.01**, p < 0.05*). The Random Effects section includes the distribution specific variance (σ2), the random intercept variance (τ00), the interclass correlation coefficient (ICC), and the number of unique fish (N). Also included is the marginal and conditional coefficient of determination (R2) and total number of observations used in the model.

In most instances, there was no overlap between the winter and summer ranges (198/321 observations). The average winter and summer range overlap was 26.8% when overlap occurred (overlap > 0; Fig. 6c). The top two models for summer and winter overlap included river section, and one of the top two models further contained site fidelity, although site fidelity was not significant (top model is presented in Table 3), all other models ΔAIC > 2 (Table S4). The probability of overlap was highest downstream of SALD (Table 3, Fig. 6d). Although higher than the home range model, variance explained by including individual ID as random effect was low (ICC = 0.21). Including ID as a random effect more than doubled the variance explained (marginal R2 = 0.134, conditional R2 = 0.315).

Discussion

Long-term monitoring of individual Bigmouth Buffalo movements in the Red River revealed notable differences in migratory behaviour and the use of distinct seasonal home ranges across river sections in a fragmented river network. The comparison of seasonal home range overlap and size between river sections of different lengths indicated an upper and lower bound to summer home range sizes for Bigmouth Buffalo. These findings add to the limited body of information available to resource managers tasked with conserving or restoring Bigmouth Buffalo and its habitat.
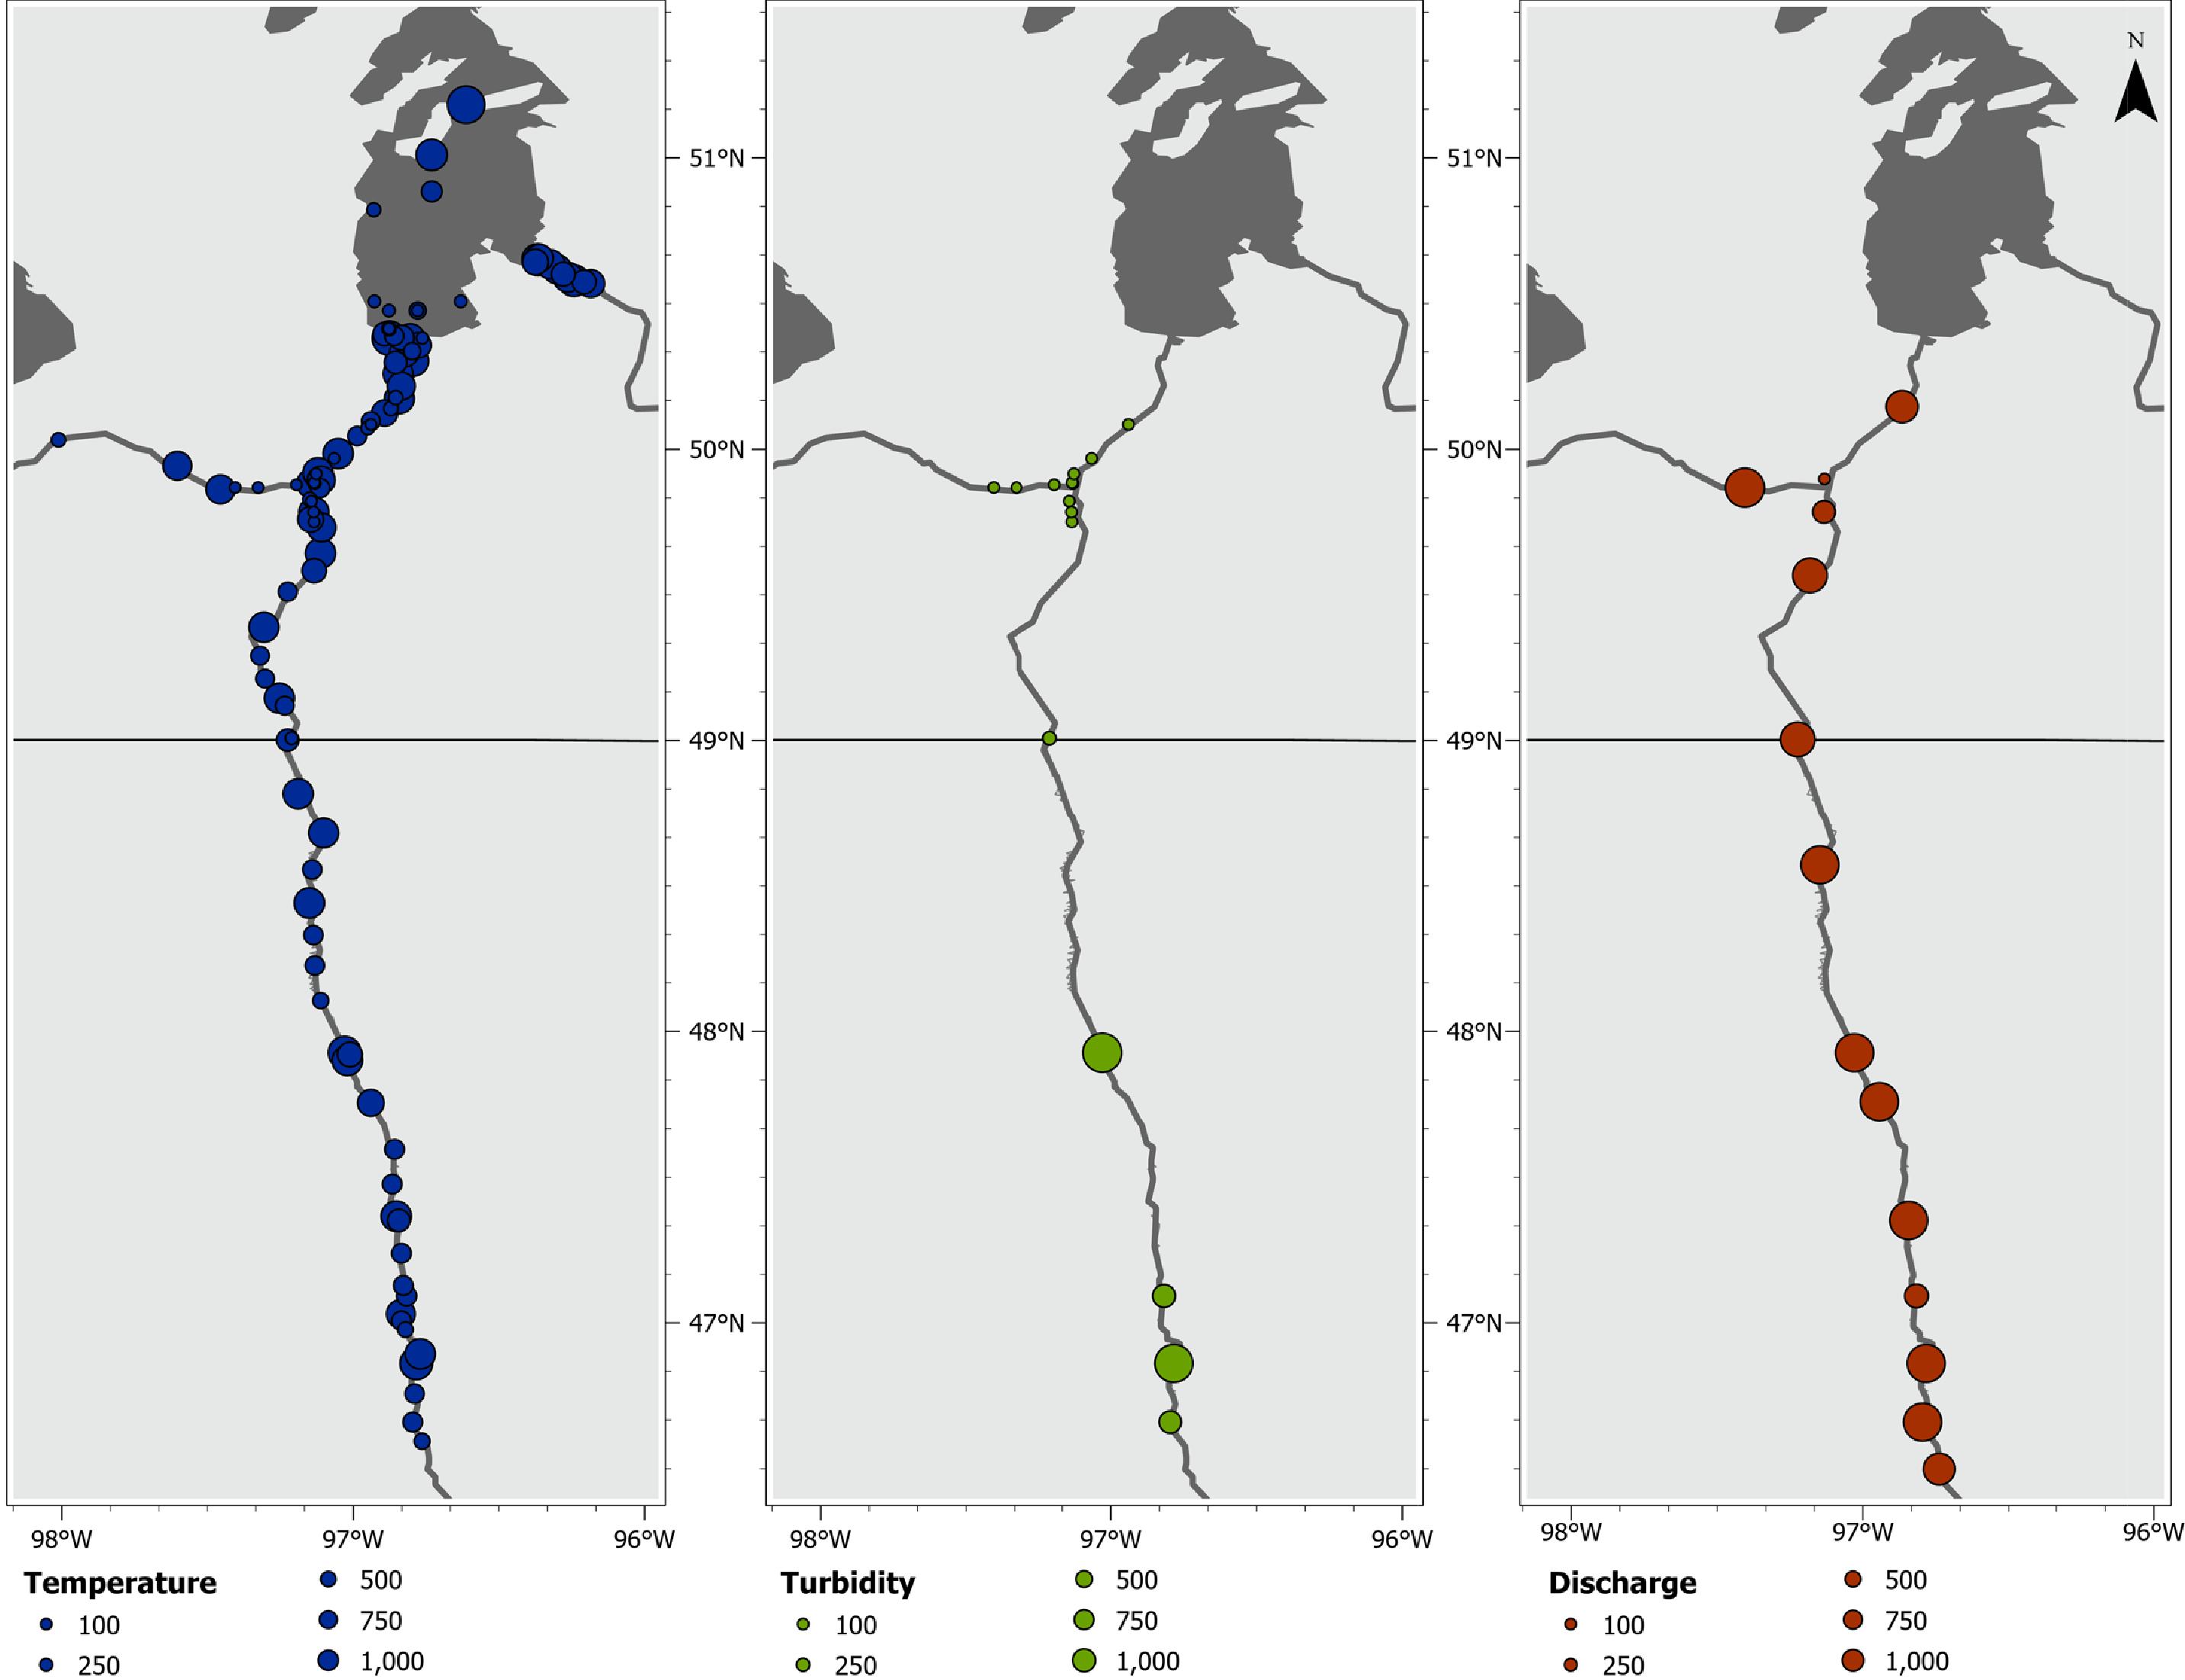
Many spring migrations, likely coinciding with reproduction (COSEWIC 2009), started with a rapid increase in water temperatures and higher river discharges (Fig. 5). The downstream destination was the most repeatable behaviour estimated (Table 1), and observations of spawning activity and sexually mature fish in the La Salle River support the assertion that Bigmouth Buffalo use this tributary for spawning (Watkinson DA, personal observation). There was high individual variation in the start and end dates of spring migration (Table 1), with many fish departing several weeks later in the season. By this time, summer water temperatures had nearly peaked and spring flows were considerably decreased (Fig. 5). Low variability in the timing of spring spawning migration is generally considered necessary to derive fitness benefits from enhanced breeding success (Hulthén et al. 2022 and refences therein); however, a number of species, particularly those considered long-lived or burdened by high reproductive costs (e.g., long migrations), will skip spawning as a survival tactic to offset mortality (Jørgensen et al. 2006; Lowerre-Barbieri et al. 2011; Rideout and Tomkiewicz 2011; Gallagher et al. 2018). Among the longest-lived teleosts, Bigmouth Buffalo are known to skip spawning (Lackmann et al. 2021; 
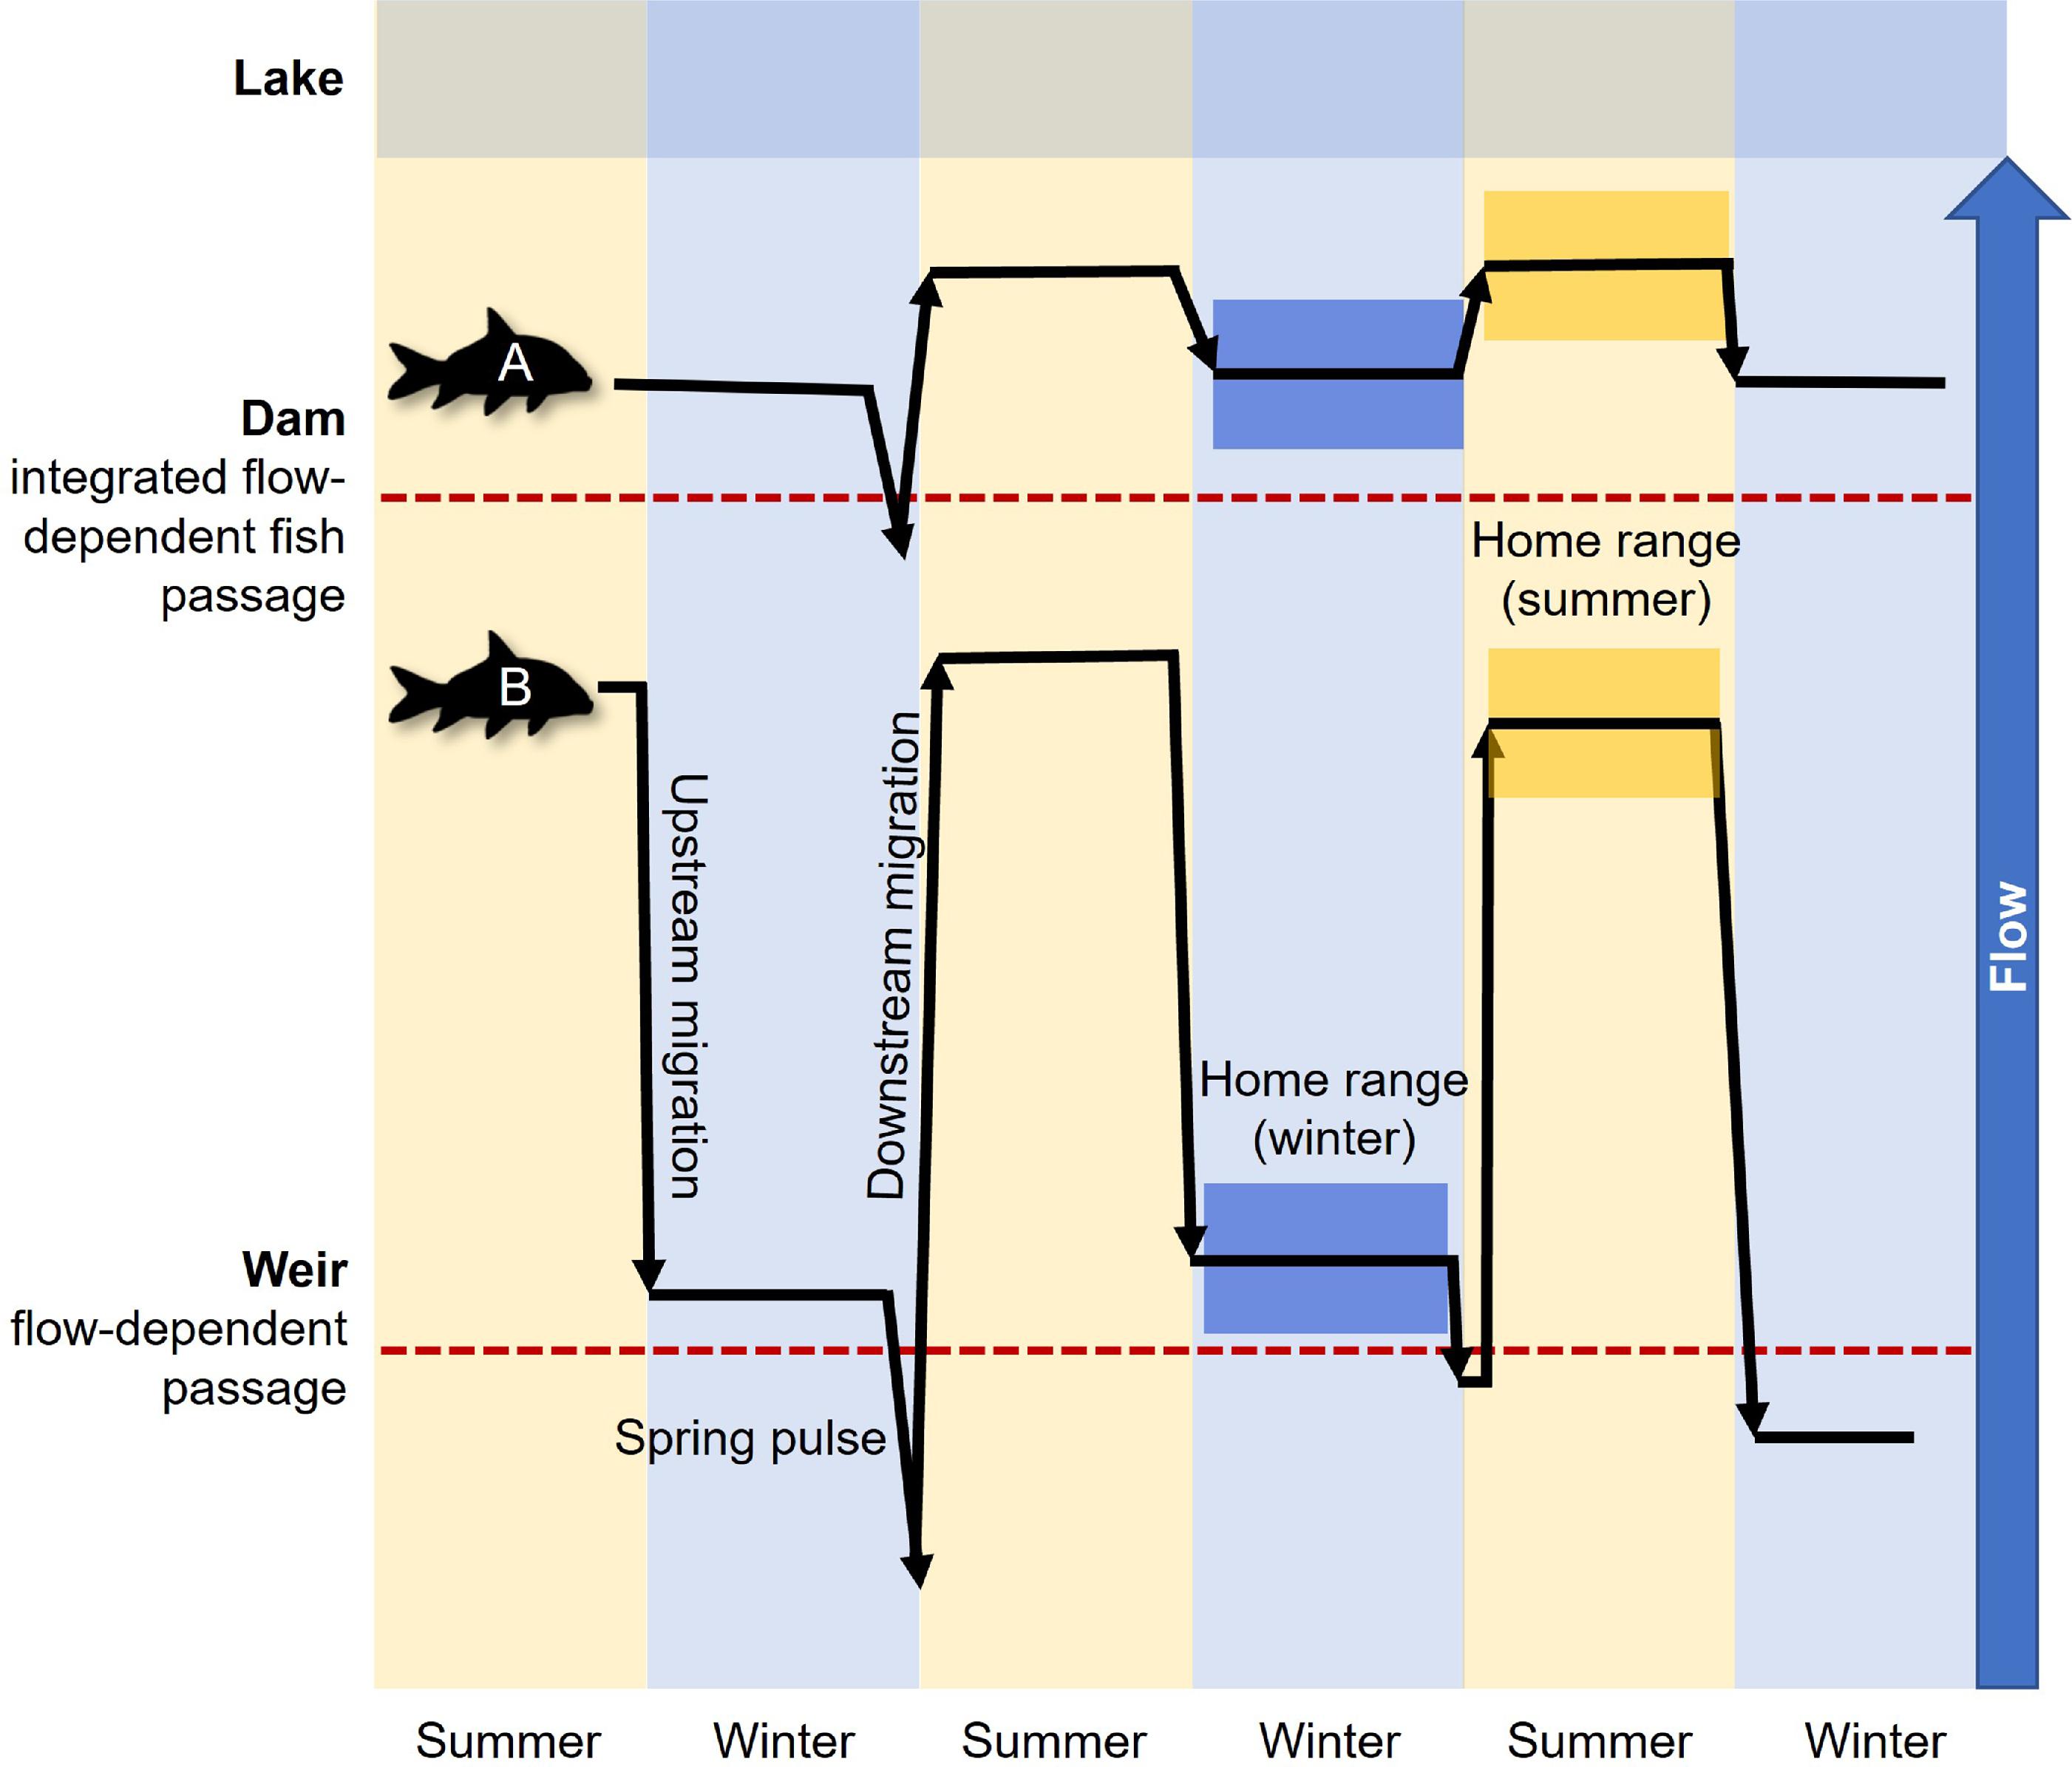
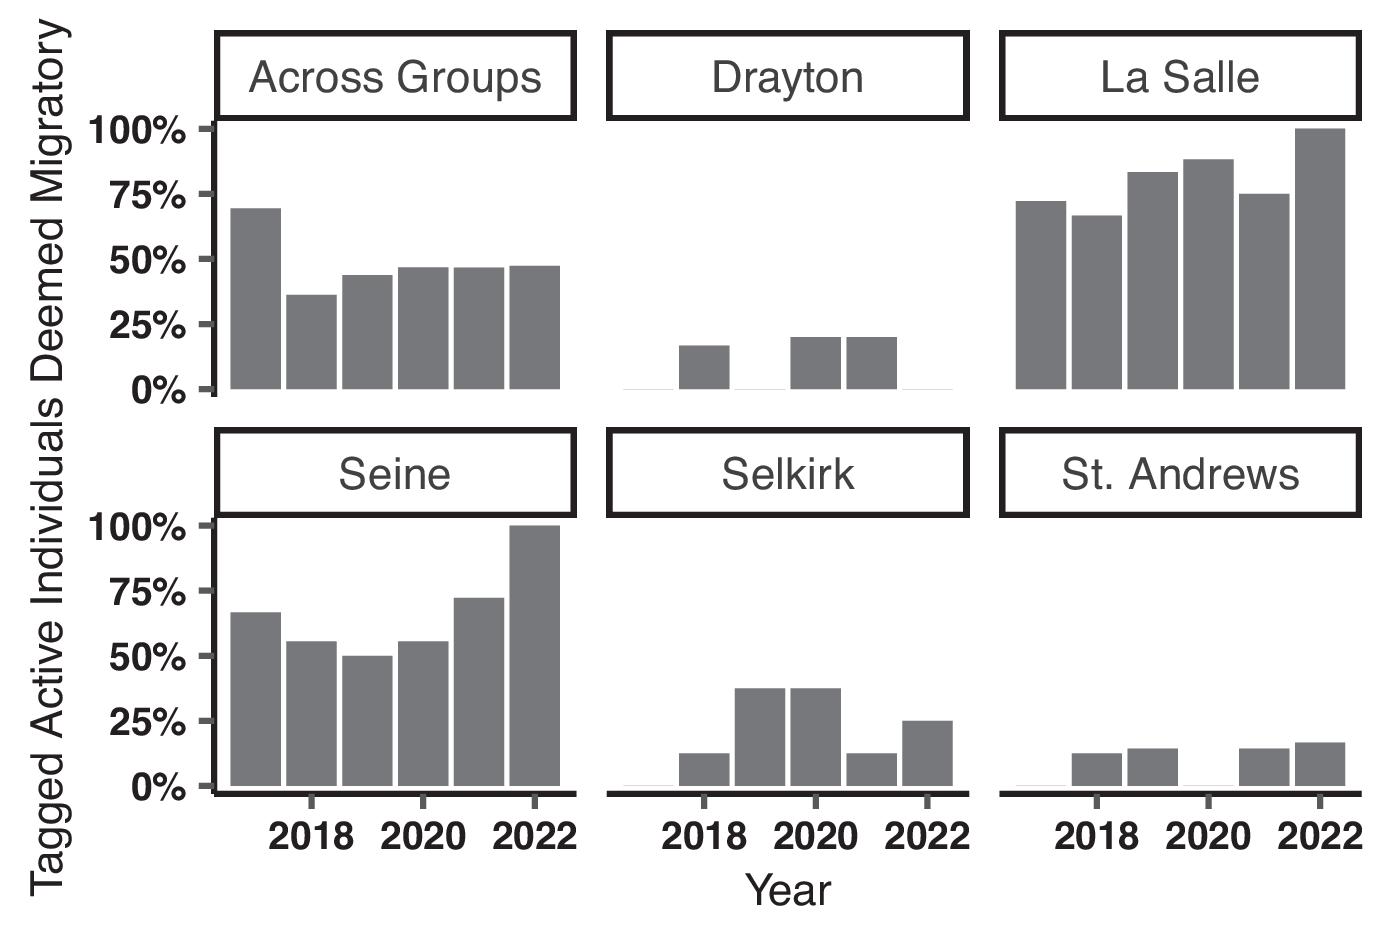
Lackmann et al. 2023). If this occurs, migration can still provide lifetime fitness benefits if the broader destination serves as the summer feeding grounds. Moreover, individuals that failed to migrate at all (Fig. 4) show that partial migration also occurs in the system (Chapman et al. 2012). Documenting this phenomenon here is important, as partial migration can stabilize and bolster population resilience in heterogenous environments (Kerr et al. 2010; Chizinski et al. 2016; van Leeuwen et al. 2016).
For spawning Bigmouth Buffalo, flood duration and timing may be among the primary drivers of the observed migration to downstream reaches where flooded riparian vegetation provides ideal habitat in the Red River. These spring conditions are both reflected by the environmental data (
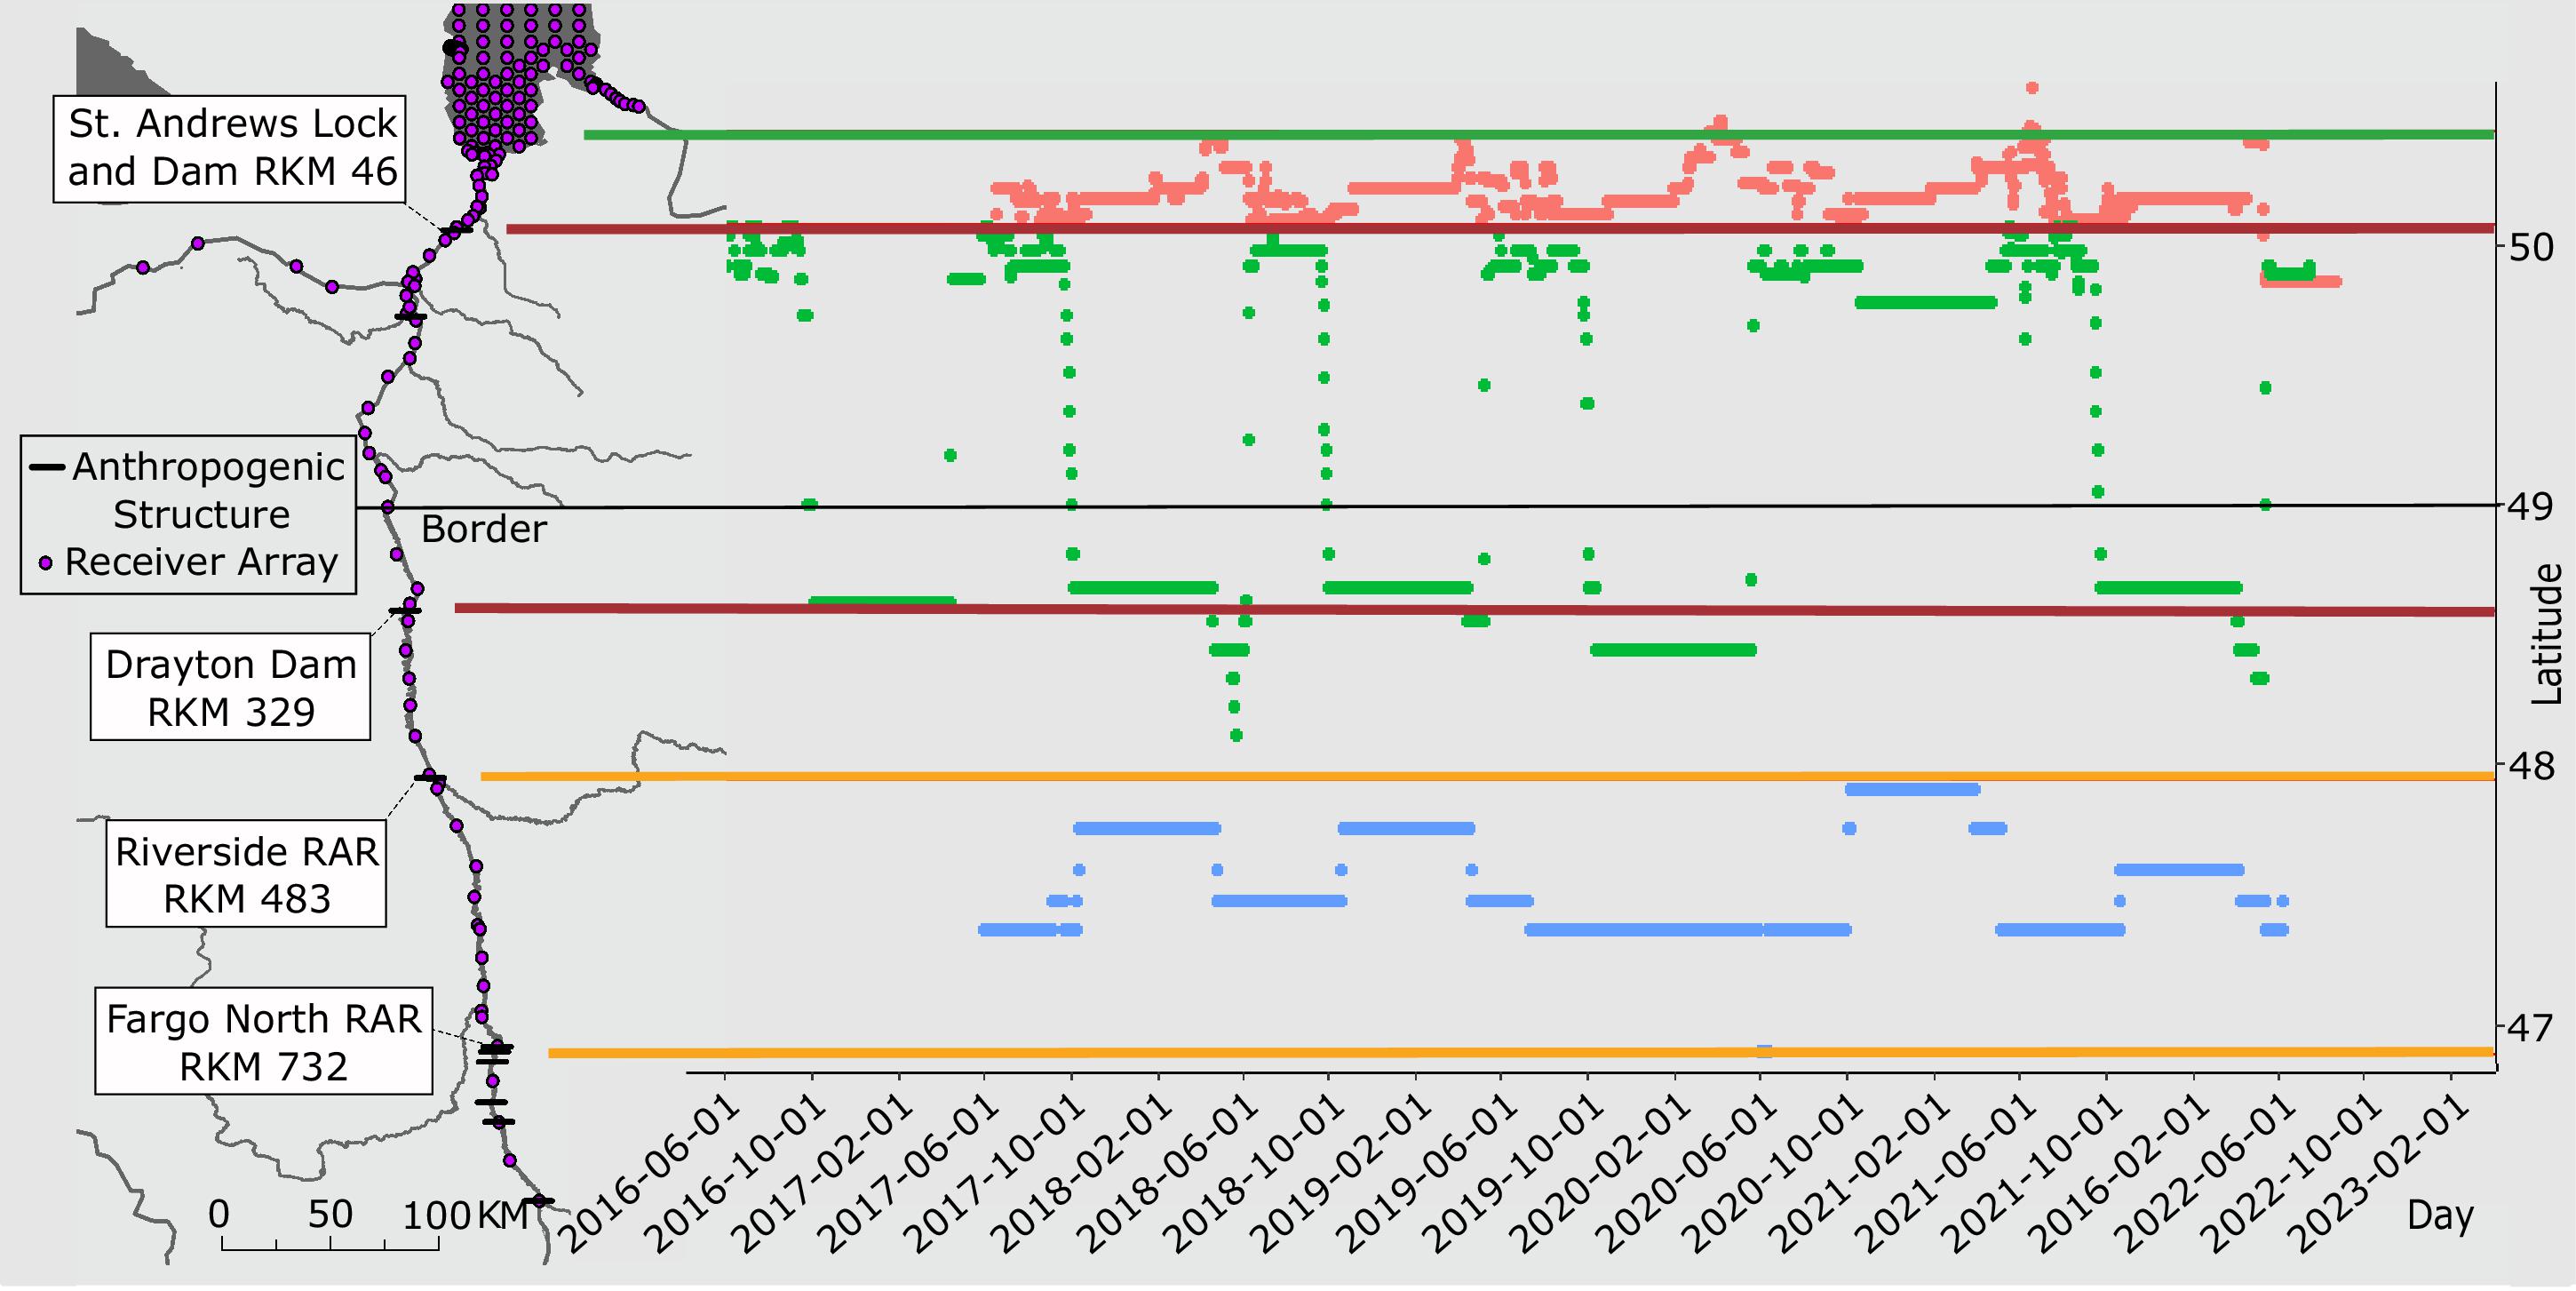
Fig. 5) and relatively lower detection frequency observed during downstream migration (Fig. 3). On average, the lower slope and higher discharge of the Red River near Winnipeg results in lower water level fluctuations relative to upstream reaches (ECCC 2023). The peak of the spring flood begins in the US portion of the watershed and moves downstream, thus peaking in Canada later in the year. Flood duration is longer in Canada than in upstream reaches, despite less change in water surface elevation (ECCC 2023). Water surface elevation of the Red River upstream of the La Salle and Seine rivers throughout the City of Winnipeg is influenced by SALD, which annually floods portions of the ephemeral river channels. Downstream of SALD, water surface elevation of the Red River may be further influenced by the seiche effect of Lake Winnipeg, resulting in capricious floodplain inundation (ECCC 2023). This could result in Bigmouth Buffalo releasing eggs onto habitat that in hours or days becomes dry with changing water surface elevation. Common Carp have been observed spawning in flooded cattail (Typha glauca) in Netley-Libau Marsh, where water depth was ∼70 cm but completely dry the following day. Larval stranding has been documented for Bigmouth Buffalo in Pound Lake, Saskatchewan (Lackmann et al. 2023). In the Red River, Bigmouth Buffalo spawning downstream of SALD may still have reduced success in years when seiche effects on water surface elevation are high. Such changes to the duration and timing of flooding, in addition to surface temperatures, likely further explain some of the observed variability in migratory behaviour. Additional data are needed to understand flood impacts on behaviour and spawning success.
While reproduction is the most parsimonious explanation for spring migration in mature individuals, and appears to be driven by environmental cues, the fall upstream migration to overwintering habitat is more puzzling. Individuals typically departed from similar latitudes and concluded unidirectional movements around the same time each year (Julian day of upstream destination; Table 1). Unlike the spring migrations, fall movements did not appear to be initiated by a clear environmental cue, besides decreasing temperatures (Fig. 5) that were significantly lower at time of arrival compared to the onset of migration. The energetic benefits provided by overwintering habitat must outweigh the costs of moving. In the absence of a clear environmental cue or reproductive requirement, we hypothesize that the fall upstream migration is an adaptive strategy to align with a downstream progression, or “green wave,” of resources during the ensuing spring (van der Graaf et al. 2006; Bischof et al. 2012). Although suggested for migrating Arctic Char (Salvelinus alpinus) that “jump” ahead of system productivity (Hammer et al. 2022), this hypothesis is rarely applied to aquatic systems. Given the synchronization between plankton blooms and ice-off (Hrycik et al. 2012), the earlier onset of ice-off upstream likely triggers a series of cascading downstream plankton blooms facilitated by increasing light availability and nutrients delivered by snowmelt (Corriveau et al. 2011). During the fall, Bigmouth Buffalo seek the furthest upstream sites possible, partially blocked only by Drayton Dam, to capitalize on the most profitable spring plankton bloom. Annual discharge offers some support for this hypothesis, as Bigmouth Buffalo ended fall migrations downstream of the Drayton Dam every year except for 2019 and 2022, which coincided with unusually high fall flow events that made the dam passable upstream during the migration window (Enders et al. 2019). Improved passage potential over Drayton Dam resulted in longer and more variable fall migration distances in 2019 than the other years. For example, in 2019 the mean upstream migration distance was 325 rkm (SD = 157) compared to the next highest and less variable distance of 206 rkm (SD = 40) in 2021. Construction was completed in 2023 to replace the Drayton Dam with a full river width rock-rapids style fishway. Assuming the new structure improves passage over a range of flows, it follows that annual fall migrations by Bigmouth Buffalo will continue farther upstream to exploit the fitness benefits of this now fully accessible habitat.
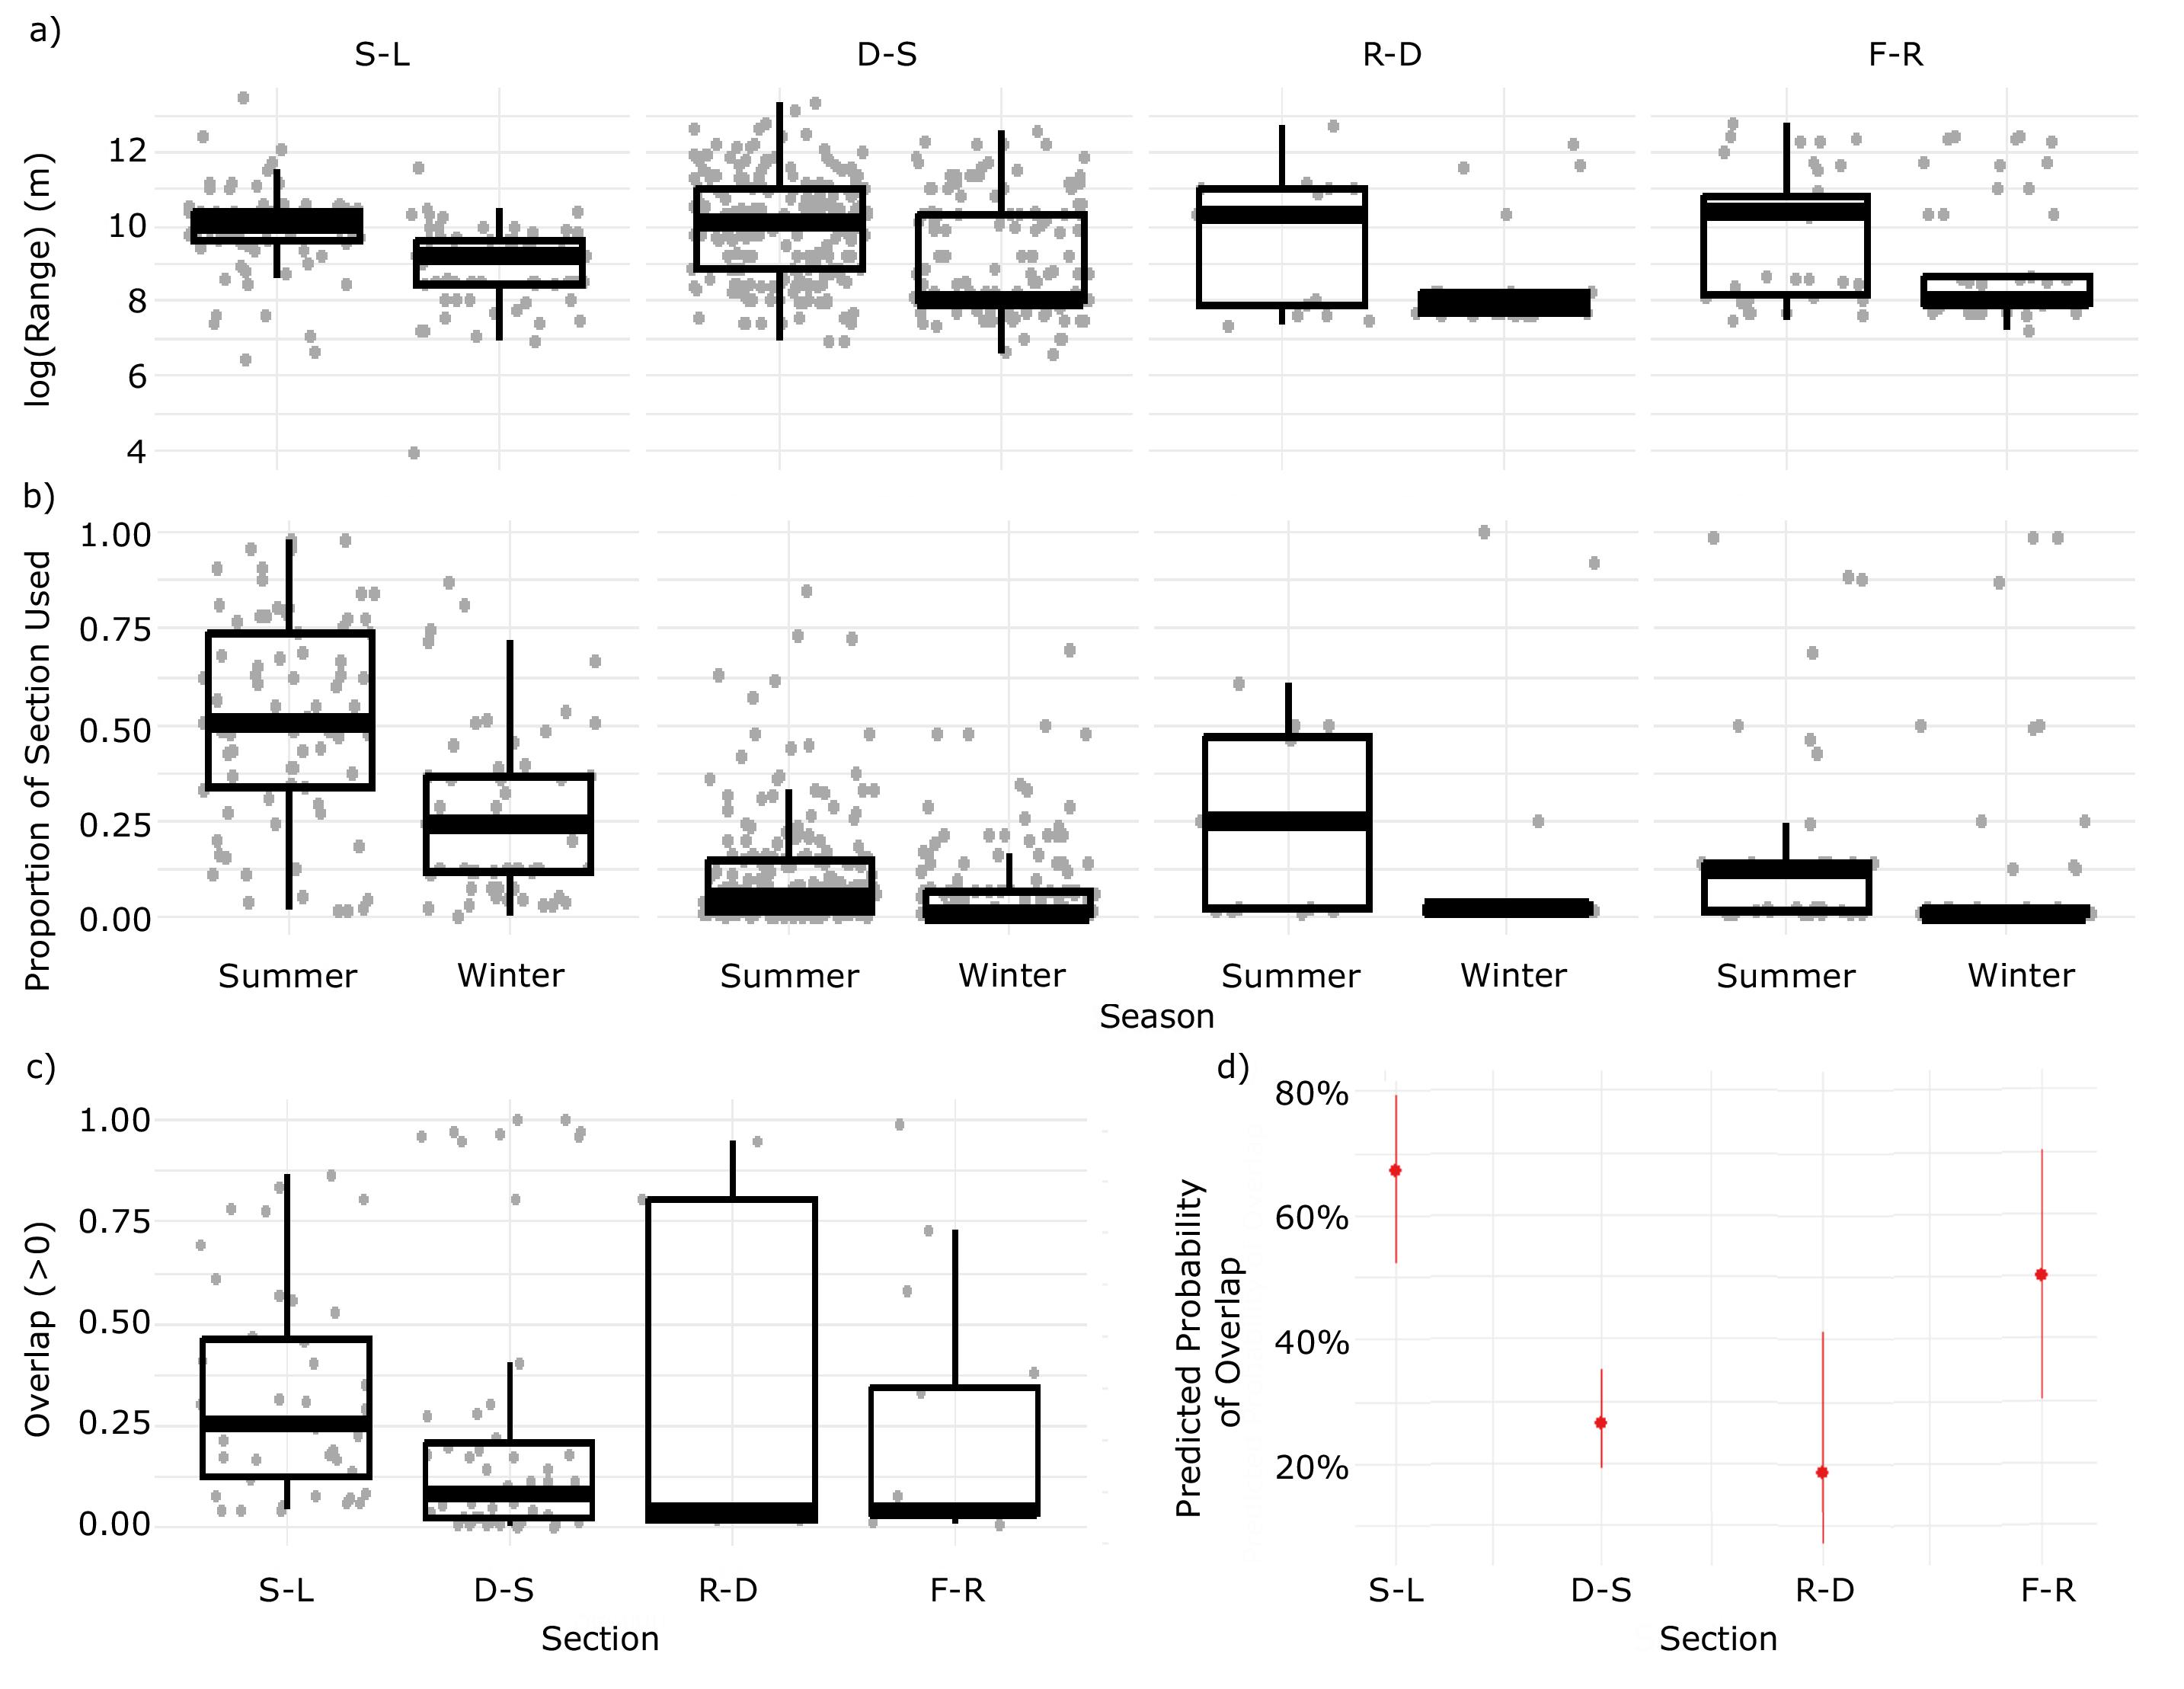
Home range size did not vary significantly between river sections; however, the proportion of river section covered by an individual's median home range decreased with section length (Fig. 6). Despite the high degree of heterogeneity in available habitats between SALD and Lake Winnipeg (Enders et al. 2019), summer-winter home range overlap was relatively high in this section. For Bigmouth Buffalo, there appears to be an upper bound, similar to migratory Blue Sucker (Cycleptus elongatus) in the middle Missouri River (Neely et al. 2009), and a lower bound for home range size. These limits can be mediated by resource availability and concurrent factors such as individual body size (Woolnough et al. 2009), social interactions (e.g., dominance; Bachman 1984) or predation risk (Lima 1998) and harvest (Marantz et al. 2016). In the Red River system, the upper and lower bounds were season specific, with winter home ranges notably smaller than observed in summer. In fact, several of the individuals were only detected at a single receiver in winter. This reduction of home range size is expected, as fish reduce metabolic rate and activity with decreasing water temperature (McMeans et al. 2020). With additional environmental and fish detection data, such observations will be crucial for understanding the impact of climate change on migratory behaviour (Robinson et al. 2009; Kubelka et al. 2022; Howard et al. 2023). For example, genomics, recruitment surveys, or fish community dynamics could help reveal the indicators and consequences of climate change and river fragmentation on Bigmouth Buffalo (Newson et al. 2009; Bloomfield et al. 2022; Lackmann et al. 2023).
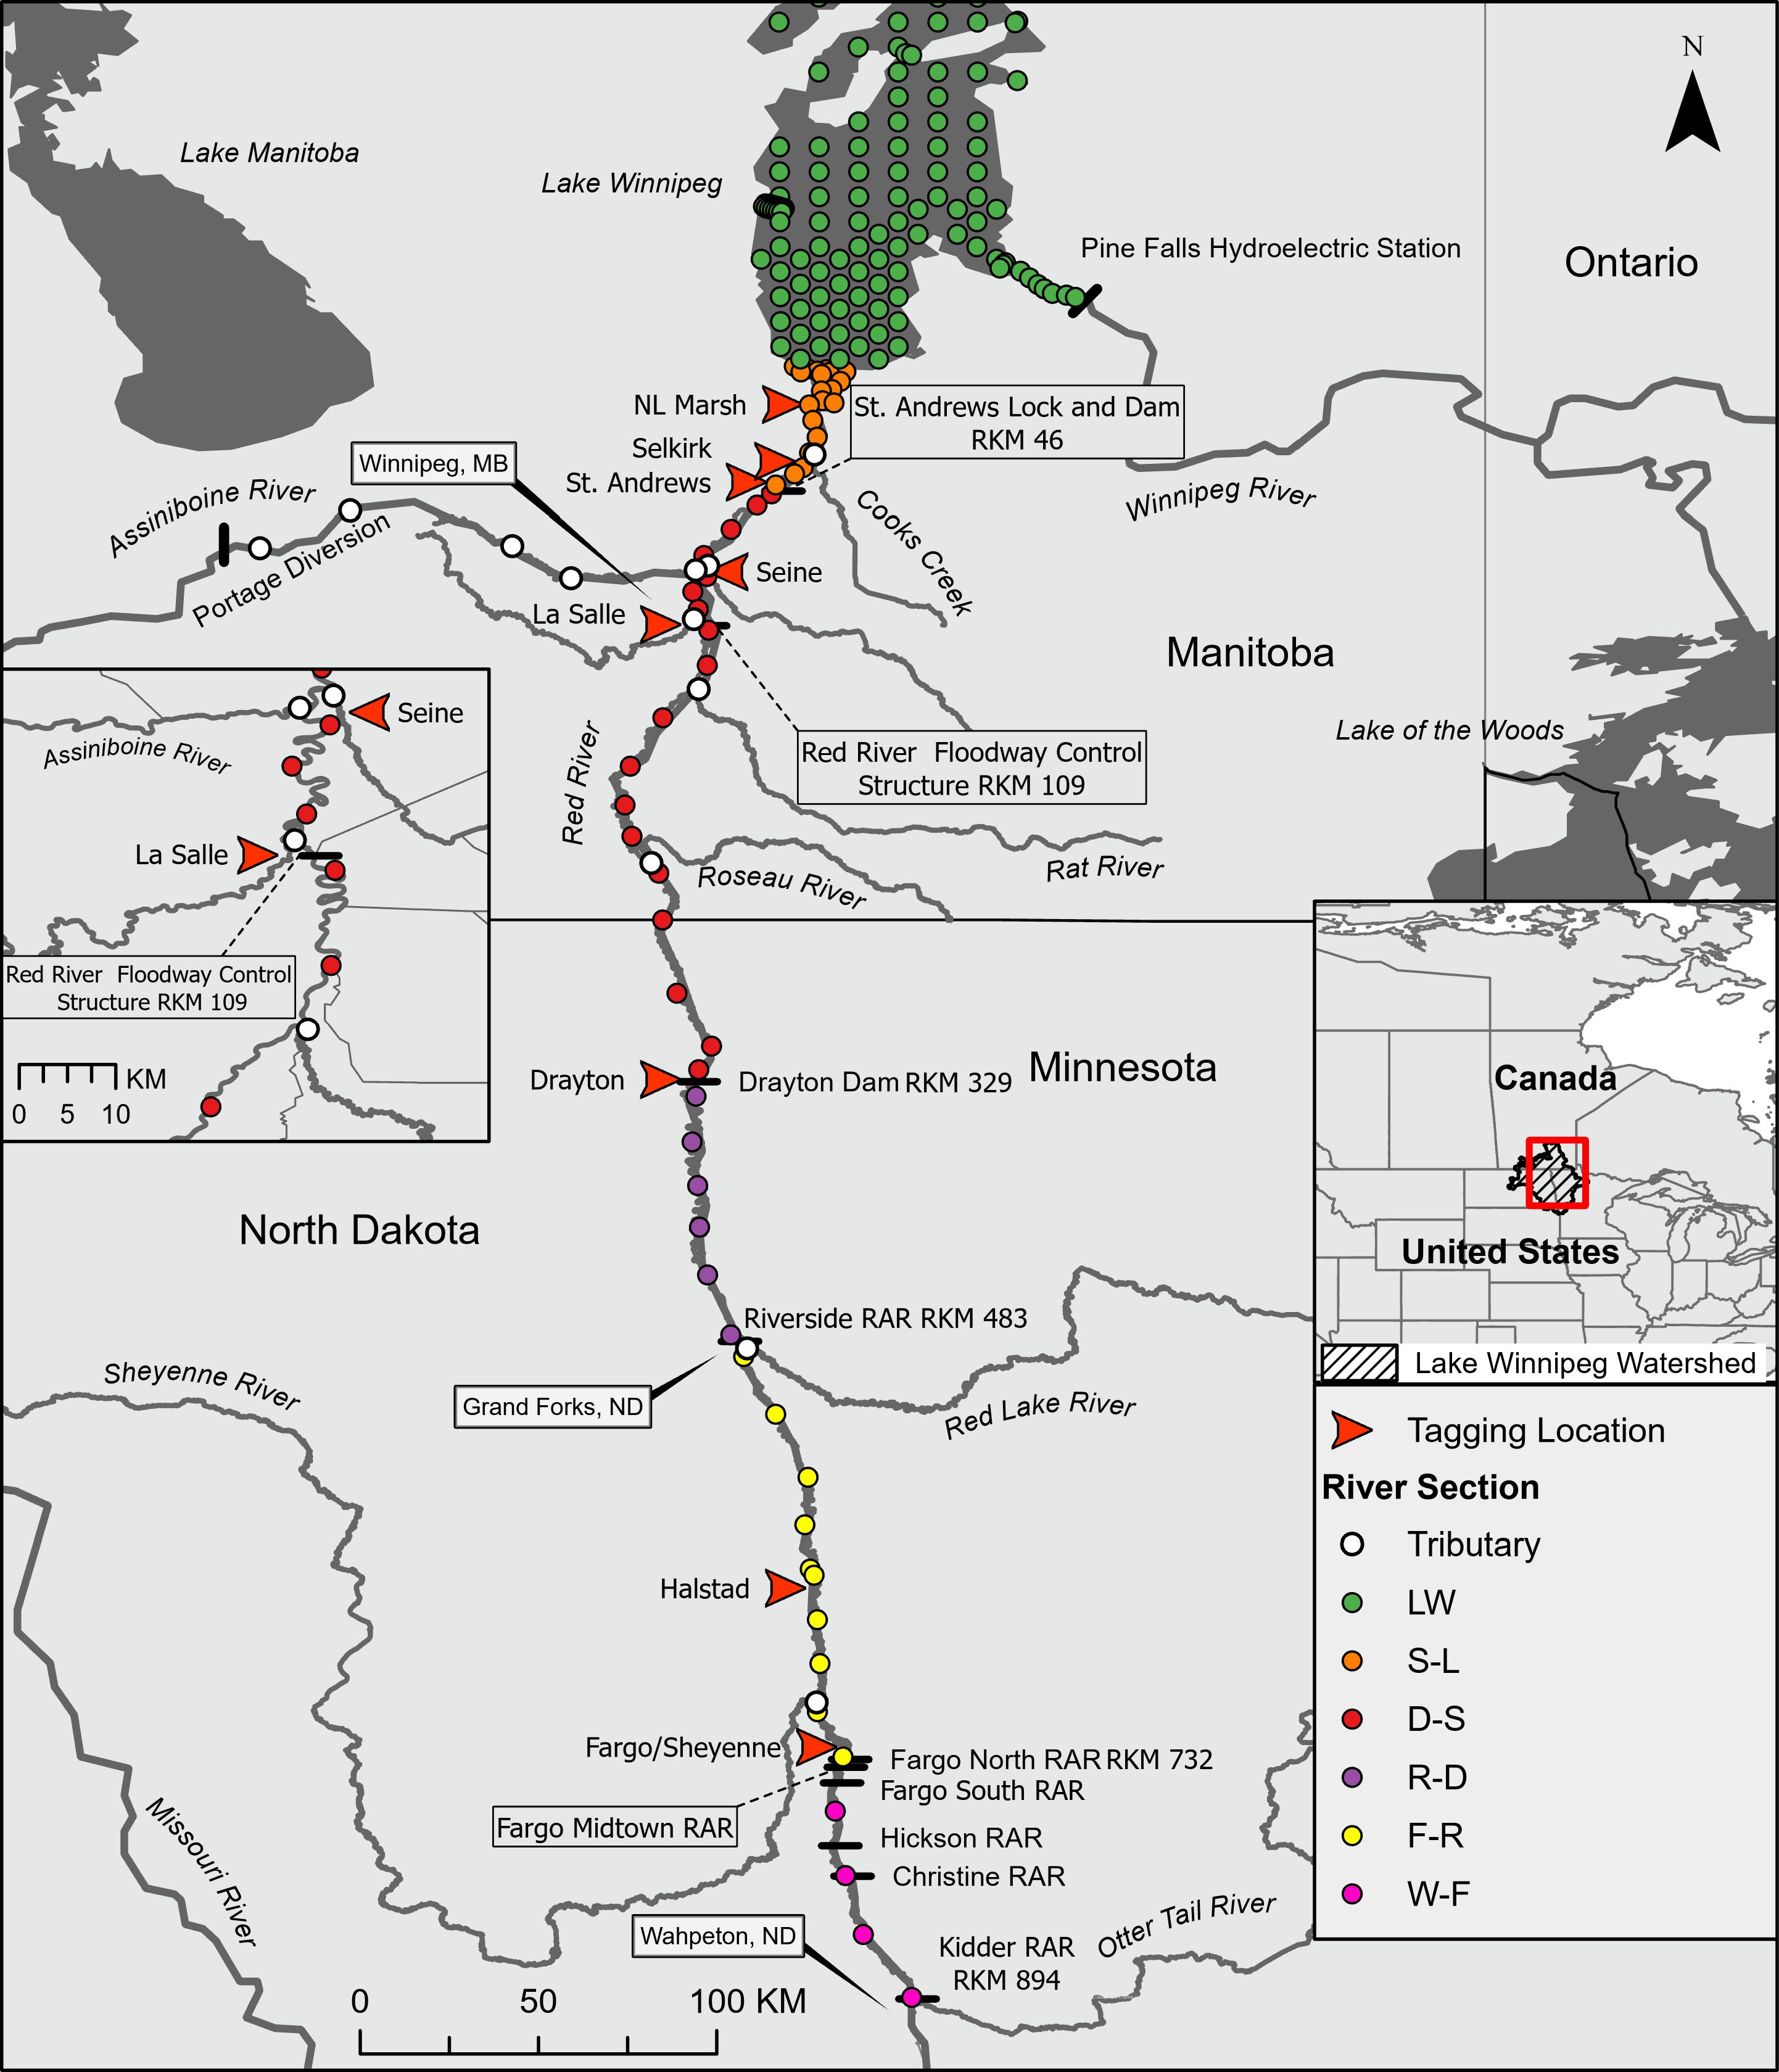
It is important to note that our interpretations of home range size, migration date, and rate of movement were limited by the study design. For example, error in these estimated metrics will vary from the southern to northern extent of the study system because receiver stations are separated by increasing distances (Fig. 1). Additionally, the use of minimum linear extent as a measure of home range includes extraneous movements that can result in larger estimates of home range compared to other analytical approaches (Vokoun 2003). Receiver detection efficiency at rkm 24 was > 80% up to 400 m in summer and winter, covering the full river width in most sections (Table S2). Nevertheless, large receiver spacing coupled with missed detections does impact how migration is observed. Other explanations for the drivers of migratory movements might emerge with the collection of additional data, such as bathymetry or through tagging more large individuals to detect and statistically control for body size effects among river sections.
Enders et al. (2019) found low transition probabilities from sections downstream to upstream of both SALD (0.005) and Drayton Dam (0.455). In the current study, we found that the reduced connectivity imposed by these dams influences seasonal home range overlap. Notably, the longest unimpeded section of river, between Drayton Dam and SALD, had the lowest probability of overlap (Table 3) and a pronounced separation of seasonal habitats. This supports the hypothesis that adequate geographic space can lead to seasonally distinct habitat use in a heterogeneous environment. On the contrary, the highest probability of overlap occurred in the section of river between SALD and Lake Winnipeg where space was relatively limited (Table 3). Although differential space use occurs in other riverine species (e.g., Blue Sucker, Lake Sturgeon (Acipenser fulvescens), and Flathead Catfish (Pylodictis olivaris), Vokoun and Rabeni 2005; Neely et al. 2009; Colborne et al. 2019), the competing influence of river fragmentation is less well understood. Fish that managed to pass upstream of the structure exhibited mixed behaviours including migration, apparent straying or section residency. Variation in behaviour should be expected (Kerr et al. 2010; Chizinski et al. 2016; van Leeuwen et al. 2016), particularly given that large Bigmouth Buffalo could achieve extraordinary ages and spawn periodically in the Red River (Lackmann et al. 2023). With nearly half of those crossing SALD undergoing migration, we believe there is strong evidence to suggest much of the Bigmouth Buffalo population downstream of SALD are unable to maximize fitness similar to conspecifics upstream. In small, fragmented river sections, such as downstream of SALD and upstream of the former Drayton Dam, fish have restricted access to habitats, including those which are most seasonally profitable (Enders et al. 2019). Rehabilitation of the Drayton and similar in-stream barriers should have positive consequences for potamodromous Bigmouth Buffalo.
Over half a decade of telemetry data has provided an unparalleled look into the migratory behaviour of Bigmouth Buffalo in a fragmented riverscape, emphasizing the critical role of river connectivity for accessing distinct summer and winter habitats. The study system was marked by notable migratory behaviours and distinct seasonal home ranges across different river sections, underscoring how anthropogenic developments such as dams can impact the distribution of migratory fish by limiting access to preferred habitats. Disruptions to habitat connectivity can restrict access to profitable habitat and impose individual fitness and population-level consequences that may take decades to manifest in long-lived species. Bigmouth Buffalo met our migration criteria only in the longest unimpeded river section, with movements generally directed downstream in spring and upstream in fall. Variability in migratory behaviour was linked to factors including flood duration and timing. The study also documented partial migration, a phenomenon critical for population stability and resilience under heterogeneous environmental conditions. These findings should be valuable to resource managers and policymakers concerned with habitat deficiencies and who plan strategic remediation in recovery actions for Bigmouth Buffalo and other migratory species.

Acknowledgements

We would like to thank the various field crews from Fisheries and Oceans Canada, the University of Manitoba, and the University of Nebraska for their efforts to construct the receiver network, download data, and tag Bigmouth Buffalo. Support for this project was provided by Fisheries and Oceans Canada’s Species at Risk and Fish Habitat Protection programs, the International Join Commission International Watersheds Initiative, the Manitoba Fish and Wildlife Enhancement Fund, Manitoba Fish Futures Inc., Manitoba Sustainable Development, the University of Nebraska-Lincoln via the Nebraska Agricultural Experiment Station and the Hatch Act (Project NC 1189) through the USDA National Institute of Food and Agriculture, and the Minnesota Department of Natural Resources.

References

Aadland L.P., Koel T.M., Franzin W.G., Stewart K.W., Nelson P. 2005. Changes in fish assemblage structure of the Red River of the North. American Fisheries Society Symposium, 45: 293–321.
Aadland L.P. 2010. Reconnecting rivers: natural channel design in dam removals and fish passage. St Paul, MN, USA.
Albers S. 2017. tidyhydat: extract and tidy Canadian Hydrometric Data. The Journal of Open Source Software, 2(20): 511.
Bachman R.A. 1984. Foraging behavior of free-ranging wild and hatchery Brown Trout in a stream. Transactions of the American Fisheries Society 113: 1–32.
Bates D., Maechler M., Bolker B., Walker S. 2015. Fitting linear mixed-effects models using lme4. Journal of Statistical Software. 67(1): 1–48.
Barbarossa V., Schmitt R.J.P., Huijbregts M.A.J., Zarfl C., King H., Schipper A.M. 2020. Impacts of current and future large dams on the geographic range connectivity of freshwater fish worldwide. Proc. Natl. Acad. Sci. U.S.A., 117: 3648–3655.
Bauer S., Lisovski S., Hahn S. 2016. Timing is crucial for consequences of migratory connectivity. Oikos, 125: 605–612.
Bell A.M., Hankison S.J., Laskowski K.L. 2009. The repeatability of behaviour: a meta-analysis. Animal Behaviour, 77(4): 771–783.
Biro P.A., Stamps J.A. 2015. Using repeatability to study physiological and behavioural traits: ignore time-related change at your peril. Animal Behaviour, 105: 223–230.
Bischof R., Loe L.E., Meisingset E.L., Zimmermann B., Van Moorter B., Mvsterud A. 2012. A migratory northern ungulate in the pursuit of spring: jumping or surfing the green wave? The American Naturalist, 180(4): 407–424.
Bloomfield E.J., Guzzo M.M., Middel T.A., Ridgway M.S., McMeans B.C. 2022. Seasonality can affect ecological interactions between fishes of different thermal guilds. Frontiers in Ecology and Evolution, 10: 986459.
Brooks G. 2003. Alluvial deposits of a mud-dominated stream: the Red River, Manitoba, Canada. Sedimentology, 50(3): 441–458.
Brooks G. 2017. Red River Valley, Manitoba: the geomorphology of a low-relief, flood-prone prairie landscape. In Landscapes and Landforms of Western Canada, Edited by O. Slaymaker, Springer, Cham (2017).
Chizinski C.J., Bajer P.G., Headrick M.E., Sorensen P.W. 2016. Different migratory strategies of invasive Common Carp and native Northern Pike in the American Midwest suggest an opportunity for selective management strategies. North American Journal of Fisheries Management, 36(4): 769–779.
Chapman B.B., Hulthén K., Brodersen J., Nilsson P.A., Skov C., Hansson L.A., Brönmark C. 2012. Partial migration in fishes: causes and consequences. Journal of Fish Biology, 81(2): 456–478.
Cohen E.B., Hostetler J.A., Hallworth M.T., Rushing C.S., Sillett T.S., Marra P.P. 2018. Quantifying the strength of migratory connectivity. Methods in Ecology and Evolution, 9: 513–524.
Colborne S.F., Hondorp D.W., Holbrook C.M., Lowe M.R., Boase J.C., Chiotti J.A., et al. 2019. Sequence analysis and acoustic tracking of individual lake sturgeon identify multiple patterns of river–lake habitat use. Ecosphere, 10(12): e02983.
Corriveau J., Chambers P.A., Yates A.G., Culp J.M. 2011. Snowmelt and its role in the hydrologic and nutrient budgets of prairie streams. Water Science and Technology 64(8): 1590–1596.
COSEWIC. 2009. COSEWIC assessment and update status report on the Bigmouth Buffalo Ictiobus cyprinellus, Great Lakes—Upper St. Lawrence populations and Saskatchewan—Nelson River populations, in Canada. Ottawa, Canada.
Crossin G.T., Heupel M.R., Holbrook C.M., Hussey N.E., Lowerre-Barbieri S.K., Nguyen V.M., et al. 2017. Acoustic telemetry and fisheries management. Ecological Applications, 27: 1031–1049.
De Cicco L.A., Hirsch R.M., Lorenz D., Watkins W.D., Johnson M. 2022. dataRetrieval: R packages for discovering and retrieving water data available from Federal hydrologic web services. v.2.7.12.
Dingle H., Drake V.A. 2007. What is migration? Bioscience, 57: 113–121.
Environment and Climate Change Canada (ECCC) Manitoba Agriculture and Resource Development. 2020. State of Lake Winnipeg- 2nd Edition.
Environment and Climate Change Canada (ECCC). 2023. Extracted from the environment and climate change Canada Historical Hydrometric Data website  (https://wateroffice.ec.gc.ca/mainmenu/historical_data_index_e.html) on Dec. 21, 2023.
Enders E.C., Charles C., Watkinson D.A., Kovachik C., Leroux D.R., Hansen H., Pegg M.A. 2019. Analysing habitat connectivity and home ranges of Bigmouth Buffalo and Channel Catfish using a large-scale acoustic receiver network. Sustainability, 11(11): 3051.
Fisheries and Oceans Canada. 2020. Management plan for the Bigmouth Buffalo (Ictiobus cyprinellus) in Canada (Saskatchewan-Nelson River populations). Species at risk act management plan series. Fisheries and oceans Canada, Ottawa. iv + 24pp. Bigmouth Buffalo (Ictiobus cyprinellus): management plan, 2021 - Canada.ca.
Flávio H., Baktoft H. 2020. actel: Standardised analysis of acoustic telemetry data from animals moving through receiver arrays. Methods in Ecology and Evolution, 12(1): 196–203.
Franklin P.A., Basic T., Davison P.I., Dunkley K., Ellis J., Gangal M., et al. 2024. Aquatic connectivity: challenges and solutions in a changing climate. Journal of Fish Biology, 1–20.
Fretwell S.D. 1972. Populations in a seasonal environment. Princeton University Press, Princeton. 224 p.
Fretwell S.D., Lucas H.L.J. 1970. On territorial behaviour and other factors influencing habitat distribution in birds. I. Theoretical development. Acta Biotheoretica, 19: 16–36.
Goodchild C. 1989. COSEWIC status report on the Bigmouth Buffalo Ictiobus cyprinellus in Canada. Ottawa, Canada.
Gallagher C.P., Howland K.L., Sandstrom S.J., Halden N.M. 2018. Migration tactics affect spawning frequency in an iteroparous salmonid (Salvelinus malma) from the Arctic. PLoS ONE, 13(12): e0210202.
Gräler B., Pebesma E., Heuvelink G. 2016. Spatio-temporal interpolation using gstat. The R Journal 8(1): 204–218.
Grill G., Lehner B., Thieme M., Geenen B., Tickner D., Antonelli F., et al. 2019. Mapping the world's free-flowing rivers. Nature, 569: 215–221.
Hammer L.J, Hussey N.E., Marcoux M., Pettitt-Wade H., Hedges K., Tallman R., Furey N.B. 2022. Arctic char enter the marine environment before annual ice breakup in the high Arctic. Environmental Biology of Fishes, 105(12): 2017–2025.
Hrycik A.R., McFarland S., Morales-Williams A., Stockwell J.D. 2012. Winter severity shapes spring plankton succession in a small, eutrophic lake. Hydrobiologia, 849: 2127–2144.
Howard C., Mason T.H., Baillie S.R., Border J., Hewson C.M., Houston A.I., et al. 2023. Explaining and predicting animal migration under global change. Diversity and Distributions, 30.
Hulthén K., Chapman B.B., Nillson P.A., Hansson L-A., Skov C., Brodersen J., Brönmark C. 2022. Timing and synchrony of migration in a freshwater fish: Consequences for survival. Journal of Animal Ecology, 91: 2103–2112.
Jørgensen C., Ernande B., Fiksen Ø., Dieckmann U. 2006. The logic of skipped spawning in fish. Canadian Journal of Fisheries and Aquatic Sciences, 63(1): 200–211.
Keeley A.T., Beier P., Jenness J.S. 2021. Connectivity metrics for conservation planning and monitoring. Biological Conservation, 255: 109008.
Kerr L.A., Cadrin S.X., Secor D.H. 2010. The role of spatial dynamics in the stability, resilience, and productivity of an estuarine fish population. Ecological Applications, 20(2): 497–507.
Killick R., Eckley I.A. 2014. changepoint: an R package for changepoint analysis. Journal of Statistical Software, 58(3): 1–19. https://www.jstatsoft.org/article/view/v058i03.
Killick R., Haynes K., Eckley I.A. 2022. changepoint: an R package for changepoint analysis. R package version 2.2.4. https://CRAN.R-project.org/package=changepoint.
Killick R., Fearnhead P., Eckley I.A. 2012. Optimal detection of changepoints with a linear computational cost. Journal of the American Statistical Association, 107(500): 1590–1598.
Kubelka V., Sandercock B. K., Székely T., Freckleton R. P. 2022. Animal migration to northern latitudes: environmental changes and increasing threats. Trends in ecology & evolution, 37(1):30–41.
Kürten N., Schmaljohann H., Bichet C., Haest B., Vedder O., González-Solís J., Bouwhuis S. 2022. High individual repeatability of the migratory behaviour of a long-distance migratory seabird. Movement Ecology, 10(1): 5.
Lackmann A.R., Andrews A.H., Butler M.G., Bielak-Lackmann E.S., Clark M.E. 2019. Bigmouth Buffalo Ictiobus cyprinellus sets freshwater teleost record as improved age analysis reveals centenarian longevity. Communications Biology. 2019 21 2, 1–14.
Lackmann A.R., Kratz B.J., Bielak-Lackmann E.S., Jacobson R.I., Sauer D.J., Andrews A.H., et al. 2021. Long-lived population demographics in a declining, vulnerable fishery—bigmouth buffalo (Ictiobus cyprinellus) of Jamestown Reservoir, North Dakota. Canadian Journal of Fisheries and Aquatic Sciences, 78(10): 1486–1496.
Lackmann A.R., Sereda J., Pollock M., Bryshun R., Chupik M., McCallum K., et al. 2023. Bet-hedging Bigmouth Buffalo (Ictiobus cyprinellus) recruit episodically over a 127-year timeframe in Saskatchewan. Canadian Journal of Fisheries and Aquatic Sciences, 80: 313–329.
Lima S.L. 1998. Stress and decision making under the risk of predation: recent developments from behavioral, reproductive, and ecological perspectives. Advances in the Study of Behaviour, 27: 215–290.
Lowerre-Barbieri S.K., Brown-Peterson N.J., Murua H., Tomkiewicz J., Wyanski D.M., Saborido-Rey F. 2011. Emerging issues and methodological advances in fisheries reproductive biology. Marine and Coastal Fisheries, 3(1): 32–51.
Marantz S.A., Long J.A., Webb S.L., Gee K.L., Little A.R., Demarais S. 2016. Impacts of human hunting on spatial behavior of white-tailed deer (Odocoileus virginianus). Canadian Journal of Zoology, 94(12): 853–861.
Marra P.P., Cohen E., Harrison A.L., Studds C.E., Webster M. 2019. Migratory connectivity. Encyclopedia of Animal Behavior, 643–654.
Mcloughlin P.D., Ferguson S.H. 2000. A hierarchical pattern of limiting factors helps explain variation in home range size. Écoscience, 7(2): 123–130.
McMeans B.C., McCann K.S., Guzzo M.M., Bartley T.J., Bieg C., Blanchfield P.J., et al. 2020. Winter in water: differential responses and the maintenance of biodiversity. Ecology Letters 23: 922–938.
Nakagawa S., Schielzeth H. 2010. Repeatability for Gaussian and non-Gaussian data: a practical guide for biologists. Biological Reviews, 85(4): 935–956.
Neely B.C., Pegg M.A, Mestle G.E. 2009. Seasonal use distributions and migrations of blue sucker in the Middle Missouri River. Ecology of Freshwater Fish, 18(3): 437–444.
Newson S.E., Mendes S., Crick H.Q., Dulvy N.K., Houghton J.D., Hays G.C., et al. 2009. Indicators of the impact of climate change on migratory species. Endangered Species Research, 7(2): 101–113.
Nuñez T.A., Lawler J.J., McRae B.H., Pierce D.J., Krosby M.B., Kavanagh D.M., et al. 2013. Connectivity planning to address climate change. Conservation Biology, 27(2): 407–416.
Pebesma E.J. 2004. Multivariable geostatistics in S: the gstat package. Computers & Geosciences, 30: 683–691.
Pincock D., Welch D., McKinley S., Jackson G. 2010. Acoustic telemetry for studying migration movements of small fish in rivers and the ocean—current capabilities and future possibilities. In PNAMP special publication: tagging, telemetry and marking measures for monitoring fish populations–a compendium of new and recent science for use in informing technique and decision modalities. Edited by K. Wolf, J. O'Neal, Pacific Northwest Aquatic Monitoring Partnership—Special Publication. pp. 105–117.
R Core Team. 2023. R: a language and environment for statistical computing. R Foundation for Statistical Computing, Vienna, Austria. https://www.R-project.org/.
Rahel F.J., McLaughlin R.L. 2018. Selective fragmentation and the management of fish movement across anthropogenic barriers. Ecological Applications, 28(8): 2066–2081.
Rideout R.M., Tomkiewicz J. 2011. Skipped spawning in fishes: more common than you might think. Marine and Coastal Fisheries, 3(1): 176–189.
Robinson R.A., Crick H.Q., Learmonth J.A., Maclean I.M., Thomas C.D., Bairlein F., et al. 2009. Travelling through a warming world: climate change and migratory species. Endangered Species Research, 7(2): 87–99.
Semlitsch R.D. 2010. Differentiating migration and dispersal processes for pond-breeding amphibians. The Journal of Wildlife Management, 72(1): 260–267.
Stewart K., Watkinson D. 2004. Freshwater fishes of Manitoba. University of Manitoba Press.
Stoffel M.A., Nakagawa S., Schielzeth H. 2017. rptR: repeatability estimation and variance decomposition by generalized linear mixed-effects models. Methods in Ecology and Evolution, 8(11): 1639–1644.
Topp D., Drewes H., Henry M., Huberty G., Jacobson P. 1994. Assessment of the Red River fishery, with special emphasis on Channel Catfish. Minnesota Department of Natural Resources Study IV, Job 242. Bemidji, Minnesota.
Tyers M. 2022. riverdist: river network distance computation and applications. R package version 0.15.5.
van Leeuwen C.H., Museth J., Sandlund O.T., Qvenild T., Vøllestad L.A. 2016. Mismatch between fishway operation and timing of fish movements: a risk for cascading effects in partial migration systems. Ecology and Evolution, 6(8): 2414–2425.
Vandergoot C.S., Murchie K.J., Cooke S.J., Dettmers J.M., Bergstedt R.A., Fielder D.G. 2011. Evaluation of two forms of electroanesthesia and carbon dioxide for short-term anesthesia in Walleye. North American Journal of Fisheries Management, 31(5): 914–922.
Van der Graaf A.J., Stahl J., Klimkowska A., Bakker J.P., Drent R.H. 2006. Surfing on a green wave-how plant growth drives spring migration in the Barnacle Goose Branta leucopsis. Ardea, 94(3): 567–577.
Vokoun J.C. 2003. Kernel density estimates of linear home ranges for stream fishes: advantages and data requirements. North American Journal of Fisheries Management, 23(3): 1020–1029.
Vokoun J.C., Rabeni C.F. 2005. Home range and space use patterns of Flathead Catfish during the summer-fall period in two Missouri streams. American Fisheries Society, 134(2): 209–517.
Willis J.M. 1994. Preliminary data collection at the St. Andrews Lock and Dam Fishway. Fish Futures Inc. Technical Report 94–4. December 1994.
Winemiller K, Rose K.A. 1992. Patterns of life-history diversification in North American fishes: implications for population regulation. Canadian Journal of Fisheries and Aquatic Sciences, 49(10): 2196–2218.
Woolnough D.A, Downing J.A., Newton T.A. 2009. Fish movement and habitat use depends on water body size and shape.Ecology of Freshwater Fish, 18: 83–91.
Zuur A.F., Ieno E.N., Elphick C.S. 2010. A protocol for data exploration to avoid common statistical problems. Methods in Ecology and Evolution, 1(1): 3–14.

Supplementary material

Supplementary Material 1 (DOCX / 25.1 KB).

Information & Authors

Information

Published In

cover image FACETS
FACETS
Volume 9Number 1January 2024
Pages: 1 - 17
Editor: Marco Rodriguez

History

Received: 9 January 2024
Accepted: 27 May 2024
Version of record online: 9 October 2024

Notes

This paper is part of a collection entitled Progress and Priorities for the Recovery of Aquatic Species at Risk in Canada.

Data Availability Statement

Data analyzed during this study are considered sensitive due to the species’ conservation status. At present, raw data will not be released without written consent from the Species at Risk Program of Fisheries and Oceans Canada.

Key Words

  1. fish telemetry
  2. connectivity
  3. migration
  4. fish passage
  5. movement ecology
  6. dams

Sections

Subjects

Plain Language Summary

Migratory behaviour of Bigmouth Buffalo (Ictiobus cyprinellus) in a fragmented riverscape

Authors

Affiliations

Fisheries and Oceans Canada, Freshwater Institute, Winnipeg, MB, Canada
Author Contributions: Conceptualization, Data curation, Funding acquisition, Investigation, Project administration, Supervision, Writing – original draft, and Writing – review & editing.
Marshall Stuart
University of Nebraska–Lincoln, School of Natural Resources, Lincoln, NE, USA
Author Contributions: Conceptualization, Data curation, Formal analysis, Methodology, Visualization, Writing – original draft, and Writing – review & editing.
Fisheries and Oceans Canada, Freshwater Institute, Winnipeg, MB, Canada
Author Contributions: Conceptualization, Data curation, Formal analysis, Investigation, Visualization, Writing – original draft, and Writing – review & editing.
Fisheries and Oceans Canada, Freshwater Institute, Winnipeg, MB, Canada
Author Contributions: Conceptualization, Visualization, Writing – original draft, and Writing – review & editing.
Doug A. Watkinson
Fisheries and Oceans Canada, Freshwater Institute, Winnipeg, MB, Canada
Author Contributions: Data curation, Investigation, Methodology, Writing – original draft, and Writing – review & editing.
Colin Kovachik
Fisheries and Oceans Canada, Freshwater Institute, Winnipeg, MB, Canada
Author Contributions: Investigation and Methodology.
Douglas R. Leroux
Fisheries and Oceans Canada, Freshwater Institute, Winnipeg, MB, Canada
Author Contributions: Investigation and Methodology.
Nicholas B. Kludt
Minnesota Department of Natural Resources, Detroit Lakes, MN, USA
Author Contribution: Writing – review & editing.
University of Nebraska–Lincoln, School of Natural Resources, Lincoln, NE, USA
Author Contributions: Funding acquisition, Investigation, Methodology, Supervision, and Writing – review & editing.
Institut National de la Recherche Scientifique, Centre Eau Terre Environnement, Quebec City, QC, Canada
Author Contribution: Writing – review & editing.

Notes

Eva C. Enders served as Subject Editor at the time of manuscript review and acceptance and did not handle peer review and editorial decisions regarding this manuscript.

Author Contributions

Conceptualization: LFGG, MS, ALC, LJ
Data curation: LFGG, MS, ALC, DAW
Formal analysis: MS, ALC
Funding acquisition: LFGG, MAP
Investigation: LFGG, ALC, DAW, CK, DRL, MAP
Methodology: MS, DAW, CK, DRL, MAP
Project administration: LFGG
Supervision: LFGG, MAP
Visualization: MS, ALC, LJ
Writing – original draft: LFGG, MS, ALC, LJ, DAW
Writing – review & editing: LFGG, MS, ALC, LJ, DAW, NBK, MAP, ECE

Competing Interests

The authors declare there are no competing interests.

Metrics & Citations

Metrics

Other Metrics

Citations

Cite As

Export Citations

If you have the appropriate software installed, you can download article citation data to the citation manager of your choice. Simply select your manager software from the list below and click Download.

There are no citations for this item

View Options

View options

PDF

View PDF

Get Access

Media

Media

Other

Tables

Share Options

Share

Share the article link

Share on social media