Marine ecozones represent a major gap in Canadian DNA barcoding efforts
Abstract
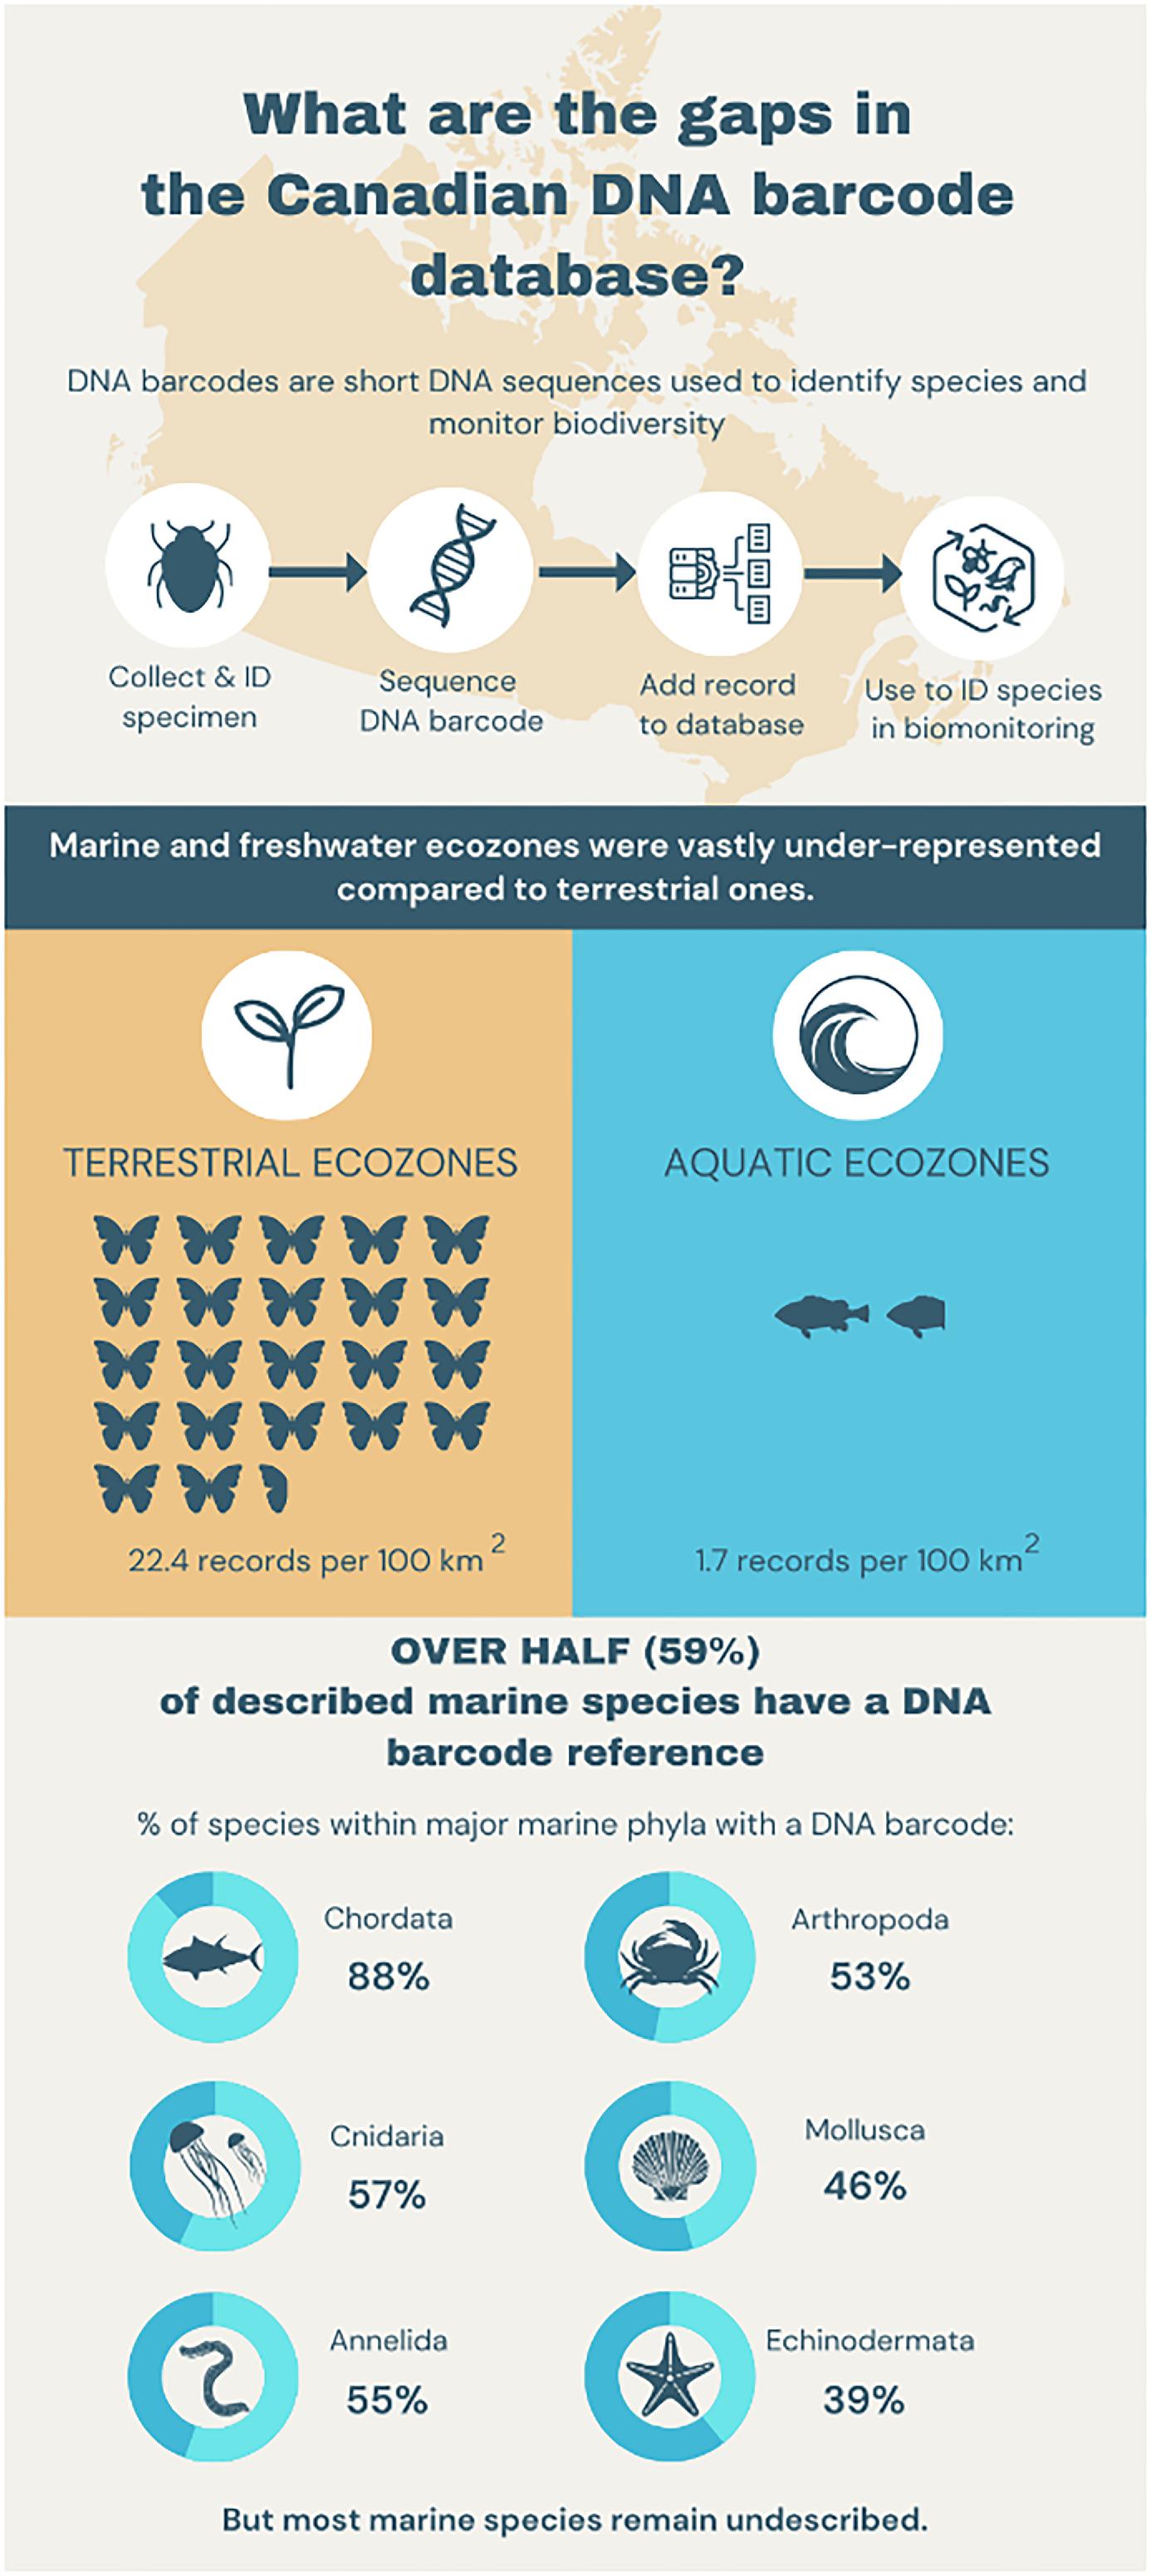
Because of Canada’s large size, it is impractical to obtain a comprehensive perspective on biotic change through morphological approaches. DNA metabarcoding offers a potential path, but its application requires access to a well-parameterized DNA barcode reference library. This study presents the current state of DNA barcode coverage for Canadian animals, highlighting progress, identifying gaps, and providing recommendations for future research. Our analysis indicates that many of the known species (100 000 terrestrial and 6000 marine) in the Canadian fauna possess DNA barcode coverage, but there are important gaps geographically and taxonomically. We summarize DNA barcode coverage for the species in freshwater, marine, and terrestrial environments by ecoregion, finding that 95.6% of the 2.3 million Canadian barcode records derive from terrestrial ecosystems. Although the density of barcode records per 100 km² is 13x higher for terrestrial than aquatic environments (22.4 vs. 1.7), coverage for 58% of marine species is available (54% for annelids, 52% for arthropods, 88% for chordates, 39% for echinoderms, and 46% for molluscs). By revealing data-deficient areas and taxonomic groups, this study offers a roadmap for expanding the DNA barcode library for the Canadian fauna as an essential foundation for the scalable biosurveillance initiatives that inform biodiversity conservation efforts.
Graphical Abstract
Introduction
To protect species and the ecosystem services which they provide, comprehensive monitoring is critical to understand the trends, risks, and drivers of biodiversity loss (Pimm et al. 2014; Hochkirch et al. 2021). However, biodiversity monitoring in Canada is challenging because of its status as the world’s second-largest nation and the difficulty in accessing remote areas (Archambault et al. 2010). This is particularly true for marine habitats because sampling requires expensive ship support (Archambault et al. 2010). With the world’s longest coastline bordering three oceans and an estimated 71%–91% of marine taxa undescribed (Costello et al. 2010; Mora et al. 2011; Appeltans et al. 2012; Luypaert et al. 2020; Bouchet et al. 2023; Rogers et al. 2023), there are substantial gaps in knowledge of the Canadian marine fauna.
By differentiating species based on standardized DNA regions (Hebert et al. 2003; Hebert et al. 2003), DNA barcoding makes it possible to map species distributions at scale. It not only enables estimates of species diversity, but also aids the recognition of unknown species and tracking biodiversity changes over time (Deiner et al. 2017). DNA barcoding also makes it possible to monitor diversity in lineages whose taxonomy is weakly developed, providing the spatially explicit and taxonomically comprehensive data needed to evaluate changes in species distributions in response to environmental change (Archambault et al. 2010; Hochkirch et al. 2021; Borgelt et al. 2022). Building on the capabilities provided by the Barcode of Life Data System (BOLD) (Ratnasingham and Hebert 2007, 2013), Canada has been the global leader in this approach, significantly advancing the understanding and conservation of its biodiversity. However, gaps in the sequence database hinder scalable, high-resolution biosurveillance (Leray and Knowlton 2016; Sinniger et al. 2016; Weigand et al. 2019).
DNA barcode records include a voucher specimen, its taxonomic assignment, details on its point and time of collection, and a barcode sequence (Ratnasingham and Hebert 2013). Once a species enters BOLD, members of the same taxon can be rapidly identified from their DNA barcode whether derived from a single specimen, from bulk samples (DNA metabarcoding), or from environmental samples (eDNA) such as water, air, soil, or sediment (Ruppert et al. 2019). However, when analysis of metabarcoding or eDNA samples reveals sequences unrepresented in the reference library, the inferred taxonomic composition is incomplete or inaccurate (Beng and Corlett 2020). While taxonomy-free approaches for assessing biodiversity from molecular analysis escape this problem (Apothéloz-Perret-Gentil et al. 2017; Callahan et al. 2017; Mächler et al. 2021), they fail to connect sequences with the biological attributes of the species that served as their source. As a consequence, species identifications remain essential for understanding ecology, functional roles, population genetics, and tracking invasive or endangered species.
A key step in directing future work in library construction involves summarizing progress in securing DNA barcode coverage from a biogeographic perspective. Ecological land classifications delineate geographic regions (e.g., provinces, ecoregions, and ecozones) based on geological, climatic, and biotic differences (Omernik 1995). As such, these units provide a framework for understanding spatial complexity, conducting biological risk assessments, and directing conservation action (Omernik 1995; Smith et al. 2020; Spalding et al. 2007).
In this study, we evaluate DNA barcode coverage for each of Canada’s 28 ecozones to identify variation in coverage among them and to highlight taxonomic groups lacking data. Summarizing the number of barcode records by ecozone allowed a comparison of terrestrial and aquatic habitats. Additionally, we investigated barcode coverage for Canadian marine invertebrates across taxonomic groups to highlight gaps and aid prioritization of future efforts.
Materials and methods
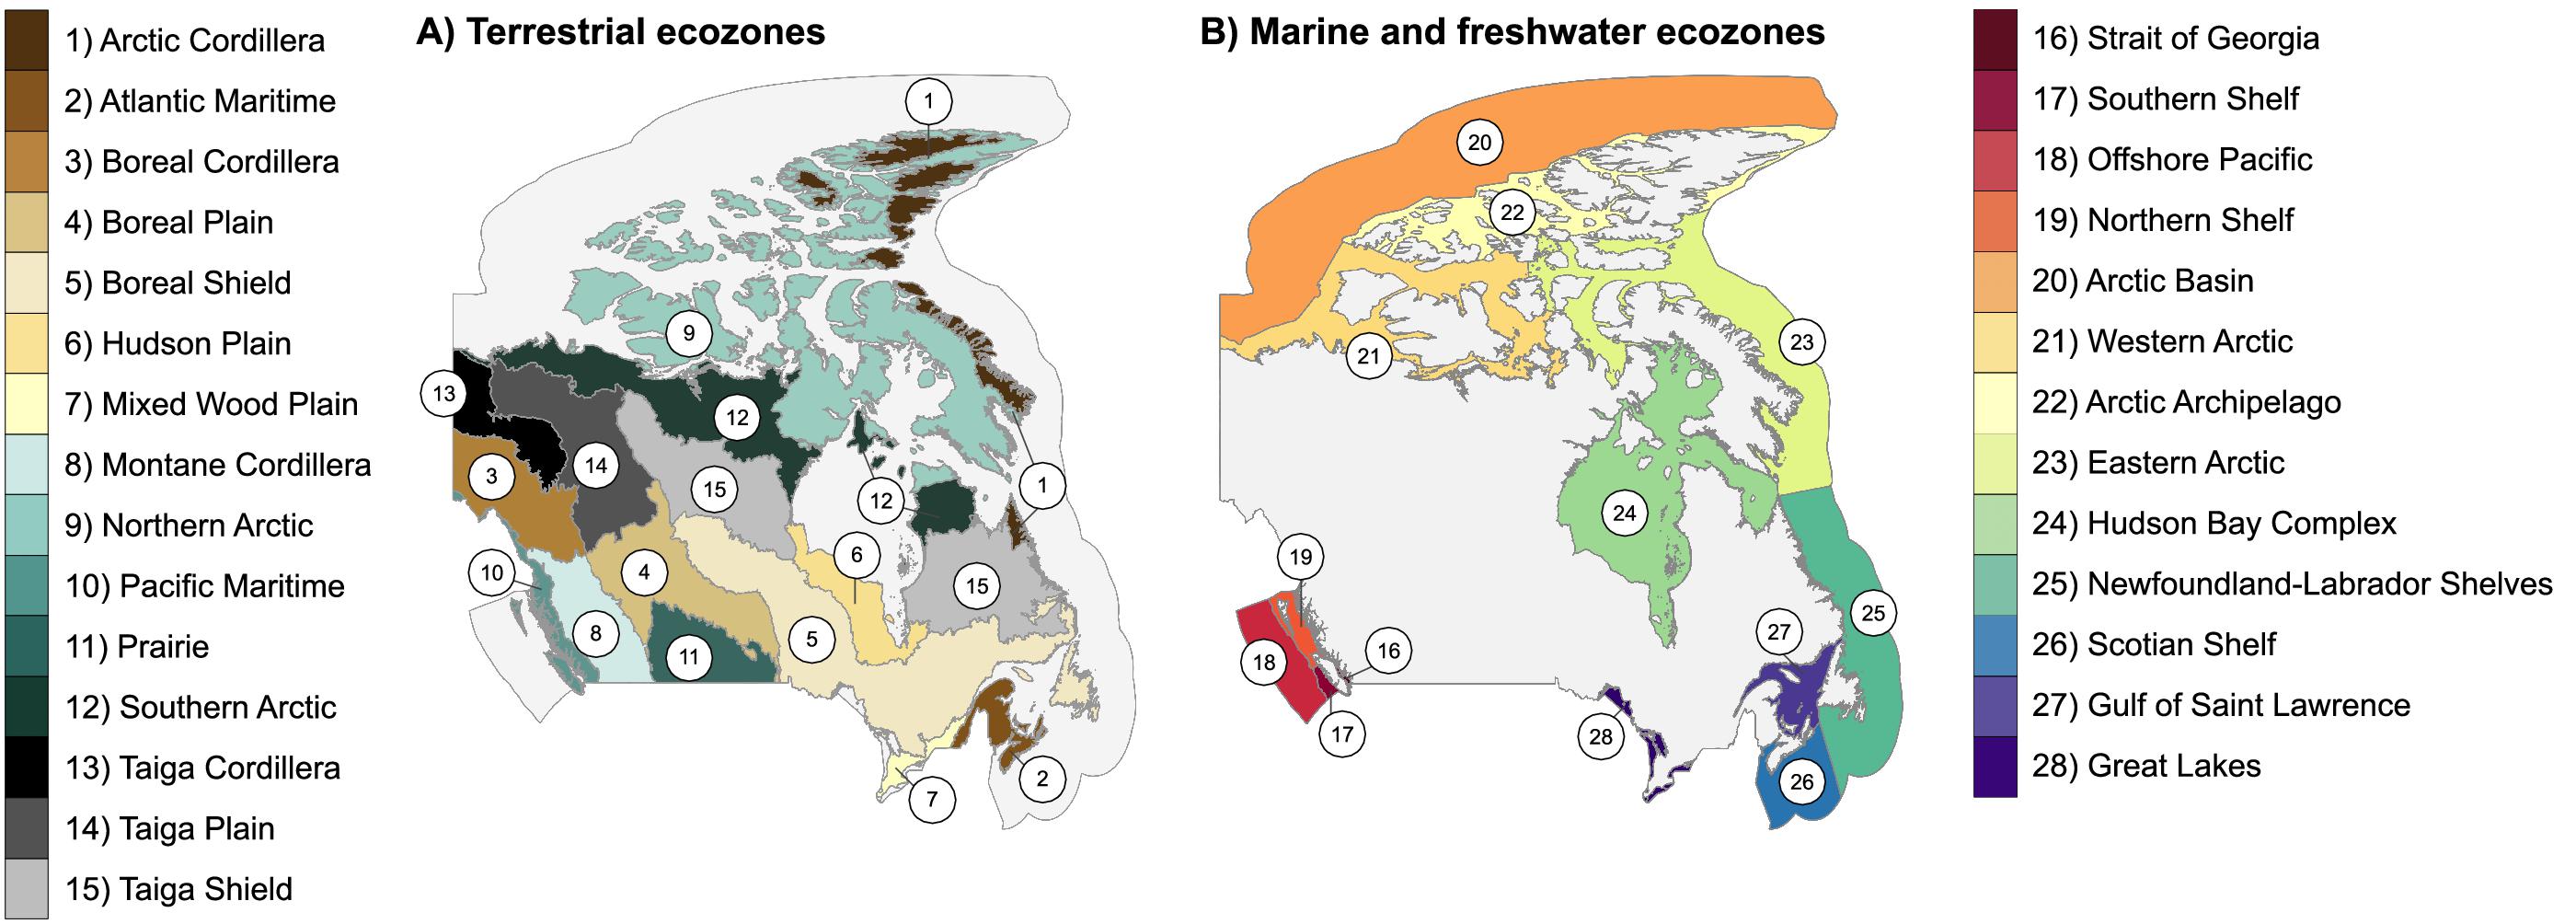
To assess DNA barcode coverage for the Canadian fauna, we downloaded all public Canadian records from BOLD (Ratnasingham and Hebert 2007, 2013; accessed 6 June 2022). Each record with GPS coordinates was assigned to one of Canada’s 28 ecozones (15 terrestrial, 12 marine, and 1 freshwater) (Fig. 1). Canada’s National Ecological Framework (Ecological Stratification Working Group 1995; Marshall et al. 1996; Hirvonen 2001) was used to define ecozone boundaries (Fig. 1). Shapefiles were downloaded from the National Ecological Framework website (Government of Canada 2017; accessed 8 October 2022) for terrestrial ecozones, and from the Canadian Council on Ecological Areas website (CCEA 2015; accessed 8 October 2022) for aquatic ecozones. Both sets of ecozones have 1 m resolution. We compared the total number of records, records per ecozone, and records per 100 km2 for terrestrial and aquatic ecozones. In addition, we plotted the accumulation of unique BINs and species as a function of the number of barcode records for terrestrial and aquatic organisms. To do this, we randomized the list of records and sampled without replacement, counting the number of unique BINs or species accumulated until the records were exhausted. This process was repeated 100 times, and values at each sample size were averaged to produce a smooth line.
Fig. 1.
For marine animals, we also summarized barcode progress by taxonomic group. We downloaded publicly available BOLD records (accessed 20 August 2022) whose identification matched marine species or genera in the Canadian Register of Marine Species (CaRMS) (CaRMS 2022, accessed 8 October 2022). Records using synonymized or otherwise invalid names were relabelled with the accepted name. BOLD assigns a Barcode Index Number (BIN; a species proxy) to each sequence record that meets specified quality requirements (>500 bp in length, <1% ambiguous bases, no frameshifts, contaminants, or chimeras) and possesses complete metadata (sample ID, field or museum voucher ID, phylum, country, and institution storing the specimen) (Ratnasingham and Hebert 2013). For each animal phylum, we summarized the number of accepted Canadian species, the number of accepted species with at least one record on BOLD, the number of accepted species with at least one BIN, the total number of records, and the total number of unique BINs. We calculated coverage as the percentage of described species with at least one BIN. We also summarized coverage and average BINs per species by family (see Supp. Data Table S1).
Results
In total, 2.3 million Canadian animal specimens have been barcoded, providing coverage for 85 706 BINs and 37 327 named species. Most of these records (94.7%) include GPS coordinates for the collection location, enabling their assignment to an ecozone. Of these, 98.5% of records were arthropods. The total area of Canada’s terrestrial ecozones is about 50% greater than its aquatic ecozones, but the difference in barcode records was far greater as 95.6% (2213 305) derived from land, while just 4.4% (100 894 records) were from water (Tables 1 and 2). Coverage among ecozones showed >1000-fold variation (Fig. 2). Terrestrial ecozones showed a 100-fold range from 6023 records (Taiga Shield;Fig. 2A, #15; Table 1) to 667 342 (Mixedwood Plains; Fig. 2A, #7; Table 1). Marine ecozones showed nearly a 1000-fold range from 29 (Arctic Archipelago; Fig. 2B, #22) to 22 062 (Gulf of Saint Lawrence; Fig. 2B, #27). The number of records on an areal basis averaged 22.4 records per 100 km2 for land (Table 1) versus 1.7 records per 100 km2 for water (Table 2), but records were not evenly distributed within ecozones (Fig. 3). Specimens collected within terrestrial ecozones included representatives for 78 139 BINs and 23 775 named species, while the specimens collected within aquatic ecozones included 12 535 BINs and 6 117 species (Fig. 4). The ratio of BINs to species was 3.29 for terrestrial records and 2.04 for aquatic records (Fig. 4).
Fig. 2.
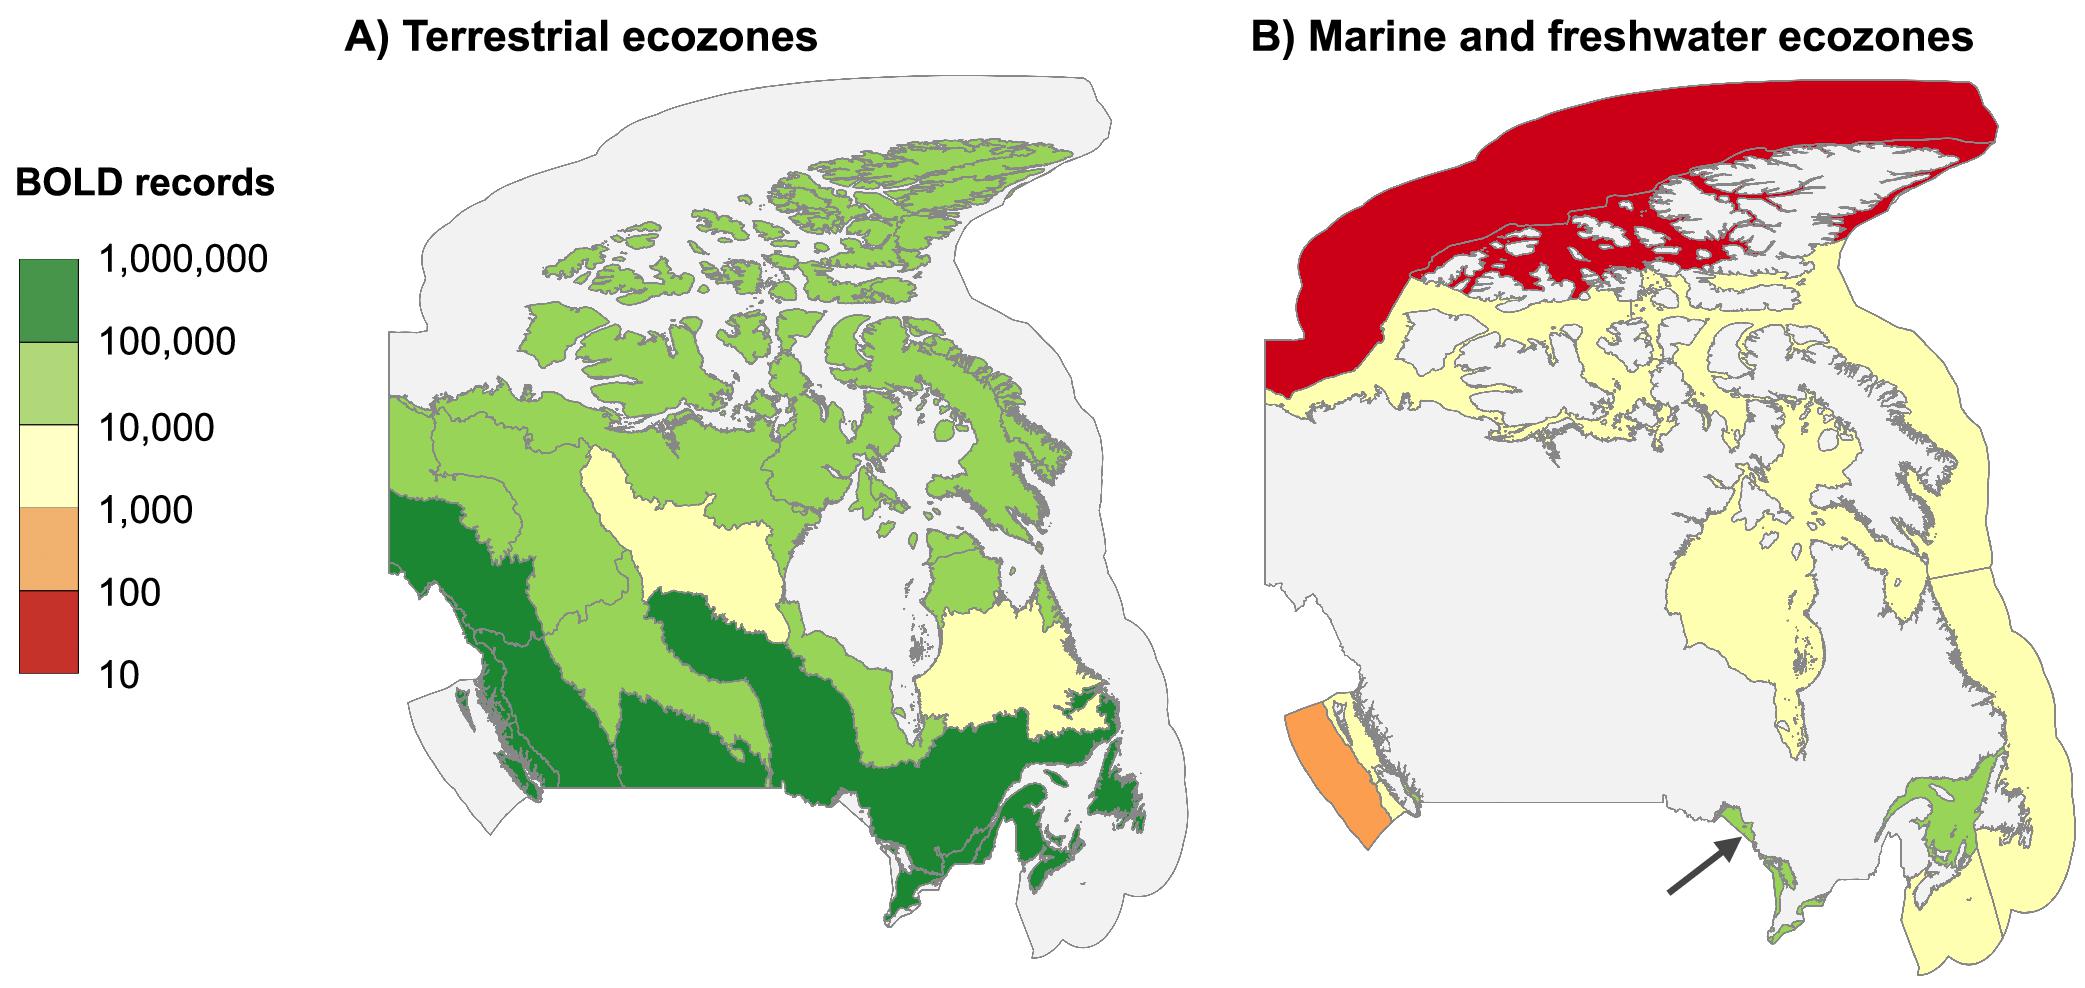
Fig. 3.
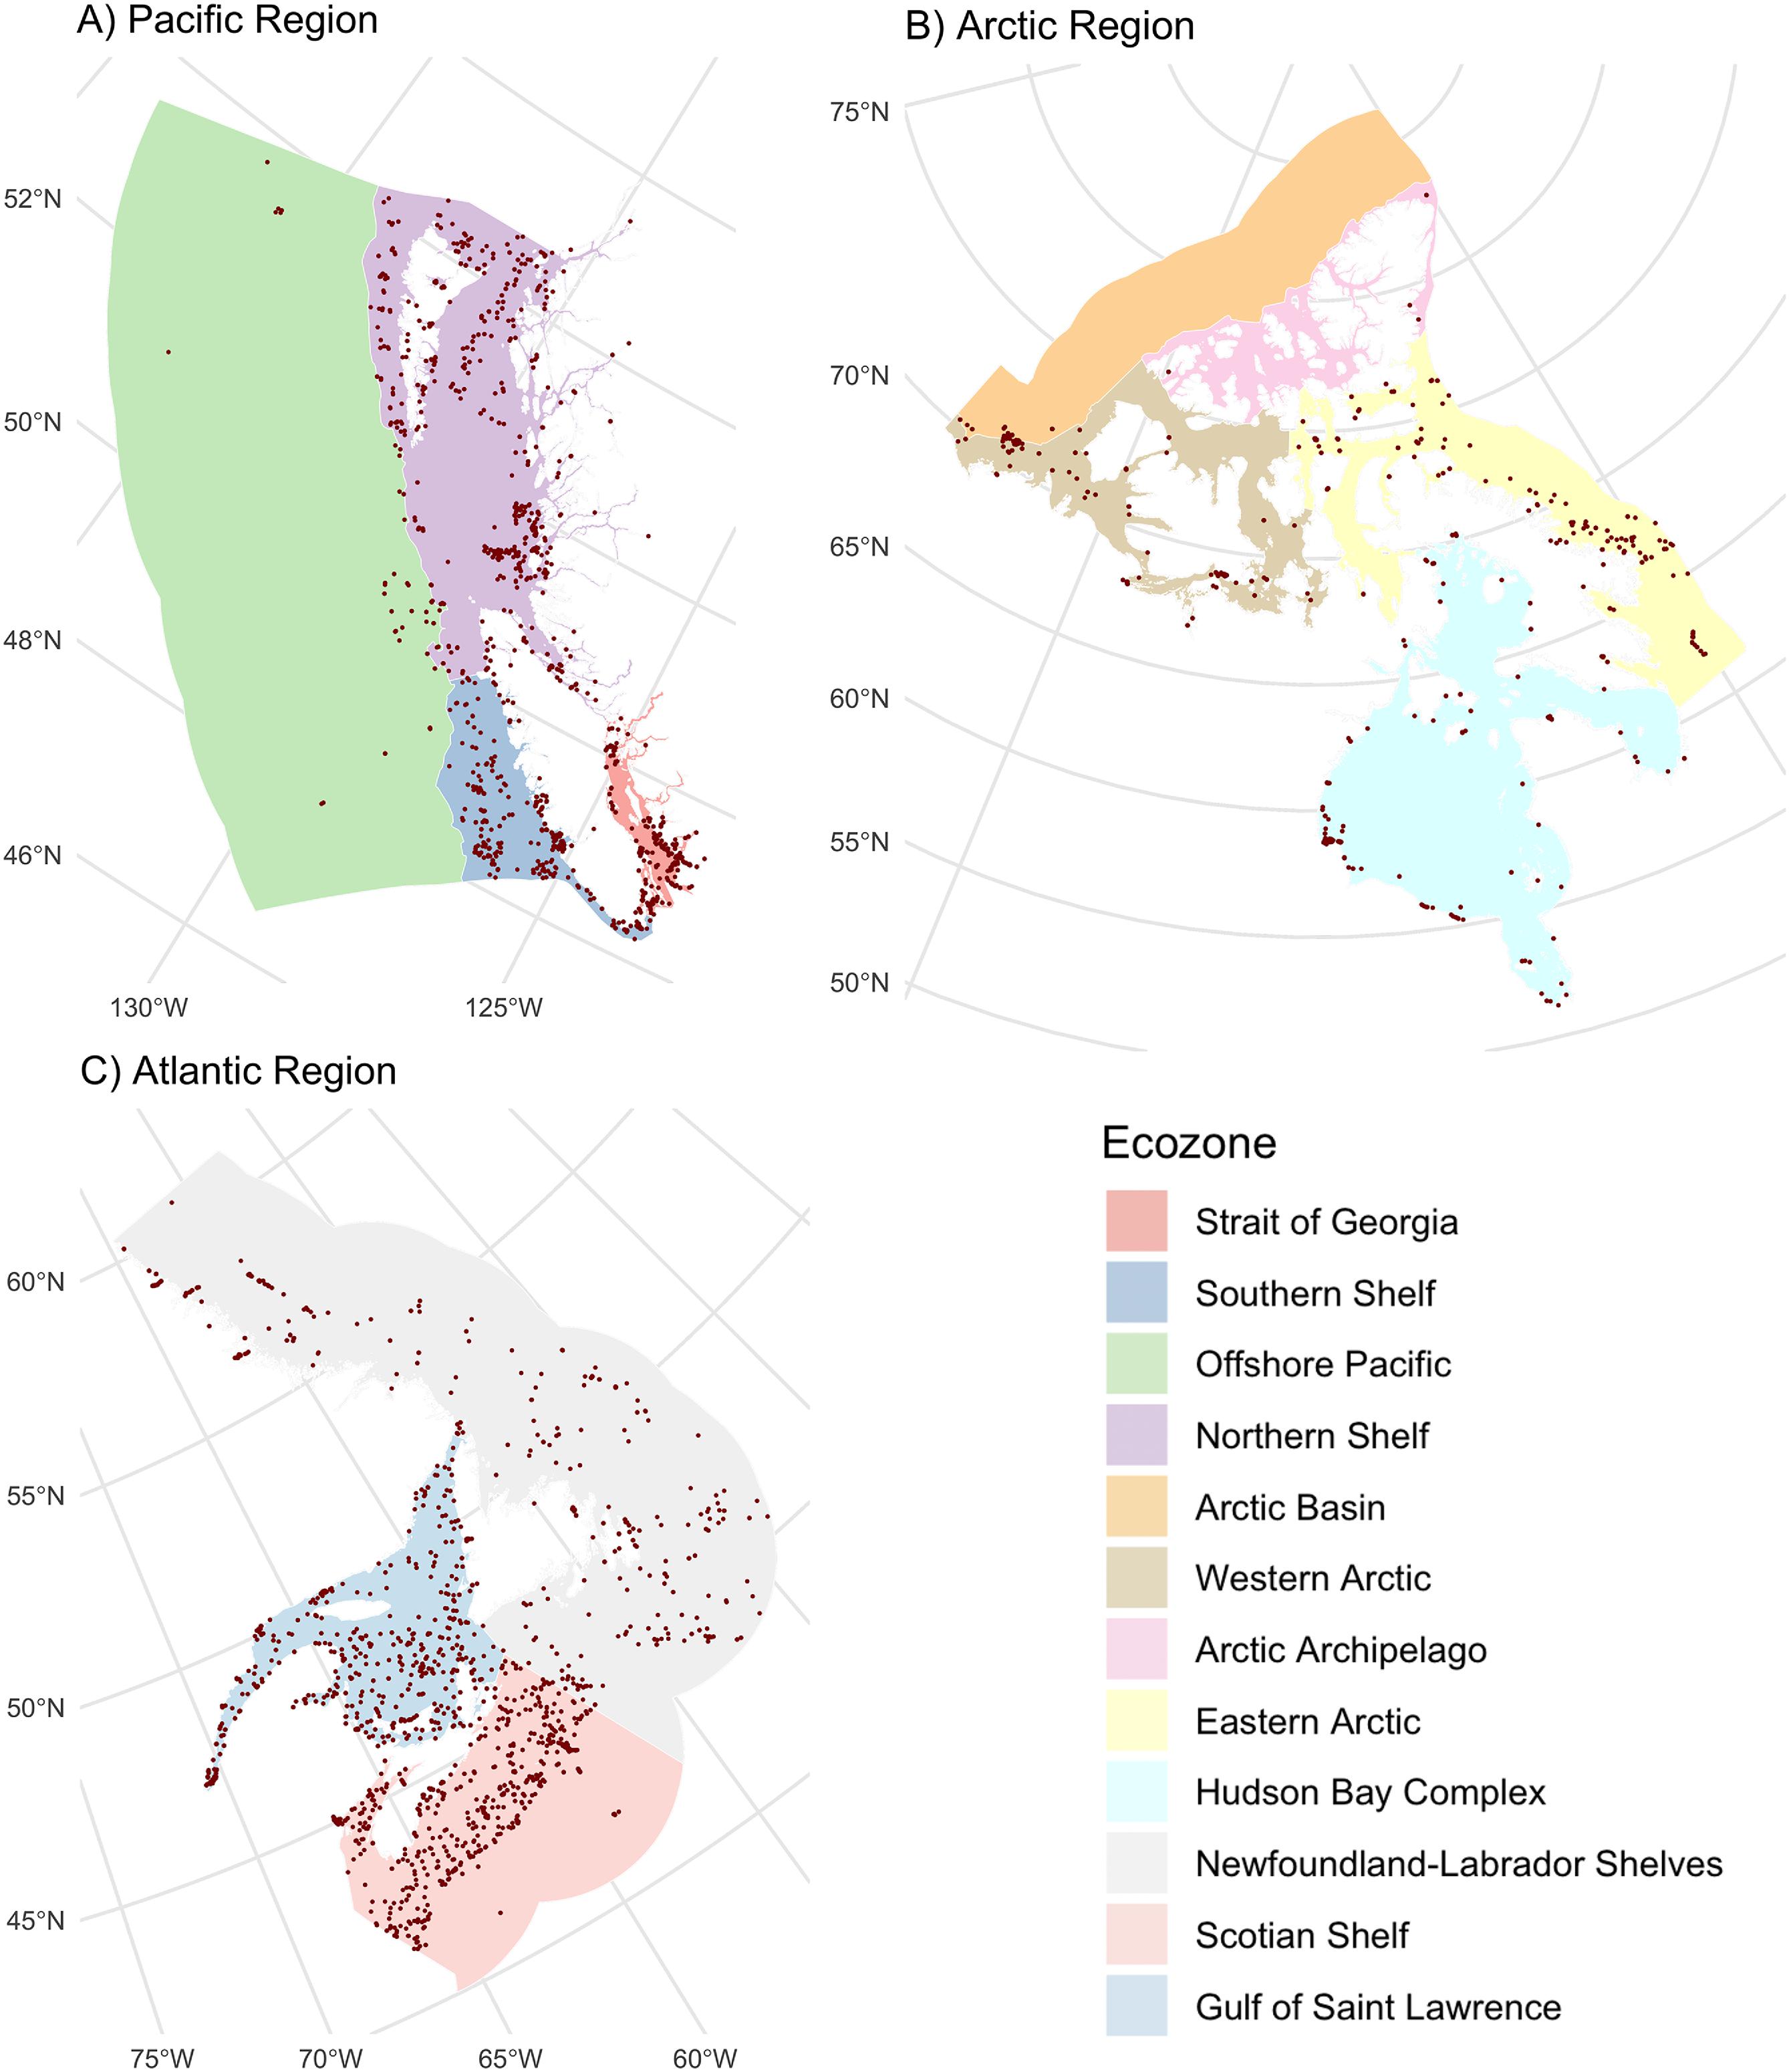
Fig. 4.
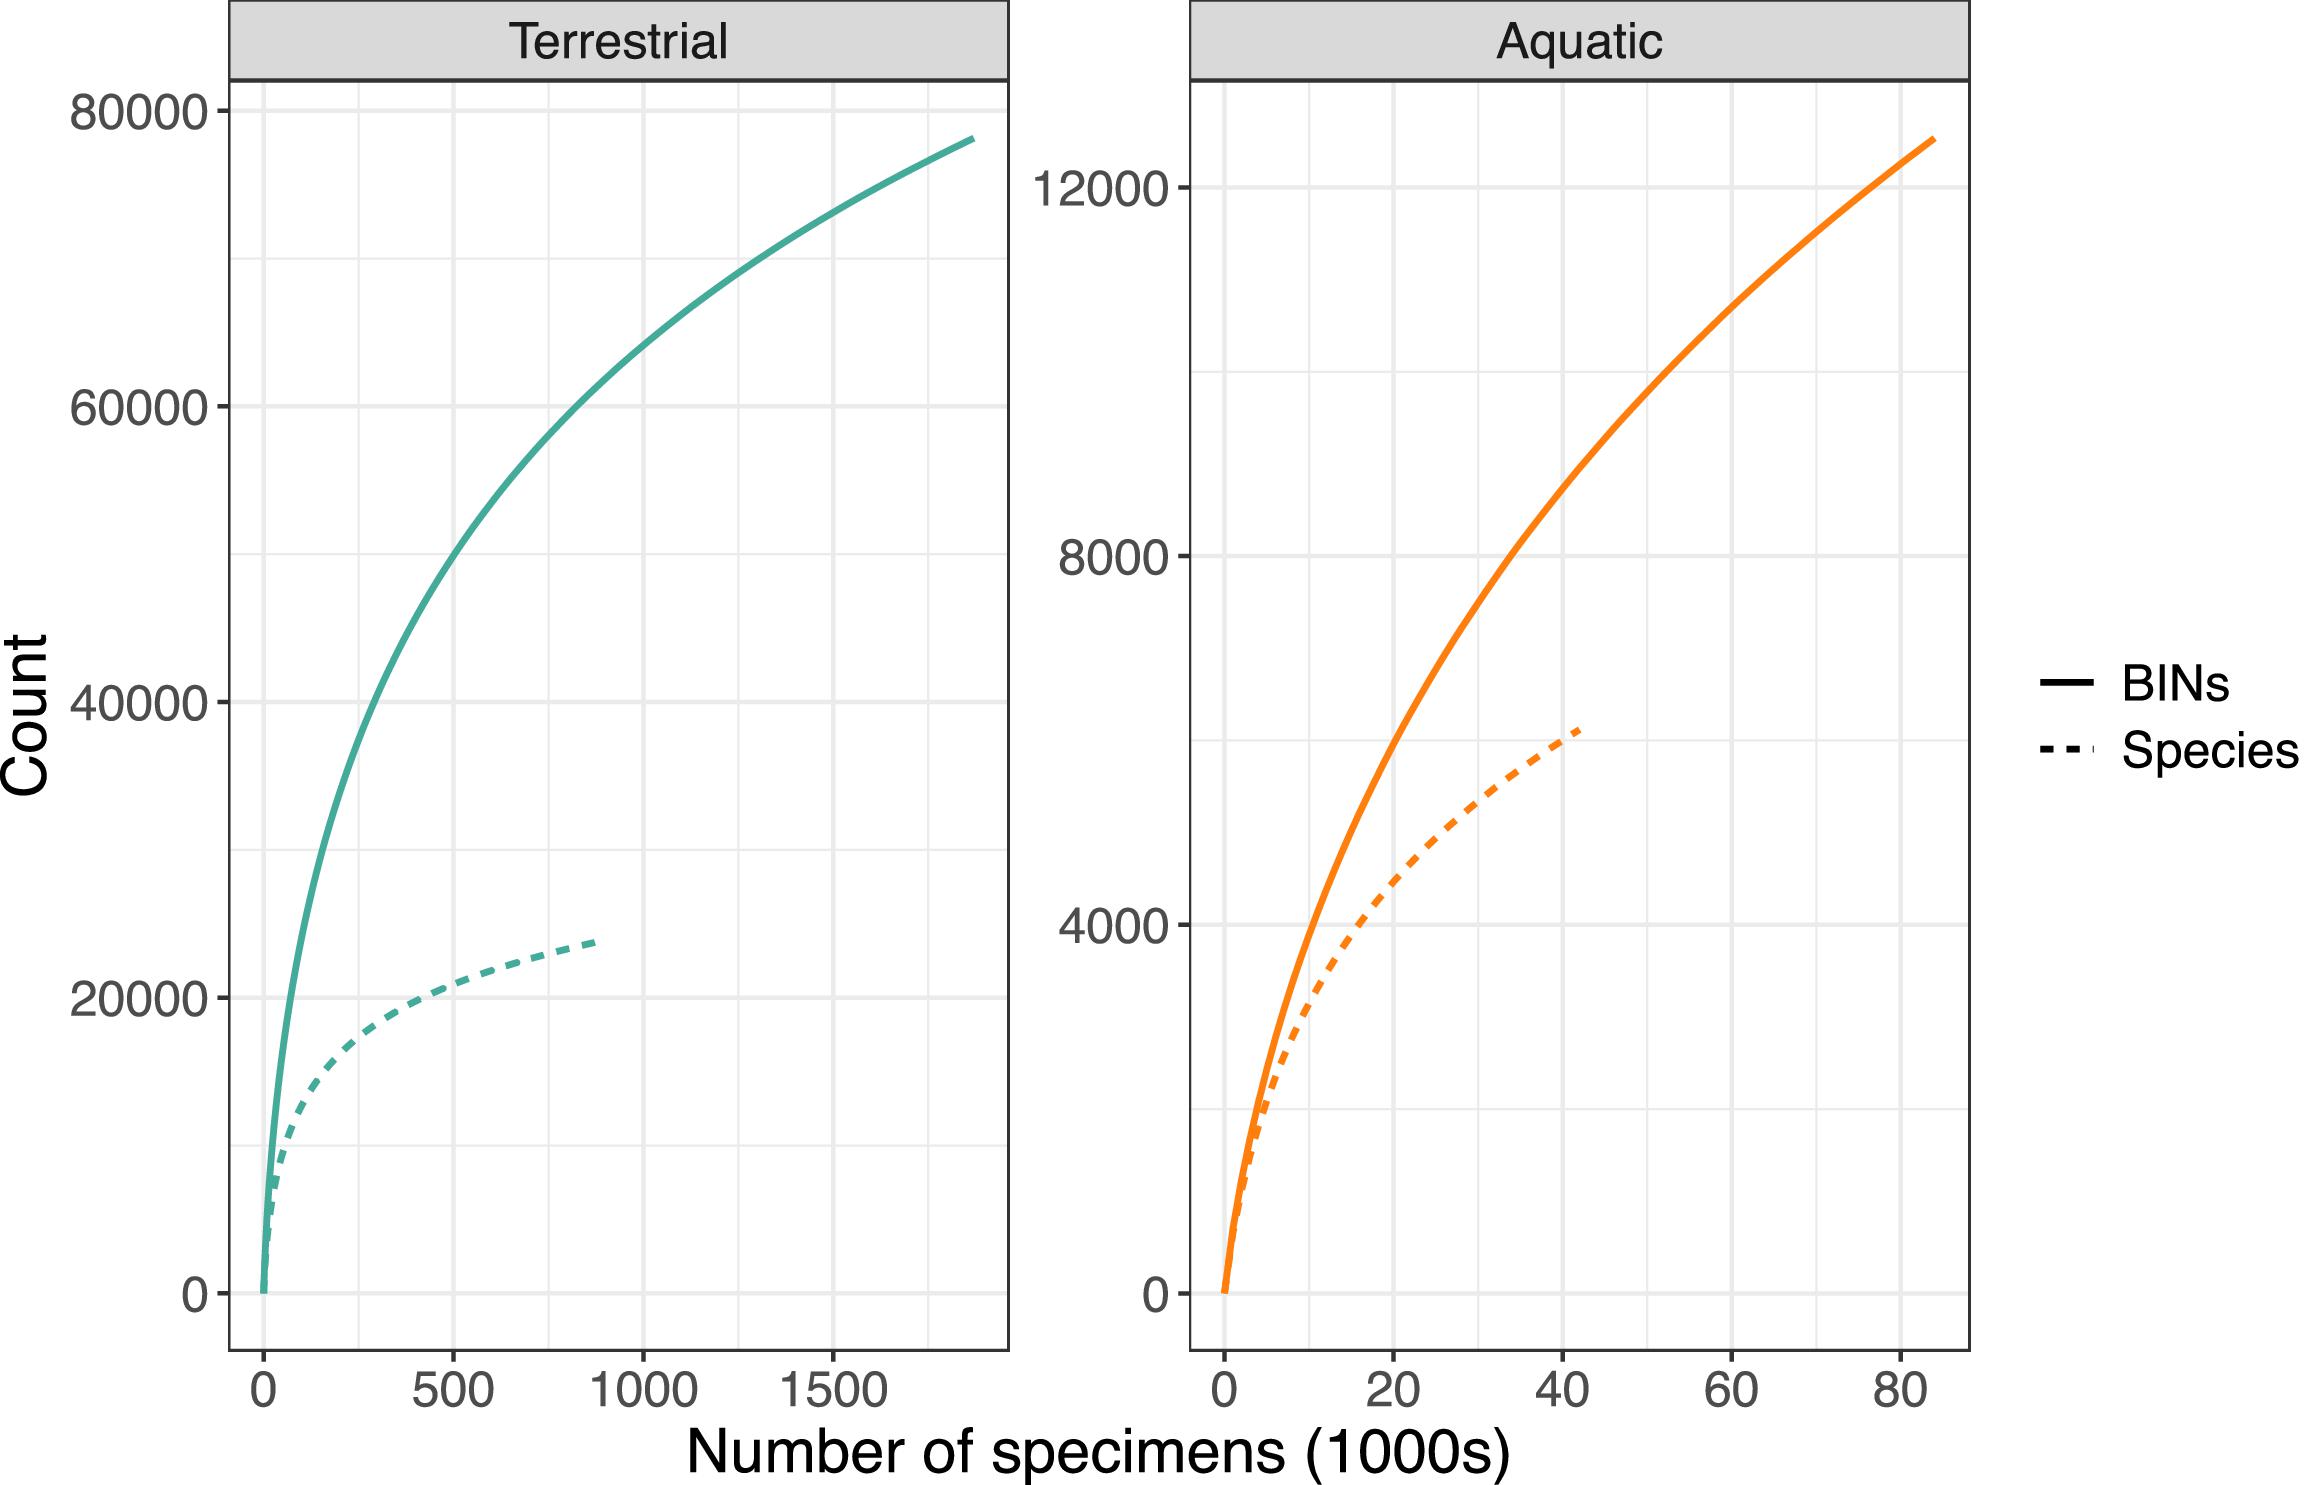
Table 1.
| Ecozone | Name | Area (km2) | Records | Records per 100 km2 |
|---|---|---|---|---|
| 1 | Arctic Cordillera | 244 568 | 28 159 | 11.5 |
| 2 | Atlantic Maritime | 201 735 | 237 720 | 117.8 |
| 3 | Boreal Cordillera | 470 758 | 139 472 | 29.6 |
| 4 | Boreal Plain | 740 693 | 99 487 | 13.4 |
| 5 | Boreal Shield | 1886 657 | 228 909 | 12.1 |
| 6 | Hudson Plain | 375 665 | 87 831 | 23.4 |
| 7 | Mixedwood Plains | 115 103 | 667 342 | 579.8 |
| 8 | Montane Cordillera | 489 977 | 363 027 | 74.1 |
| 9 | Northern Arctic | 1521 951 | 60 365 | 4.0 |
| 10 | Pacific Maritime | 208 927 | 100 275 | 48.0 |
| 11 | Prairie | 467 029 | 118 792 | 25.4 |
| 12 | Southern Arctic | 852 230 | 27 855 | 3.3 |
| 13 | Taiga Cordillera | 266 972 | 18 965 | 7.1 |
| 14 | Taiga Plain | 657 778 | 29 083 | 4.4 |
| 15 | Taiga Shield | 1393 227 | 6023 | 0.4 |
| Total | 9893 269 | 2213 305 | 22.4 | |
| Mean | 659 551 | 147 554 | 64 | |
| SD | 537 785 | 174 673 | 146 |
Table 2.
| Ecozone | Name | Area (km2) | Records | Records per 100 km2 |
|---|---|---|---|---|
| 16 | Strait of Georgia | 8969 | 18 690 | 208.38 |
| 17 | Southern Shelf | 28 159 | 3611 | 12.82 |
| 18 | Offshore Pacific | 315 724 | 154 | 0.05 |
| 19 | Northern Shelf | 101 663 | 3389 | 3.33 |
| 20 | Arctic Basin | 751 988 | 74 | 0.01 |
| 21 | Western Arctic | 539 862 | 1519 | 0.28 |
| 22 | Arctic Archipelago | 268 800 | 29 | 0.01 |
| 23 | Eastern Arctic | 782 566 | 1289 | 0.16 |
| 24 | Hudson Bay Complex | 1244 670 | 4619 | 0.37 |
| 25 | Newfoundland-Labrador Shelves | 1054 422 | 1490 | 0.14 |
| 26 | Scotian Shelf | 416 255 | 3206 | 0.77 |
| 27 | Gulf of Saint Lawrence | 246 648 | 22 062 | 8.94 |
| 28 | Great Lakes | 88 368 | 40 762 | 46.13 |
| Total | 5848 094 | 100 894 | 1.73 | |
| Mean | 449 853 | 7761 | 22 | |
| SD | 400 482 | 12 169 | 58 |
Despite the low sampling effort geographically, 60.5% of the marine animal species in CaRMS (n = 6373) were represented in BOLD by at least one record (Table 3). Most of these taxa possessed a high-quality sequence as 57.8% of the species on the CaRMS list were represented by at least one BIN (Fig. 5; Table 3) with an average of 39.3 records (±115 SD) per species, but 9.7% had just a single record. On average, 45.5% of known species for the 23 phyla in CaRMS possessed a BIN on BOLD. One phylum (Nematomorpha) lacked coverage, while all four species of Phorinida and 88.1% of the 1834 species of Chordata had coverage (Table 3). Among the 151 601 records for Canadian marine taxa, 74.7% derived from two phyla (Fig. 5; Table 3): Chordata (75 881 records) and Arthropoda (37 304 records). Coverage for the major marine groups was 54.4% for Annelida (55.3% for Polychaeta); 51.7% for Arthropoda (51.1% for Crustacea, 90.9% for Balanomorpha, 81.4% for Decapoda, and 54.3% for Peracarida); 88.1%% for Chordata (94.6% for Tetrapoda, 92.0% for Chondrichthyes, 38.7% for Tunicata, and 89.0% for Actinopterygii); 39.2% for Echinodermata (33.4% for Asteroidea, 100% for Crinoidea, 47.2% for Holothuroidea, and 76.0% for Ophiuroidea); 45.5% for Mollusca (45.9% for Bivalvia, 43.3% for Gastropoda, and 72.7% for Polyplacophora) (Tables 3 and 4). Family-level coverage averaged 56.3% (±42.3%) across phyla, and the highest ratio of BINs to species was 39 for one species in the family Hippothoidae (Bryozoa) (Supp. Data Table S1).
Fig. 5.

Table 3.
| Phylum | Accepted species | Species with records | Species with BINs | Coverage (%) | Total records | BIN-compliant records |
|---|---|---|---|---|---|---|
| Chordata | 1834 | 1633 | 1615 | 88.1 | 75 881 | 65 798 |
| Arthropoda | 1589 | 857 | 821 | 51.7 | 37 304 | 32 507 |
| Mollusca | 802 | 382 | 364 | 45.4 | 15 586 | 12 660 |
| Annelida | 579 | 331 | 315 | 54.4 | 7471 | 6 732 |
| Echinodermata | 508 | 222 | 199 | 39.2 | 6009 | 4 563 |
| Cnidaria | 359 | 225 | 204 | 56.8 | 4552 | 3 687 |
| Platyhelminthes | 216 | 15 | 6 | 2.8 | 647 | 393 |
| Bryozoa | 183 | 63 | 51 | 27.9 | 766 | 657 |
| Nematoda | 97 | 17 | 9 | 9.3 | 478 | 86 |
| Porifera | 62 | 32 | 29 | 46.8 | 338 | 285 |
| Nemertea | 38 | 22 | 22 | 57.9 | 730 | 705 |
| Acanthocephala | 34 | 18 | 14 | 41.2 | 560 | 481 |
| Chaetognatha | 17 | 11 | 10 | 58.8 | 929 | 653 |
| Xenacoelomorpha | 12 | 5 | 5 | 41.7 | 5 | 5 |
| Kinorhyncha | 9 | 4 | 4 | 44.4 | 7 | 7 |
| Ctenophora | 7 | 6 | 2 | 28.6 | 100 | 13 |
| Entoprocta | 5 | 3 | 3 | 60.0 | 10 | 10 |
| Hemichordata | 5 | 4 | 4 | 80.0 | 33 | 33 |
| Rotifera | 5 | 1 | 1 | 20.0 | 2 | 2 |
| Brachiopoda | 4 | 1 | 1 | 25.0 | 24 | 24 |
| Phoronida | 4 | 4 | 4 | 100.0 | 42 | 41 |
| Priapulida | 3 | 2 | 2 | 66.7 | 127 | 126 |
| Nematomorpha | 1 | 0 | 0 | 0.0 | 0 | 0 |
| Total | 6373 | 3858 | 3685 | 57.8 | 151 601 | 129 468 |
Table 4.
| Phylum | Group | Accepted species | Species on BOLD | Species with BIN(s) | Coverage (%) | Total records | BIN-compliant records |
|---|---|---|---|---|---|---|---|
| Annelida | Class Polychaeta | 544 | 317 | 301 | 55.3 | 6949 | 6213 |
| Arthropoda | Subphylum Crustacea | 1546 | 824 | 790 | 51.1 | 32 489 | 28 004 |
| Order Balanomorpha | 11 | 11 | 10 | 90.9 | 2314 | 2204 | |
| Order Decapoda | 188 | 156 | 153 | 81.4 | 9700 | 8285 | |
| Superorder Peracarida | 597 | 342 | 324 | 54.3 | 9868 | 8646 | |
| Order Amphipoda | 381 | 234 | 221 | 58.0 | 8285 | 7174 | |
| Order Isopoda | 84 | 49 | 47 | 56.0 | 573 | 514 | |
| Chordata | Megaclass Tetrapoda | 168 | 160 | 159 | 94.6 | 5143 | 4678 |
| Parvphylum Chondrichthyes | 113 | 104 | 104 | 92.0 | 10 336 | 8704 | |
| Subphylum Tunicata | 62 | 30 | 24 | 38.7 | 1972 | 1401 | |
| Gigaclass Actinopterygii | 1477 | 1326 | 1315 | 89.0 | 58 103 | 50 711 | |
| Echinodermata | Class Asteroidea | 377 | 145 | 126 | 33.4 | 2617 | 2002 |
| Class Crinoidea | 2 | 2 | 2 | 100.0 | 16 | 11 | |
| Class Echinoidea | 72 | 37 | 34 | 47.2 | 1738 | 1118 | |
| Class Holothuroidea | 32 | 18 | 18 | 56.3 | 575 | 562 | |
| Class Ophiuroidea | 25 | 20 | 19 | 76.0 | 1063 | 870 | |
| Mollusca | Class Bivalvia | 246 | 119 | 113 | 45.9 | 5991 | 4445 |
| Class Gastropoda | 490 | 220 | 212 | 43.3 | 8172 | 7010 | |
| Class Polyplacophora | 11 | 9 | 8 | 72.7 | 197 | 183 |
Discussion and conclusions
Considerable progress has been made in assembling a DNA barcode reference library for the Canadian fauna, but 95.6% of the 2.4 million records derive from terrestrial settings versus 4.4% for aquatic environments. On an areal basis, the number of records differs 13-fold between these two environments with 22.4/100 km2 versus 1.7/100 km2. Viewed from a taxonomic basis, BOLD has barcodes for 57.8% of described Canadian marine species, but certain phyla were underrepresented or absent. We highlight several important gaps that warrant targeted efforts going forward.
Our geographic analysis revealed major gaps in coverage for marine ecozones and northern regions. Marine records were concentrated along coastlines and inshore areas close to population centers, reflecting the fact that sampling remote marine settings requires substantial resources (Archambault et al. 2010). For this reason, northerly ecozones have received little attention as evidenced by two Arctic marine ecozones (Arctic Basin and Acric Archipelago) with fewer than 100 records (74 and 29, respectively). Significant gaps in barcode coverage were also evident in northern terrestrial ecozones. More than 0.5 million records derive from the Mixedwood Plains, Canada’s most southerly ecozone, while five of six arctic and subarctic ecozones had fewer than 30 000 records each. A direct comparison of sampling effort among biomes and ecozones is difficult because the distribution of organisms is not uniform. Since the number of records from remote regions may be doubly impacted by low biodiversity and by the concentration of sampling in more easily accessible areas, environments such as the open ocean and north should be prioritized for sampling. Addressing gaps in northern areas experiencing rapid warming is crucial for understanding the impacts of climate change (WWF 2022; IPCC 2023).
Sampling continued to capture new BINs as more specimens were analyzed in both terrestrial and aquatic ecozones. Despite the higher number of BINs relative to species, the terrestrial curves were closer to an asymptote than the aquatic curves, reflecting the extensive sampling effort on land. Aquatic records had twice as many BINs as species, a value higher than the 1.5x BINs per species found in a similar analysis in Europe (Leite et al. 2020). This difference may be driven by a few groups with many BINs per species, such as the bryozoan family Hippothoideae. The summary of barcode coverage by family (Supp. Data Table S1) provides a roadmap for prioritizing future efforts where the concentration of genetic diversity is likely the greatest.
Our summary of coverage by ecozone did not recover the same data as our summary by taxonomy. In fact, our geographic summary recovered 6117 aquatic species while our taxonomic summary recovered records for just 3858 species. Given this discordance, our sampling may be even lower for marine ecozones than suggested by our geographic analysis. The additional taxa attributed to aquatic ecozones in the geographic analysis likely included some terrestrial specimens collected along shorelines. As well, our aquatic ecozone analysis included the freshwater Great Lakes ecozone while the taxonomic analysis was restricted to marine taxa. Finally, some species within the taxonomic dataset with ranges extending either southwards or into Alaska may have been collected in the USA. While specimens collected elsewhere remain important as reference sequences, they may differ genetically from their Canadian conspecifics. Future work could assess whether any species have only been collected outside of Canada so sampling efforts can prioritize these groups.
The barcode coverage for described Canadian marine species from our taxonomic analysis is encouraging. Weigand et al. (2019) reported barcodes for just 22% of European marine species, while Leite et al. (2020) found 37% coverage within Atlantic Iberia. Coverage within major marine phyla was also lower in Europe than Canada (Weigand et al. 2019; Leite et al. 2020). However, among phyla with 50 or more described species, Nematoda and Platyhelminthes were severely under-represented in Canada. In addition, the checklist of marine animals for Canada is suspiciously low: it includes just 6373 species compared to Europe’s 16 962 species (Weigand et al. 2019) for a much smaller area. Certainly, taxonomic studies on the European marine fauna have been underway for far longer than similar work in Canada, and the number of taxonomists is much higher (Archambault et al. 2010). Accordingly, the apparently high coverage for the Canadian marine fauna may be an artefact of an incomplete species checklist rather than more comprehensive DNA barcode coverage.
Although more than half of the marine animal species known from Canada are on BOLD, the actual proportion of marine species with DNA barcodes is certainly lower because the CaRMS is incomplete as most marine species are undescribed. While CaRMS lists 7100 species across all kingdoms (CaRMS 2022), Archambault et al. (2010) estimated a final count of 15 988–61 148 marine species. Globally, 71%–91% of marine species are thought to be undescribed (Costello et al. 2010; Mora et al. 2011; Appeltans et al. 2012; Luypaert et al. 2020; Bouchet et al. 2023; Rogers et al. 2023). Despite recent improvements in constructing accessible reference libraries (Bucklin et al. 2021), the taxonomic diversity and deep evolutionary history of marine invertebrate lineages can complicate DNA barcode recovery (Radulovici et al. 2010; Bucklin et al. 2011; Lobo et al. 2013). For marine invertebrates, where specimen identifications can be slow to acquire (Ramirez et al. 2020), there is a need to reinforce collaborations between taxonomists and molecular biologists. Unfortunately, there are too few taxonomists to meet the need (Engel et al. 2021), and little funding for taxonomic research (Rogers et al. 2023). As a result, marine taxonomy is increasingly dependent upon retired experts and amateur scientists (Bouchet et al. 2023).
Additional limitations of current barcode coverage are the small number of public records for many species and discordances in taxonomic assignments. While our analysis did not include private records, coverage would be substantially improved by their inclusion (Weigand et al. 2019). Understanding species distributions, abundances, and trends over time requires multiple records per species (Hochkirch et al. 2021; Cowie et al. 2022), but many species on BOLD are currently represented by a single record (Weigand et al. 2019). For organisms with a broad geographic range, 14–25 records may be needed to evaluate the extent of regional variation (van Proosdij et al. 2016). Acquiring multiple barcodes per species is especially important for groups with high intraspecific variation or multiple BINs per species, where multiple sequences are needed to understand barcode variation (Meyer and Paulay 2005; Leite et al. 2020). A review of major marine invertebrate groups on BOLD found that 24% of species include misidentifications, ambiguities, or discordances, often reflecting taxonomic challenges (Radulovici et al. 2021). Addressing these limitations is crucial to enhance the effectiveness of DNA barcode reference libraries (Weigand et al. 2019; Fontes et al. 2021).
As arthropods are, by far, the most diverse animal phylum (Larsen et al. 2017), most Canadian barcoding efforts have focused on them (Pentinsaari et al. 2020; Young et al. 2021; Lowe et al. 2022). The resulting records address a critical need for biodiversity monitoring and conservation planning for species weakly represented in frameworks such as the IUCN Red List (IUCN 2023) which is focused on mammals and birds (Hochkirch et al. 2021). Geographic coordinates enhance the value of barcode data for tracking species distributions, range size, regional differences, invasive species, and susceptibility to anthropogenic pressures (Pimm et al. 2014; Seebens et al. 2021). Combining large-scale biodiversity databases like BOLD with spatial data on land and sea will provide a powerful tool for advancing progress towards biodiversity protection targets (Pimm et al. 2014).
The intensive studies on terrestrial organisms have reshaped knowledge of biodiversity patterns, including evolutionary insights and ecological patterns (Costa and Carvalho 2010; Joly et al. 2014; Mir et al. 2021). Barcoding has revealed hidden diversity in many insect orders, such as Lepidoptera (Hebert et al. 2004; D'Ercole et al. 2023), Coleoptera (Brunke et al. 2019; Pentinsaari et al. 2019), and Diptera (Bukowski et al. 2022; Chimeno et al. 2022). It has also challenged traditional taxonomic classifications, prompting revisions in species counts and altering our understanding of key biodiversity nodes (Stork 2017). DNA barcoding studies of marine invertebrates have also unveiled cryptic diversity (Carr et al. 2011; Matzen da Silva et al. 2011; Layton et al. 2014; Brasier et al. 2016; Vieira et al. 2022) and the steep slope of our species accumulation curve for marine species indicates that increased sampling in marine environments will reveal many more taxa. These cases of cryptic diversity suggest that further DNA barcoding and metabarcoding will continue to provide important insights into marine biodiversity, mirroring its success in terrestrial ecosystems (Hupało et al. 2019; Vieira et al. 2019, 2022).
In conclusion, this study has documented significant progress in building a DNA barcode reference library for the Canadian fauna, but it has also revealed geographic and taxonomic gaps. Marine environments, particularly northern and open ocean regions, require far more attention. Our results provide a roadmap for DNA barcoding efforts to address data gaps and to improve the quality of reference libraries. Potential paths for expanding taxonomic and regional coverage include dedicated initiatives that prioritize indicator species and target phylogenetic gaps (Weigand et al. 2019) and leveraging regular offshore surveys conducted by federal agencies such as Fisheries and Oceans Canada. This strategic approach will advance the scalability and cost-effectiveness of the molecular biosurveillance programs crucial for global biodiversity assessment and conservation (Compson et al. 2020; Grant et al. 2021; Ray et al. 2021).
Acknowledgements
This project was enabled by an NSERC Discovery grant to PDNH, by an NSERC CGS-D Scholarship to JS, and by an Accelerate Fellowship from MITACS. We thank Chris Ho, Adriana Radulovici, Sujeevan Ratnasingham, and Tyler Elliott for aiding data analysis and for their revisionary suggestions to the manuscript. This work was carried out at the University of Guelph that is situated within the treaty lands and territory of the Mississaugas of the Credit. The Anishinnabe and Hodinöhsö:ni′ peoples also have long-standing and on-going relationships with this land and each other while the Attawandaron people are represented in the archaeological record.
References
Apothéloz-Perret-Gentil L., Cordonier A., Straub F., Iseli J., Esling P., Pawlowski J. 2017. Taxonomy-free molecular diatom index for high-throughput eDNA biomonitoring. Molecular Ecology Resources, 17(6): 1231–1242.
Appeltans W., Ahyong S.T., Anderson G., Angel M.V., Artois T., Bailly N., et al. 2012. The magnitude of global marine species diversity. Current Biology, 22(23): 2189–2202.
Archambault P., Snelgrove P.V.R., Fisher J.A.D., Gagnon J.M., Garbary D.J., Harvey M., et al. 2010. From sea to sea: Canada's three oceans of biodiversity. PLoS One, 5(8): e12182.
Beng K.C., Corlett R.T. 2020. Applications of environmental DNA (eDNA) in ecology and conservation: opportunities, challenges and prospects. Biodiversity Conservation, 29(7): 2089–2121.
Borgelt J., Dorber M., Høiberg M.A., Verones F. 2022. More than half of data deficient species predicted to be threatened by extinction. Communications Biology, 5(1): 1–9.
Bouchet P., Decock W., Lonneville B., Vanhoorne B., Vandepitte L. 2023. Marine biodiversity discovery: the metrics of new species descriptions. Frontiers in Marine Science, 10.
Brasier M.J., Wiklund H., Neal L., Jeffreys R., Linse K., Ruhl H., Glover A.G. 2016. DNA barcoding uncovers cryptic diversity in 50% of deep-sea antarctic polychaetes. Royal Society Open Science, 3(11): 160432.
Brunke A.J., Bouchard P., Douglas H.B., Pentinsaari M. 2019. Coleoptera of Canada. ZooKeys, (819): 361–376.
Bucklin A., Peijnenburg K., Kosobokova K.N., O'Brien T.D., Blanco-Bercial L., Cornils A., et al. 2021. Toward a global reference database of COI barcodes for marine zooplankton. Marine Biology, 168(6): 78.
Bucklin A., Steinke D., Blanco-Bercial L. 2011. DNA barcoding marine Metazoa. Annual Review of Marine Science, 3: 471–508.
Bukowski B., Ratnasingham S., Hanisch P.E., Hebert P.D.N., Perez K., deWaard J., et al. 2022. DNA barcodes reveal striking arthropod diversity and unveil seasonal patterns of variation in the southern Atlantic Forest. PLoS One, 17(4): e0267390.
Callahan B.J., McMurdie P.J., Holmes S.P. 2017. Exact sequence variants should replace operational taxonomic units in marker-gene data analysis. ISME Journal, 11: 2639–2643.
CaRMS. 2022. Canadian Register of Marine Species. Edited by C. Nozeres, M.K. Kennedy. Available from https://www.marinespecies.org/carms/index.php [accessed 8 October 2022].
Carr C.M., Hardy S.M., Brown T.M., Macdonald T.A., Hebert P.D.N. 2011. A tri-oceanic perspective: DNA barcoding reveals geographic structure and cryptic diversity in Canadian polychaetes. PLoS One, 6(7): e22232.
CCEA. 2015. Canada Ecozones version 5_v20140218. Canadian Council on Ecological Areas. Available from https://ccea-ccae.org/ecozones-downloads/ [accessed 8 October 2022].
Chimeno C., Hausmann A., Schmidt S., Raupach M.J., Doczkal D., Baranov V., et al. 2022. Peering into the darkness: DNA barcoding reveals surprisingly high diversity of unknown species of Diptera (Insecta) in Germany. Insects, 13(1): 82.
Compson Z.G., McClenaghan B., Singer G.A.C., Fahner N.A., Hajibabaei M. 2020. Metabarcoding from microbes to mammals: comprehensive bioassessment on a global scale. Frontiers in Ecology and Evolution, 8: 581835.
Costa F.O., Carvalho G.R. 2010. New insights into molecular evolution: prospects from the Barcode of Life Initiative (BOLI). Theory in Biosciences, 129(2): 149–157.
Costello M.J., Coll M., Danovaro R., Halpin P., Ojaveer H., Miloslavich P. 2010. A census of marine biodiversity knowledge, resources, and future challenges. PLoS One, 5(8): e12110.
Cowie R.H., Bouchet P., Fontaine B. 2022. The sixth mass extinction: fact, fiction or speculation? Biological Reviews, 97(2): 640–663.
D'Ercole J., Vila R., Dapporto L., Pentinsaari M., Talavera G., Dincă V., Hebert P.D.N. 2023. Molecular evolution in introduced insect species—a mitochondrial perspective. Frontiers in Ecology and Evolution, 11: 1218690.
Deiner K., Bik H.M., Mächler E., Seymour M., Lacoursière-Roussel A., Altermatt F., et al. 2017. Environmental DNA metabarcoding: transforming how we survey animal and plant communities. Molecular Ecology, 26(21): 5872–5895.
Ecological Stratification Working Group. 1995. A national ecological framework for Canada. Agriculture and Agri-Food Canada, Research Branch, Centre for Land and Biological Resources Research and Environment Canada, State of the Environment Directorate, Ecozone Analysis Branch, Ottawa/Hull.
Engel M.S., Ceríaco L.M.P., Daniel G.M., Dellapé P.M., Löbl I., Marinov M., et al. 2021. The taxonomic impediment: a shortage of taxonomists, not the lack of technical approaches. Zoological Journal of the Linnean Society, 193(2): 381–387.
Fontes J.T., Vieira P.E., Ekrem T., Soares P., Costa F.O. 2021. BAGS: an automated Barcode, Audit & Grade System for DNA barcode reference libraries. Molecular Ecology Resources, 21(2): 573–583.
Government of Canada. 2017. A national ecological framework for Canada: GIS data. Available from https://sis.agr.gc.ca/cansis/nsdb/ecostrat/gis_data.html [accessed 8 October 2022].
Grant D.M., Brodnicke O.B., Evankow A.M., Ferreira A.O., Fontes J.T., Hansen A.K., et al. 2021. The future of DNA barcoding: reflections from early career researchers. Diversity, 13(7): 313.
Hebert P.D.N., Cywinska A., Ball S.L., DeWaard J.R. 2003. Biological identifications through DNA barcodes. Proceedings of the Royal Society Lond. B Biological Sciences, 270(1512): 313–321.
Hebert P.D.N., Penton E.H., Burns J.M., Janzen D.H., Hallwachs W. 2004. Ten species in one: DNA barcoding reveals cryptic species in the neotropical skipper butterfly Astraptes fulgerator. The Proceeding of the National Academy of Sciences, 101(41): 14812–14817.
Hebert P.D.N., Ratnasingham S., deWaard J.R. 2003. Barcoding animal life: cytochrome c oxidase subunit 1 divergences among closely related species. Proceedings of the Royal Society of London B (Suppl.), 270: S96–S99.
Hirvonen H. 2001. Canada's National Ecological Framework: an asset to reporting on the health of Canadian forests. The Forestry Chronicle, 77(1): 111–115.
Hochkirch A., Samways M.J., Gerlach J., Böhm M., Williams P., Cardoso P., et al. 2021. A strategy for the next decade to address data deficiency in neglected biodiversity. Conservational Biology, 35(2): 502–509.
Hupało K., Teixeira M.A.L., Rewicz T., Sezgin M., Iannilli V., Karaman G.S., et al. 2019. Persistence of phylogeographic footprints helps to understand cryptic diversity detected in two marine amphipods widespread in the Mediterranean basin. Molecular Phylogenetics and Evolution, 132: 53–66.
IPCC. 2023. AR6 Synthesis Report: Climate Change 2023. International Panel on Climate Change. Available from https://www.ipcc.ch/report/sixth-assessment-report-cycle/ [accessed 17 August 2023].
IUCN. 2023. The IUCN Red List of Threatened Species. International Union for the Conservation of Nature. Available from https://www.iucnredlist.org/en [accessed 17 August 2023].
Joly S., Davies T.J., Archambault A., Bruneau A., Derry A., Kembel S.W., et al. 2014. Ecology in the age of DNA barcoding: the resource, the promise and the challenges ahead. Molecular Ecology Resources, 14(2): 221–232.
Larsen B.B., Miller E.C., Rhodes M.K., Wiens J.J. 2017. Inordinate fondness multiplied and redistributed: the number of species on earth and the new pie of life. Quarterly Review of Biology, 92(3): 229–265.
Layton K.K.S., Martel A.L., Hebert P.D.N. 2014. Patterns of DNA barcode variation in Canadian marine molluscs. PLoS One, 9(4): e95003.
Leite B.R., Vieira P.E., Teixeira M.A.L., Lobo-Arteaga J., Hollatz C., Borges L.M.S., et al. 2020. Gap-analysis and annotated reference library for supporting macroinvertebrate metabarcoding in Atlantic Iberia. Regional Studies in Marine Science, 36: 101307.
Leray M., Knowlton N. 2016. Censusing marine eukaryotic diversity in the twenty-first century. Philosophical Transactions of the Royal Society B: Biological Sciences, 371(1702): 20150331.
Lobo J., Costa P.M., Teixeira M.A., Ferreira M.S., Costa M.H., Costa F.O. 2013. Enhanced primers for amplification of DNA barcodes from a broad range of marine metazoans. BMC Ecology, 13(1): 34.
Lowe A., Jones L., Witter L., Creer S., de Vere N. 2022. Using DNA metabarcoding to identify floral visitation by pollinators. Diversity, 14(4): 236.
Luypaert T., Hagen J.G., McCarthy M.L., Poti M. 2020. Status of marine biodiversity in the athropocene. In YOUMARES 9 - The Oceans: Our Research, Our Future: Proceedings of the 2018 Conference for YOUng MArine RESearcher in Oldenburg. Edited by G.S. Jungblut, V. Liebich, M. Bode-Dalby. Springer International Publishing, Cham. pp. 57–82.
Mächler E., Walser J.C., Altermatt F. 2021. Decision-making and best practices for taxonomy-free environmental DNA metabarcoding in biomonitoring using Hill numbers. Molecular Ecology, 30(13): 3326–3339.
Marshall I.B., Scott Smith C.A., Selby C.J. 1996. A national framework for monitoring and reporting on environmental sustainability in Canada. Environmental Monitoring and Assessment, 39(1): 25–38.
Matzen da Silva J., Creer S., dos Santos A., Costa A.C., Cunha M.R., Costa F.O., Carvalho G.R. 2011. Systematic and evolutionary insights derived from mtDNA COI barcode diversity in the Decapoda (Crustacea: Malacostraca). PLoS One, 6(5): e19449.
Meyer C.P., Paulay G. 2005. DNA barcoding: error rates based on comprehensive sampling. PLoS Biology, 3(12): 1–10.
Mir R.A., Bhat K.A., Rashid G., Ebinezer L.B., Masi A., Rakwal R., et al. 2021. DNA barcoding: a way forward to obtain deep insights about the realistic diversity of living organisms. The Nucleus, 64(2): 157–165.
Mora C., Tittensor D.P., Adl S., Simpson A.G.B., Worm B. 2011. How many species are there on Earth and in the ocean? PLoS Biology, 9(8): e1001127.
Omernik J.M. 1995. Ecoregions: a framework for managing ecosystems. Source: George Wright Society, 12(1): 35–50. Available from https://www.jstor.org/stable/43597408 [accessed 21 November 2022].
Pentinsaari M., Anderson R., Borowiec L., Bouchard P., Brunke A., Douglas H., et al. 2019. DNA barcodes reveal 63 overlooked species of Canadian beetles (Insecta, Coleoptera). Zookeys, 894: 53–150.
Pentinsaari M., Blagoev G.A., Hogg I.D., Levesque-Beaudin V., Perez K., Sobel C.N., et al. 2020. A DNA barcoding survey of an Arctic arthropod community: implications for future monitoring. Insects, 11(1): 46.
Pimm S.L., Jenkins C.N., Abell R., Brooks T.M., Gittleman J.L., Joppa L.N., et al. 2014. The biodiversity of species and their rates of extinction, distribution, and protection. Science, 344(6187).
Radulovici A.E., Archambault P., Dufresne F. 2010. DNA barcodes for marine biodiversity: moving fast forward? Diversity, 2(4): 450–472.
Radulovici A.E., Vieira P.E., Duarte S., Teixeira M.A.L., Borges L.M.S., Deagle B.E., et al. 2021. Revision and annotation of DNA barcode records for marine invertebrates: report of the 8th iBOL conference hackathon. Metabarcoding and Metagenomics, 5: e67862.
Ramirez J.L., Rosas-Puchuri U., Cañedo R.M., Alfaro-Shigueto J., Ayon P., Zelada-Mázmela E., et al. 2020. DNA barcoding in the Southeast Pacific marine realm: low coverage and geographic representation despite high diversity. PLoS One, 15(12): e0244323.
Ratnasingham S., Hebert P.D.N. 2007. BOLD: the barcode of life data system (www.barcodinglife.org). Molecular Ecology Notes, 7(3): 355–364.
Ratnasingham S., Hebert P.D.N. 2013. A DNA-based registry for all animal species: the Barcode Index Number (BIN) System. PLoS One, 8(7): e66213.
Ray J.C., Grimm J., Olive A. 2021. The biodiversity crisis in Canada: failures and challenges of federal and sub-national strategic and legal frameworks. Facets, 6: 1044–1068.
Rogers A.D., Appiah-Madson H., Ardron J.A., Bax N.J., Bhadury P., Brandt A., et al. 2023. Accelerating ocean species discovery and laying the foundations for the future of marine biodiversity research and monitoring. Frontiers in Marine Science, 10.
Ruppert K.M., Kline R.J., Rahman M.S. 2019. Past, present, and future perspectives of environmental DNA (eDNA) metabarcoding: a systematic review in methods, monitoring, and applications of global eDNA. Global Ecology and Conservation, 17: e00547.
Seebens H., Bacher S., Blackburn T.M., Capinha C., Dawson W., Dullinger S., et al. 2021. Projecting the continental accumulation of alien species through to 2050. Global Change Biology, 27(5): 970–982.
Sinniger F., Pawlowski J., Harii S., Gooday A.J., Yamamoto H., Chevaldonné P., et al. 2016. Worldwide analysis of sedimentary DNA reveals major gaps in taxonomic knowledge of deep-sea benthos. Frontiers in Marine Science, 3(JUN): 1–14.
Smith J.R., Nicholas Hendershot J., Nova N., Daily G.C., Jeffrey Smith C.R., Casper G., Morgridge J.P. 2020. The biogeography of ecoregions: descriptive power across regions and taxa. Journal of Biogeography, 47(7): 1413–1426.
Spalding M.D., Fox H.E., Allen G.R., Davidson N., Ferdaña Z.A., Finlayson M.A.X., et al. 2007. Marine ecoregions of the world: a bioregionalization of coastal and shelf areas. BioScience, 57(7): 573–583. Available from http://www.jstor.org/stable/10.1641/B570707. [accessed October 2022].
Stork NE. 2017. How many species of insects and other terrestrial arthropods are there on Earth? Annual Review of Entomology, 63: 31–45.
van Proosdij A.S.J., Sosef M.S.M., Wieringa J.J., Raes N. 2016. Minimum required number of specimen records to develop accurate species distribution models. Ecography, 39(6): 542–552.
Vieira P.E., Desiderato A., Azevedo S.L., Esquete P., Costa F.O., Queiroga H. 2022. Molecular evidence for extensive discontinuity between peracarid (Crustacea) fauna of Macaronesian islands and nearby continental coasts: over fifty candidate endemic species. Marine Biology, 169(5): 64.
Vieira P.E., Desiderato A., Holdich D.M., Soares P., Creer S., Carvalho G.R., et al. 2019. Deep segregation in the open ocean: Macaronesia as an evolutionary hotspot for low dispersal marine invertebrates. Molecular Ecology, 28(7): 1784–1800.
Weigand H., Beermann A.J., Čiampor F., Costa F.O., Csabai Z., Duarte S., et al. 2019. DNA barcode reference libraries for the monitoring of aquatic biota in Europe: gap-analysis and recommendations for future work. Science of the Total Environment, 678: 499–524.
WWF. 2022. Living Planet Report 2022. World Wildlife Fund. Available from https://livingplanet.panda.org/en-US/ [accessed 17 August 2023].
Young R.G., Milián-García Y., Yu J., Bullas-Appleton E., Hanner R.H. 2021. Biosurveillance for invasive insect pest species using an environmental DNA metabarcoding approach and a high salt trap collection fluid. Ecology and Evolution, 11(4): 1558–1569.
Supplementary material
Supplementary Material 1 (XLSX / 102 KB).
- Download
- 102.82 KB
Information & Authors
Information
Published In
FACETS
Volume 9 • Number 1 • January 2024
Pages: 1 - 11
Editor: Michael Rennie
History
Received: 22 January 2024
Accepted: 9 July 2024
Version of record online: 18 October 2024
Copyright
© 2024 The Author(s). This work is licensed under a Creative Commons Attribution 4.0 International License (CC BY 4.0), which permits unrestricted use, distribution, and reproduction in any medium, provided the original author(s) and source are credited.
Data Availability Statement
Data used in this study are publicly available on the Barcode of Life Data System (BOLD; https://boldsystems.org/). Supplemental data tables S1 contains family-level DNA barcode coverage information for marine animal phyla.
Key Words
Sections
Subjects
Plain Language Summary
DNA Barcoding and Biodiversity in Canada: Progress, Gaps, and the Path Forward for Conservation
Authors
Author Contributions
Conceptualization: PDNH
Data curation: JAS, PDNH
Formal analysis: JAS
Funding acquisition: PDNH
Investigation: JAS
Methodology: JAS, PDNH
Project administration: PDNH
Resources: PDNH
Supervision: PDNH
Visualization: JAS
Writing – original draft: JAS
Writing – review & editing: JAS, PDNH
Competing Interests
The authors declare no competing interests.
Metrics & Citations
Metrics
Other Metrics
Citations
Cite As
Jessica A. Schultz and Paul D.N. Hebert. 2024. Marine ecozones represent a major gap in Canadian DNA barcoding efforts. FACETS.
9: 1-11.
https://doi.org/10.1139/facets-2024-0015
Export Citations
If you have the appropriate software installed, you can download article citation data to the citation manager of your choice. Simply select your manager software from the list below and click Download.
Cited by
1. Morphological and metabarcoding dietary analysis of the cunner wrasse (
Tautogolabrus adspersus
) revealed significant regional variation, with large overlap between its common prey species and biofouling animals living on salmonid sea cages