Assessing climate change vulnerability in Canadian marine conservation networks: implications for conservation planning and resilience
Abstract
Marine protected areas (MPAs) are critical in safeguarding biodiversity and ecosystem functions under climate change. The long-term effectiveness of these static conservation measures will depend on how well they represent current and future ocean changes. Here, we use the Climate Risk Index for Biodiversity to assess the vulnerability representation of marine ecosystems within the Canadian marine conservation network (CMCN) under two divergent emissions scenarios. We found that MPAs best represent climate vulnerability in Atlantic Canada (85% representativity overall, and 93% in the Gulf of Saint Lawrence under low emissions), followed by the Pacific (78%) and Arctic (63%; lowest in the Eastern Arctic (41% under high emissions) regions). Notably, MPAs with lower climate vulnerability are proportionally overrepresented in the CMCN. Broad-scale geographic targets employed in the Scotian Shelf-Bay of Fundy network planning process achieve over 90% representativity of climate vulnerabilities, underscoring the importance of ensuring habitat representativity and geographic distribution in conservation planning to enhance climate resilience, even if not explicitly prioritized. Moving towards Canada’s target to protect 30% of its waters by 2030, prioritizing representativity and designation of MPAs in currently underrepresented climate-vulnerable regions may be crucial to enhancing the resilience of the CMCN amidst an ever-changing climate.
Introduction
Climate change is creating a warmer, more acidic, and oxygen-limited ocean, trends that are expected to continue at least until 2050, even under the most ambitious emission reduction scenarios (IPCC 2021). These climatic changes affect marine species through many pathways, including physiological processes (Pörtner et al. 2008; Pörtner and Peck 2010) and the spatial/temporal dynamics of ecosystems that they inhabit (Molinos et al. 2016; Scheffers et al. 2016; Henson et al. 2017). Such impacts alter the abundance and distribution of species, ecosystems, fisheries, and livelihoods of those who depend on them (Lotze et al. 2019; Boyce et al. 2020; Bryndum-Buchholz et al. 2022). Emission mitigation is the most straightforward path to reducing climate impacts (Bates et al. 2019; Fawzy et al. 2020), but marine protected areas (MPAs) are a vital adaptation approach that can support climate resilience (e.g., Roberts et al. 2017; Jacquemont et al. 2022). In Canada, MPAs are a legislative management tool established under the Oceans Act, used by the government to protect ocean spaces for long-term biodiversity conservation through targeted restrictions on activities based on risk to the conservation objectives associated with a given location (Oceans Act S.C. 1996 c. 31. 2018). Within it, an MPA is defined as “a clearly defined geographical space, recognized, dedicated and managed, through legal or other effective means, to achieve the long-term conservation of nature with associated ecosystem services and cultural values” (DFO 2010). In addition to MPAs, Canada’s marine conservation strategy includes other regulatory tools, including “other effective conservation measures” (OECMs), which represent spatially-defined areas that provide long-term, measurable biodiversity conservation benefits, including National Parks and National Marine Conservation Areas (NMCAs; administered by Parks Canada), Migratory Bird Sanctuaries and National Wildlife Areas (NMWA; administered by Environment and Climate Change Canada), and Marine Refuges (administered by Fisheries and Oceans Canada). Although not necessarily or formally designated for biodiversity protection, OECMs represent measures that confer biodiversity conservation benefits and contribute to Canada’s international conservation commitments (Bryndum-Buchholz et al. 2022). For example, “Marine Refuges” are areas regulated under Canada’s Fisheries Act, primarily for fisheries management purposes. However, these areas also provide biodiversity conservation benefits by limiting activities that could otherwise negatively impact marine ecosystems. The Marine Protection Standard (DFO 2023) provides a standardized framework for permissible activities within federal MPAs, restricting activities such as oil and gas development, offshore mining, and bottom trawling, aligning with IUCN standards (IUCN-WPCA 2018). While the protection criteria for OECMs share similarities with those of MPAs, they utilize a “case-by-case” method to evaluate the influence of various economic activities on their conservation objectives. For Marine Refuges, this process is applied when establishing regulations for activities not addressed by the Fisheries Act that conflict with biodiversity conservation objectives. Hereafter, we refer to MPAs and OECMs collectively as “MPAs”, due to their joint contributions to Canada’s conservation targets (e.g., “30 by 30”).
The ability to adapt to changing conditions becomes particularly important for static conservation measures in a dynamically changing climate. However, marine conservation plans rarely consider climate change and often lack tangible design and management actions to mitigate its impacts (Wilson et al. 2020; O'Regan et al. 2021; Bryndum-Buchholz et al. 2022; Bryce and Hunter 2024). For instance, O'Regan et al. (2021) reported that climate change was considered in only 26% of reviewed Canadian MPA management plans compared to 57% in the United States. While some management plans for Canadian MPAs have reviewed potential climate change-related indicators that could be monitored (e.g., Faille et al. 2019), most are site-focussed, abstracted from the broader network where climate change impacts may be most apparent. Thus far, Canada’s growing marine conservation network (CMCN) has no explicit objective for addressing climate change and/or supporting climate resilience (Bryndum-Buchholz et al. 2022). However, in 2021, the Fisheries and Oceans Canada mandate outlined directives for modernizing the Oceans Act. This included considering climate change impacts on marine ecosystems and species in regional ocean management, ensuring measurable indicators and objectives, and expanding climate vulnerability work to inform conservation planning and management (Prime Minister of Canada 2021).
Incorporating climate change vulnerability into marine conservation decision-making aligns with scientific recommendations for protections distributed across a spectrum of anticipated changes or “climate risks” (e.g., Foden et al. 2019; Wilson et al. 2020). By incorporating and equitably representing anticipated levels of change into conservation measures for a given planning region, a network of conservation areas will be better equipped to support biodiversity over the long-term. Areas of rapid change can be hotspots for emergent new ecosystems and/or may represent future areas of importance for species of conservation concern, biodiversity, or productivity if protected from other stressors (Cheung et al. 2009; Rilov et al. 2020; Queirós et al. 2021). Alternatively, placing protections in locations where change is slow can provide refugia for species with lower or narrower temperature tolerances and safeguard areas where species turnover may be commensurately lower (Queirós et al. 2016; Rilov et al. 2020; Arafeh-Dalmau et al. 2021). As Wilson et al. (2020) summarized, it is widely suggested that protecting the full range of climate impacts can support connectivity and/or seeding of shifting populations, ecosystem functions, representative habitat types, and adaptivity of species to environmental change. In this respect, resilience is not limited to increasing the ability of protected ecosystems to resist change (e.g., Jacquemont et al. 2022) but also safeguarding biodiversity and ecosystem functions as they evolve.
Canada has made substantial progress towards its 2030 marine conservation targets, with just under 15% of its exclusive economic zone (EEZ) protected as of 2023. In the next six years, Canada has committed to establishing MPAs in another 15% of its EEZ, comprising ∼862 000 km2, equivalent to 20% of its land area. The conservation objectives of the CMCN prioritize long-term protection of marine biodiversity, ecosystem function, and special natural features (Government of Canada 2011). While regulatory measures like MPAs and OECMs offer enduring protection, the planning of conservation areas at the bioregional and national levels has, for the most part, not directly considered how conservation effectiveness might evolve over time (e.g., DFO 2014, 2018). While some networks have begun to assess the impact of climate change on their conservation strategies (Lewis et al. 2023; Rubidge et al. 2024), overall, there remains uncertainty in this area. Tools such as climate change vulnerability assessments are available to help bridge this gap, providing the information needed to design representative, climate-resilient conservation networks in Canada. Vulnerability assessments provide information on how species and/or ecosystems are anticipated to respond to climate change and have been recommended to help conservation planners create more representative, climate-resilient networks, which can support a multitude of future conditions (Wilson et al. 2020; Bryndum-Buchholz et al. 2022).
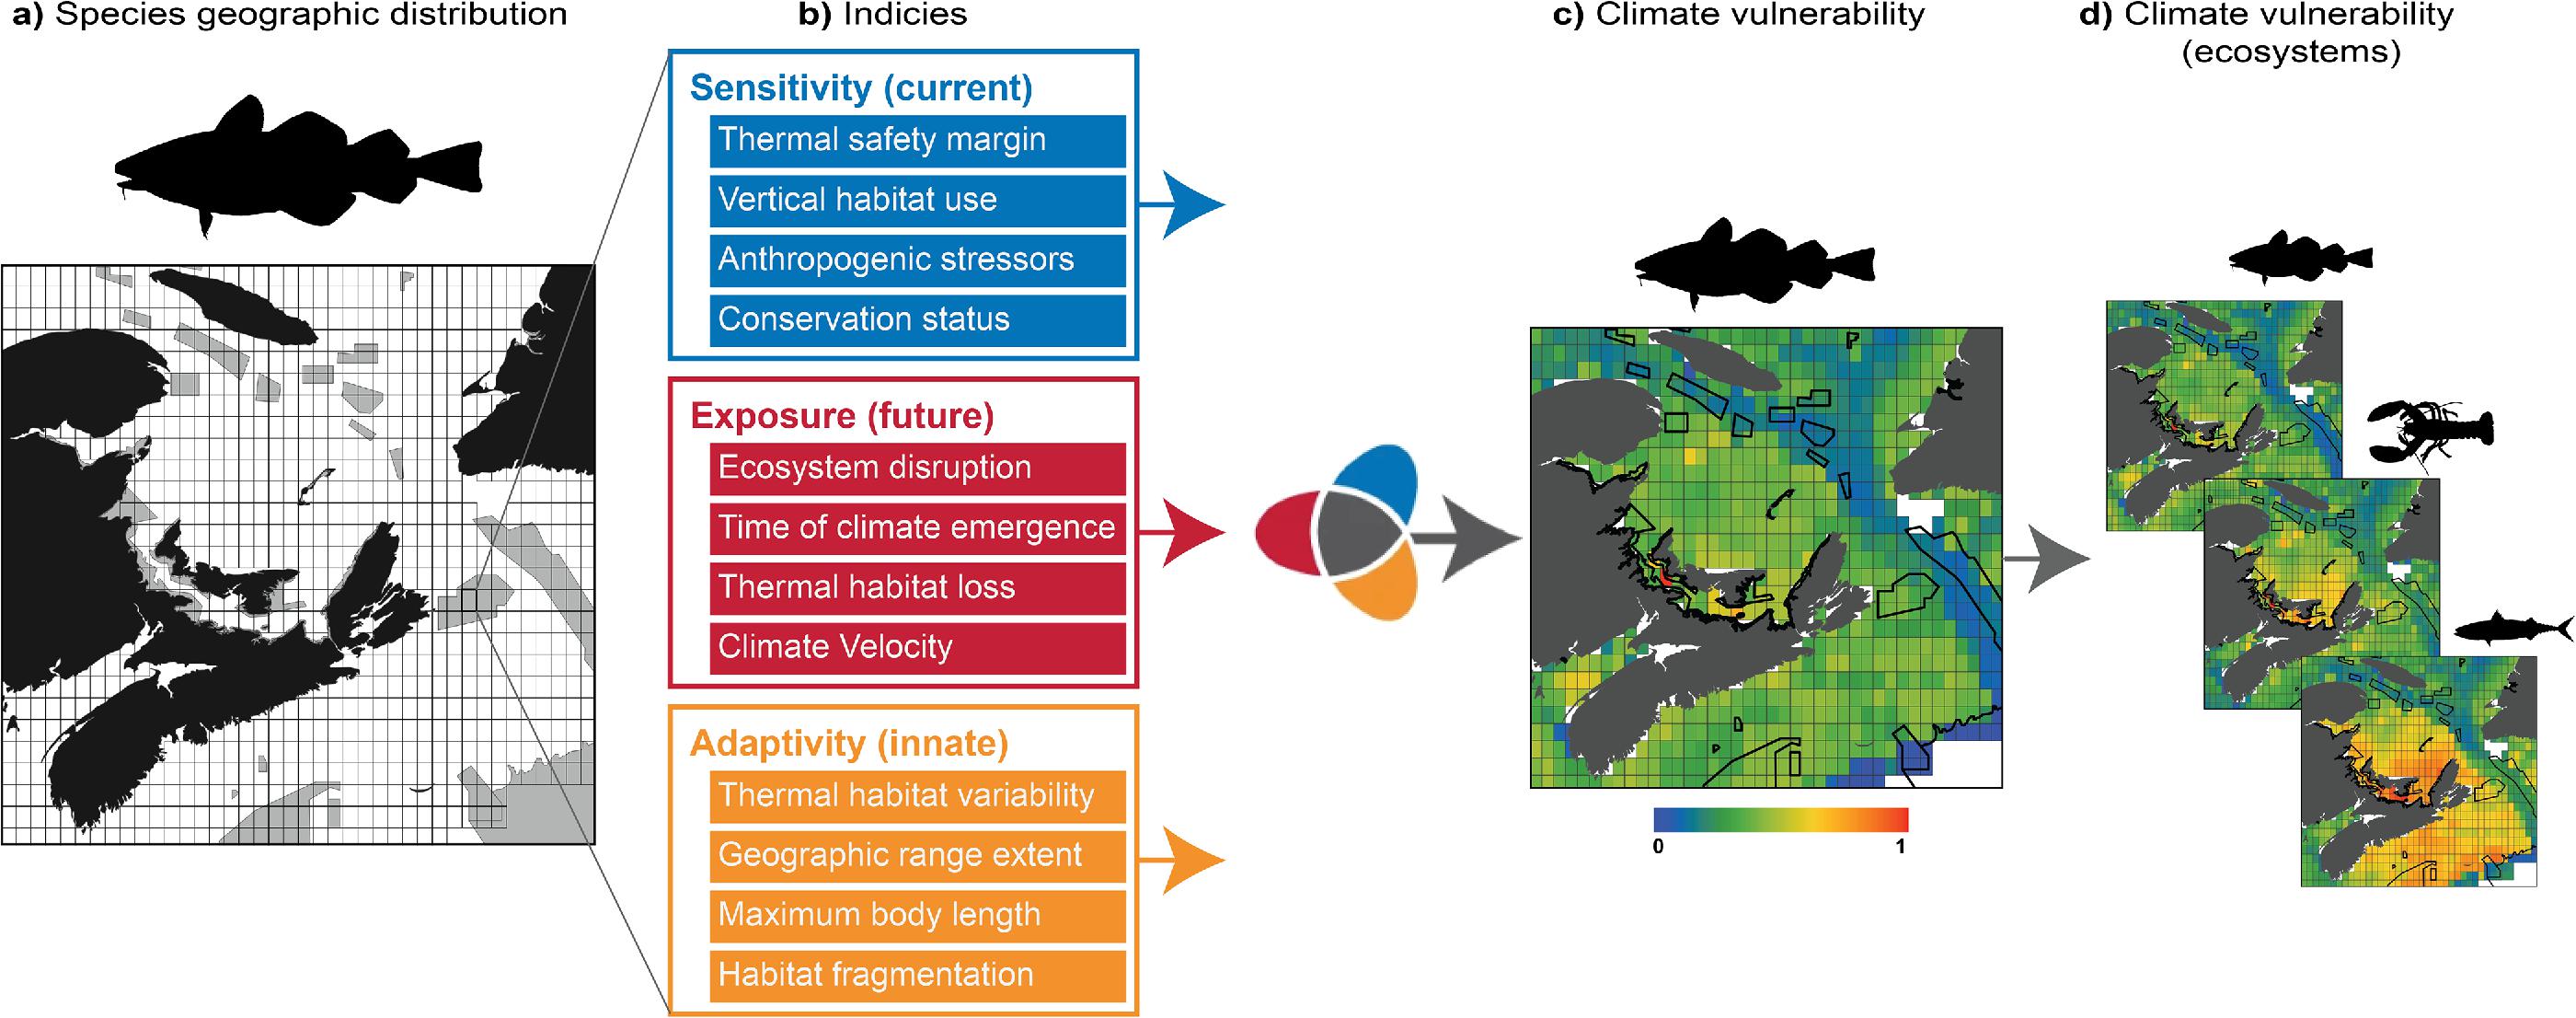
In this study, we evaluated the representation of climate change vulnerability within the CMCN to identify opportunities for supporting its climate resilience. Our analysis covered national, ocean basin, and bioregional scales, and focused in on a draft conservation area network in Eastern Canada (Fig. 1). We employed the spatially explicit Climate Risk Index for Biodiversity (CRIB) developed by Boyce et al. (2022), which calculates climate change vulnerability scores for marine species based on how their traits interact with historical and projected ocean warming, and other factors such as their conservation status and exposure to other stressors (Fig. 2). Averaging the individual species vulnerability scores at each location yields ecosystem-level vulnerabilities that characterize the emergent likelihood that biodiversity (e.g., the species assemblage at a given location) will be adversely impacted, locally extirpated, or potentially extinct due to climate change. A higher vulnerability score denotes an ecosystem containing many species expected to experience climate-driven population decline, geographic distribution shifts, thermal stress, and drastic community restructuring, with greater magnitude and rapid onset impacts. In short, we expect such ecosystems to be rapidly rewired under climate change within the given projection timeframe. By comparing CRIB-derived vulnerabilities within MPAs to surrounding areas, we identified representativity gaps and potential issues associated with a climate change-agnostic network design approach. Our findings highlight the importance of incorporating climate resilience into the CMCN as Canada works towards its 30% marine conservation target.
Fig. 1.
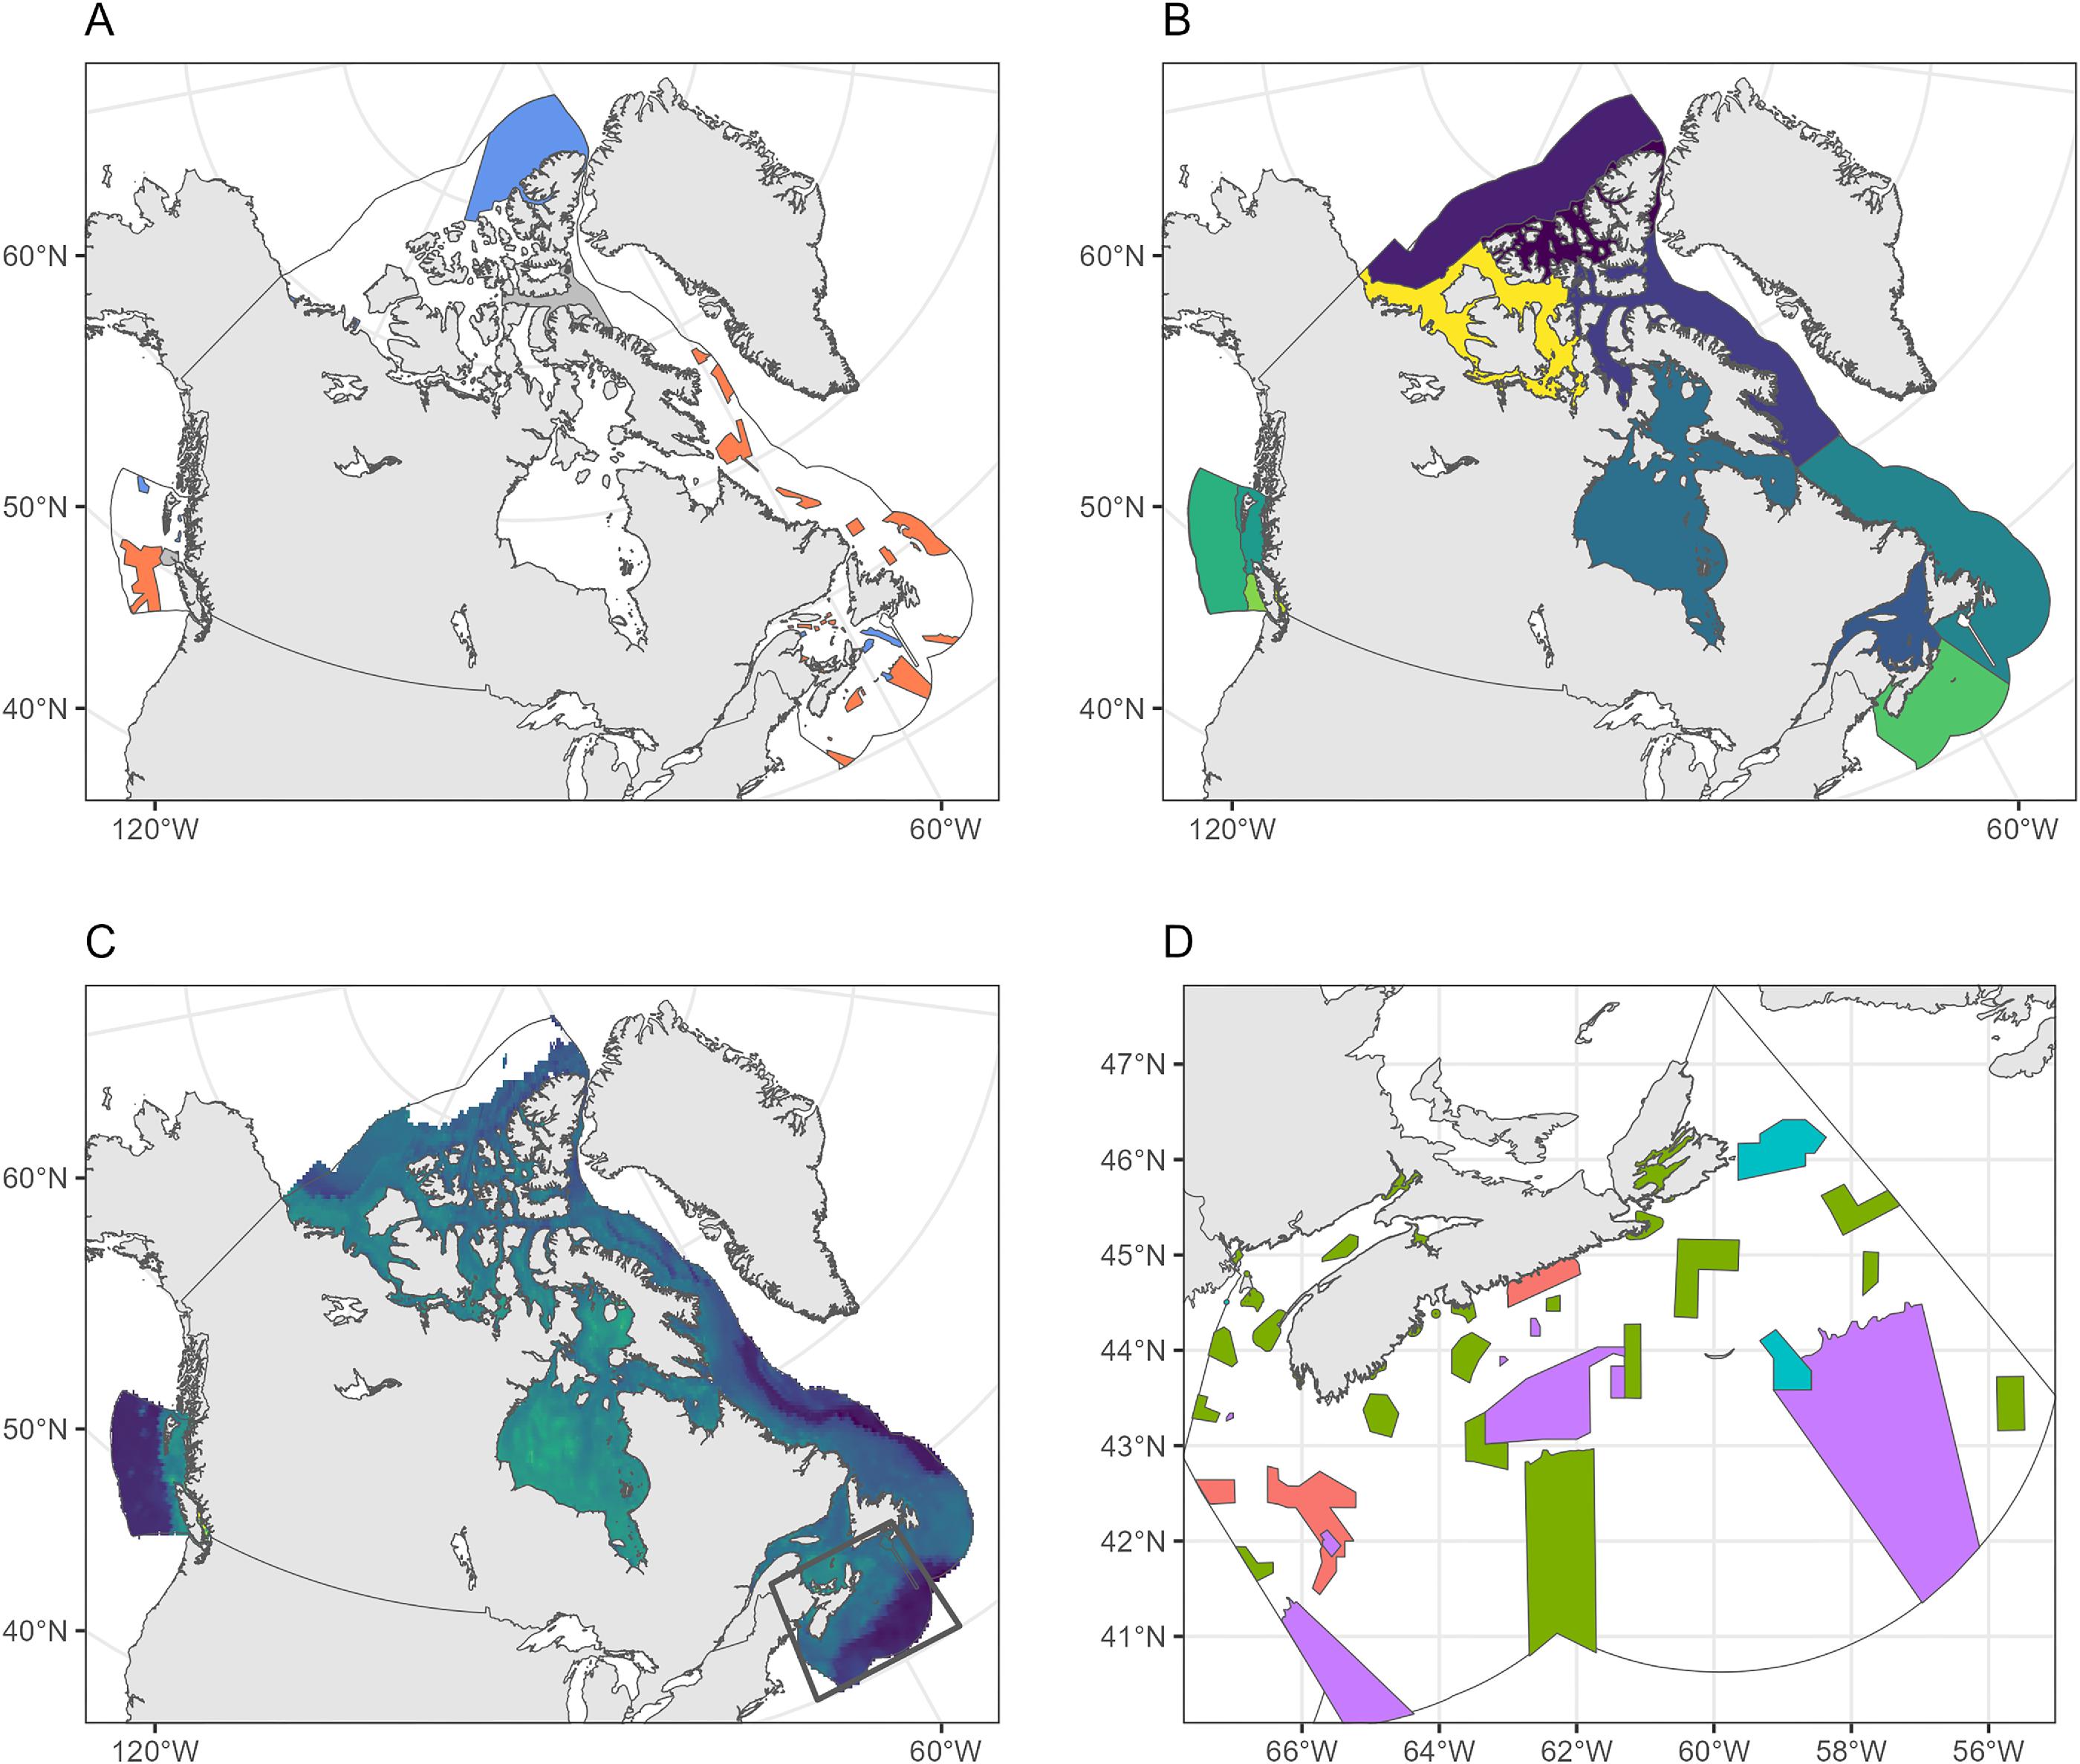
Fig. 2.
Methods
Data
Spatial- and species-specific climate change vulnerability scores for 2959 fish, invertebrate, and mammal species were obtained from a 0.25° resolution application of the CRIB across the Canadian EEZ (Boyce et al. 2024). These climate change vulnerability scores were based on 12 quantitative (and equally-scaled) sensitivity, adaptivity, and exposure indices, generalized for global applicability (Boyce et al. 2022; Fig. 2). Sensitivity indices gauged how reactive species are to climate impacts based on present day conditions. For example, species subjected to multiple stressors (e.g., overfishing, pollution), with a poor conservation status, living in locations where the climate is already close to their thermal limits, were considered more sensitive to climate change. Indices of adaptivity addressed the potential resilience of species to climate impacts. For instance, innate species characteristics such as being small (r-selected species with short generation times and high reproductive output) and inhabiting broader, more contiguous geographic distributions with higher temperature variability may allow species to adapt more quickly to environmental change. Exposure indices quantified the spatially-explicit magnitude and pace of warming projected to impact species and their surrounding ecological communities. Sensitivity, adaptivity, and exposure indices were averaged to obtain vulnerability scores between 0 and 1 for each species in each 0.25° grid cell throughout the Canadian EZZ (see Boyce et al. 2022 for details). The vulnerability scores of all species in each grid cell were then averaged to derive an ecosystem-level climate change vulnerability score for each cell (Fig. 2).
An ensemble of sea surface temperature (SST) projections (time series over the period 2015–2100) was obtained on a regular global 0.25° grid from 12 published Global Climate or Earth System Models within the coupled model intercomparison project phase 6 (CMIP6) archive (see Table S3 in Boyce et al. 2022). Projections were made under the IPCC’s shared socioeconomic pathway (SSP) scenarios SSP5-8.5, representing a global net expansion of fossil fuel use (hereafter “high emissions”), and SSP1-2.6, representing a global increase in sustainable development (hereafter “low emissions”). Modelled distributions were used to calculate several indices and situate the spatially explicit vulnerability results for each species based on SST. Species that do not live in the upper 100 m of the ocean, have a maximum depth tolerance of more than 1000 m, and/or have a preference of more than 600 m were excluded, as SST may not well-define the climate risk of these species. Sensitivity analyses were carried out to validate these thresholds (Fig. S42 in Boyce et al. 2022). Seabirds were excluded from the analysis because only a small part of their time is spent in surface waters. Species with primarily freshwater distributions (e.g., sturgeons, salmons, shads, and eels) were also excluded.
The boundaries of existing MPAs and OECMs were based on spatial polygons from the Canadian Network of Marine Conservation Areas Database (Government of Canada 2023; Fig. 2), which comprised the “CMCN” in this study. These areas comprise the Marine Conservation Targets and fall under various federal and provincial regulations (Bryndum-Buchholz et al. 2022). MPAs and OECMs within the CMCN were aggregated based on their location within ocean basins (i.e., Pacific, Arctic, and Atlantic) and biogeographic units (herein referred to as “bioregions”; Fig. 1B), nominally referred to as “bioregional networks.” Bioregions were delineated to represent a high-level spatial stratification of the Canadian marine territory, based on oceanographic and bathymetric similarities, nested within the Pacific, Arctic, and Atlantic Ocean basins included in the Canadian EEZ (DFO 2009) and are the scale at which regional conservation planning efforts generally take place.
We also evaluated the representativity of climate change vulnerabilities within a draft network of conservation areas planned for the Scotian Shelf-Bay of Fundy bioregion (DFO 2018). This draft network encompassed existing MPAs, OECMs, and proposed sites selected for future designation. These selections were based on their contributions to regional conservation objectives, which included representative protections for various conservation priorities, habitat types, and oceanographic features. They notably did not explicitly include any climate change- or climate resilience-based planning layers or objectives (DFO 2018).
Bathymetric data from the General Bathymetric Chart of the Oceans (GEBCO 2023) were binned into depth categories to explore relationships with climate vulnerability. These categories include bottom depths of 0–50 m for coastal areas, 50–100 m for the nearshore shelf, 100–250 m for the remaining continental shelf, 250–500 m for the shelf edge and upper continental slope (habitat for deep-water coral species), and 500–5200 m for the mid-slope into the deep ocean (to the abyssal plains).
Evaluation of representativity
The ecosystem-level climate change vulnerability scores from Boyce et al. (2024) (species vulnerability scores were averaged in each 0.25° grid cell) were formatted as geospatial rasters. Spatial intersections of the vulnerability- and depth-based rasters with polygons for the Canadian EEZ, ocean basins, bioregions, MPAs, and the Scotian Shelf-Bay of Fundy draft network were conducted using the “sf” package (Pebesma 2018) in R (Version 4.2.1—R Core Team 2022) to delineate grid cells within and outside of MPAs at each scale of analysis (national, ocean basin, bioregion). Intersections included partial overlaps; the vulnerability scores and depths of these partially overlapping grid cells were weighted in all subsequent analyses by the area of cell overlapping with the polygon. Data generated or analyzed during this study were tracked using GitHub and archived online (doi: 10.5281/zenodo.8136562).
We assessed representativity as the percent overlap between the frequency distribution of climate change vulnerabilities (weighted by the area of overlap, as described above) inside MPAs and the frequency distribution of climate change vulnerabilities throughout the geographic region in which the MPAs were situated, including oceans (n = 3) and bioregions (n = 9). Bioregional analyses were restricted to bioregions that contained at least one conservation area. To relate any gaps in coverage to depth distributions in MPAs, knowing that deeper areas, on average, are relatively less vulnerable to climate change (Boyce et al. 2022), we repeated distributional comparisons for climate change vulnerability stratified by depth category. These analyses focussed on providing high-level depictions of representativity at various spatial scales to identify gaps in climate vulnerability coverage (i.e., representivity) within the CMCN.
Results
Ocean basins
Marine ecosystems within the three ocean basins within the Canadian EEZ (Pacific, Arctic, and Atlantic) exhibited higher climate change vulnerabilities under the high emissions scenario (SSP5-8.5) than under the low emissions (SSP1-2.6) (Fig. 3). However, ocean basin-scale vulnerabilities in the Canadian EEZ were relatively low (ranging 0–0.6) when considering that vulnerability scores globally range from 0 to 1 (Boyce et al. 2022). The Arctic Ocean basin component exhibited the highest median vulnerability, at 0.41 and 0.37 for high and low emissions scenarios, respectively (ranging 0–0.55), followed by the Atlantic (0.37; 0.35; ranging 0–0.58) and Pacific (0.30; 0.27; ranging 0–0.6) basin components (Fig. 4).
Fig. 3.
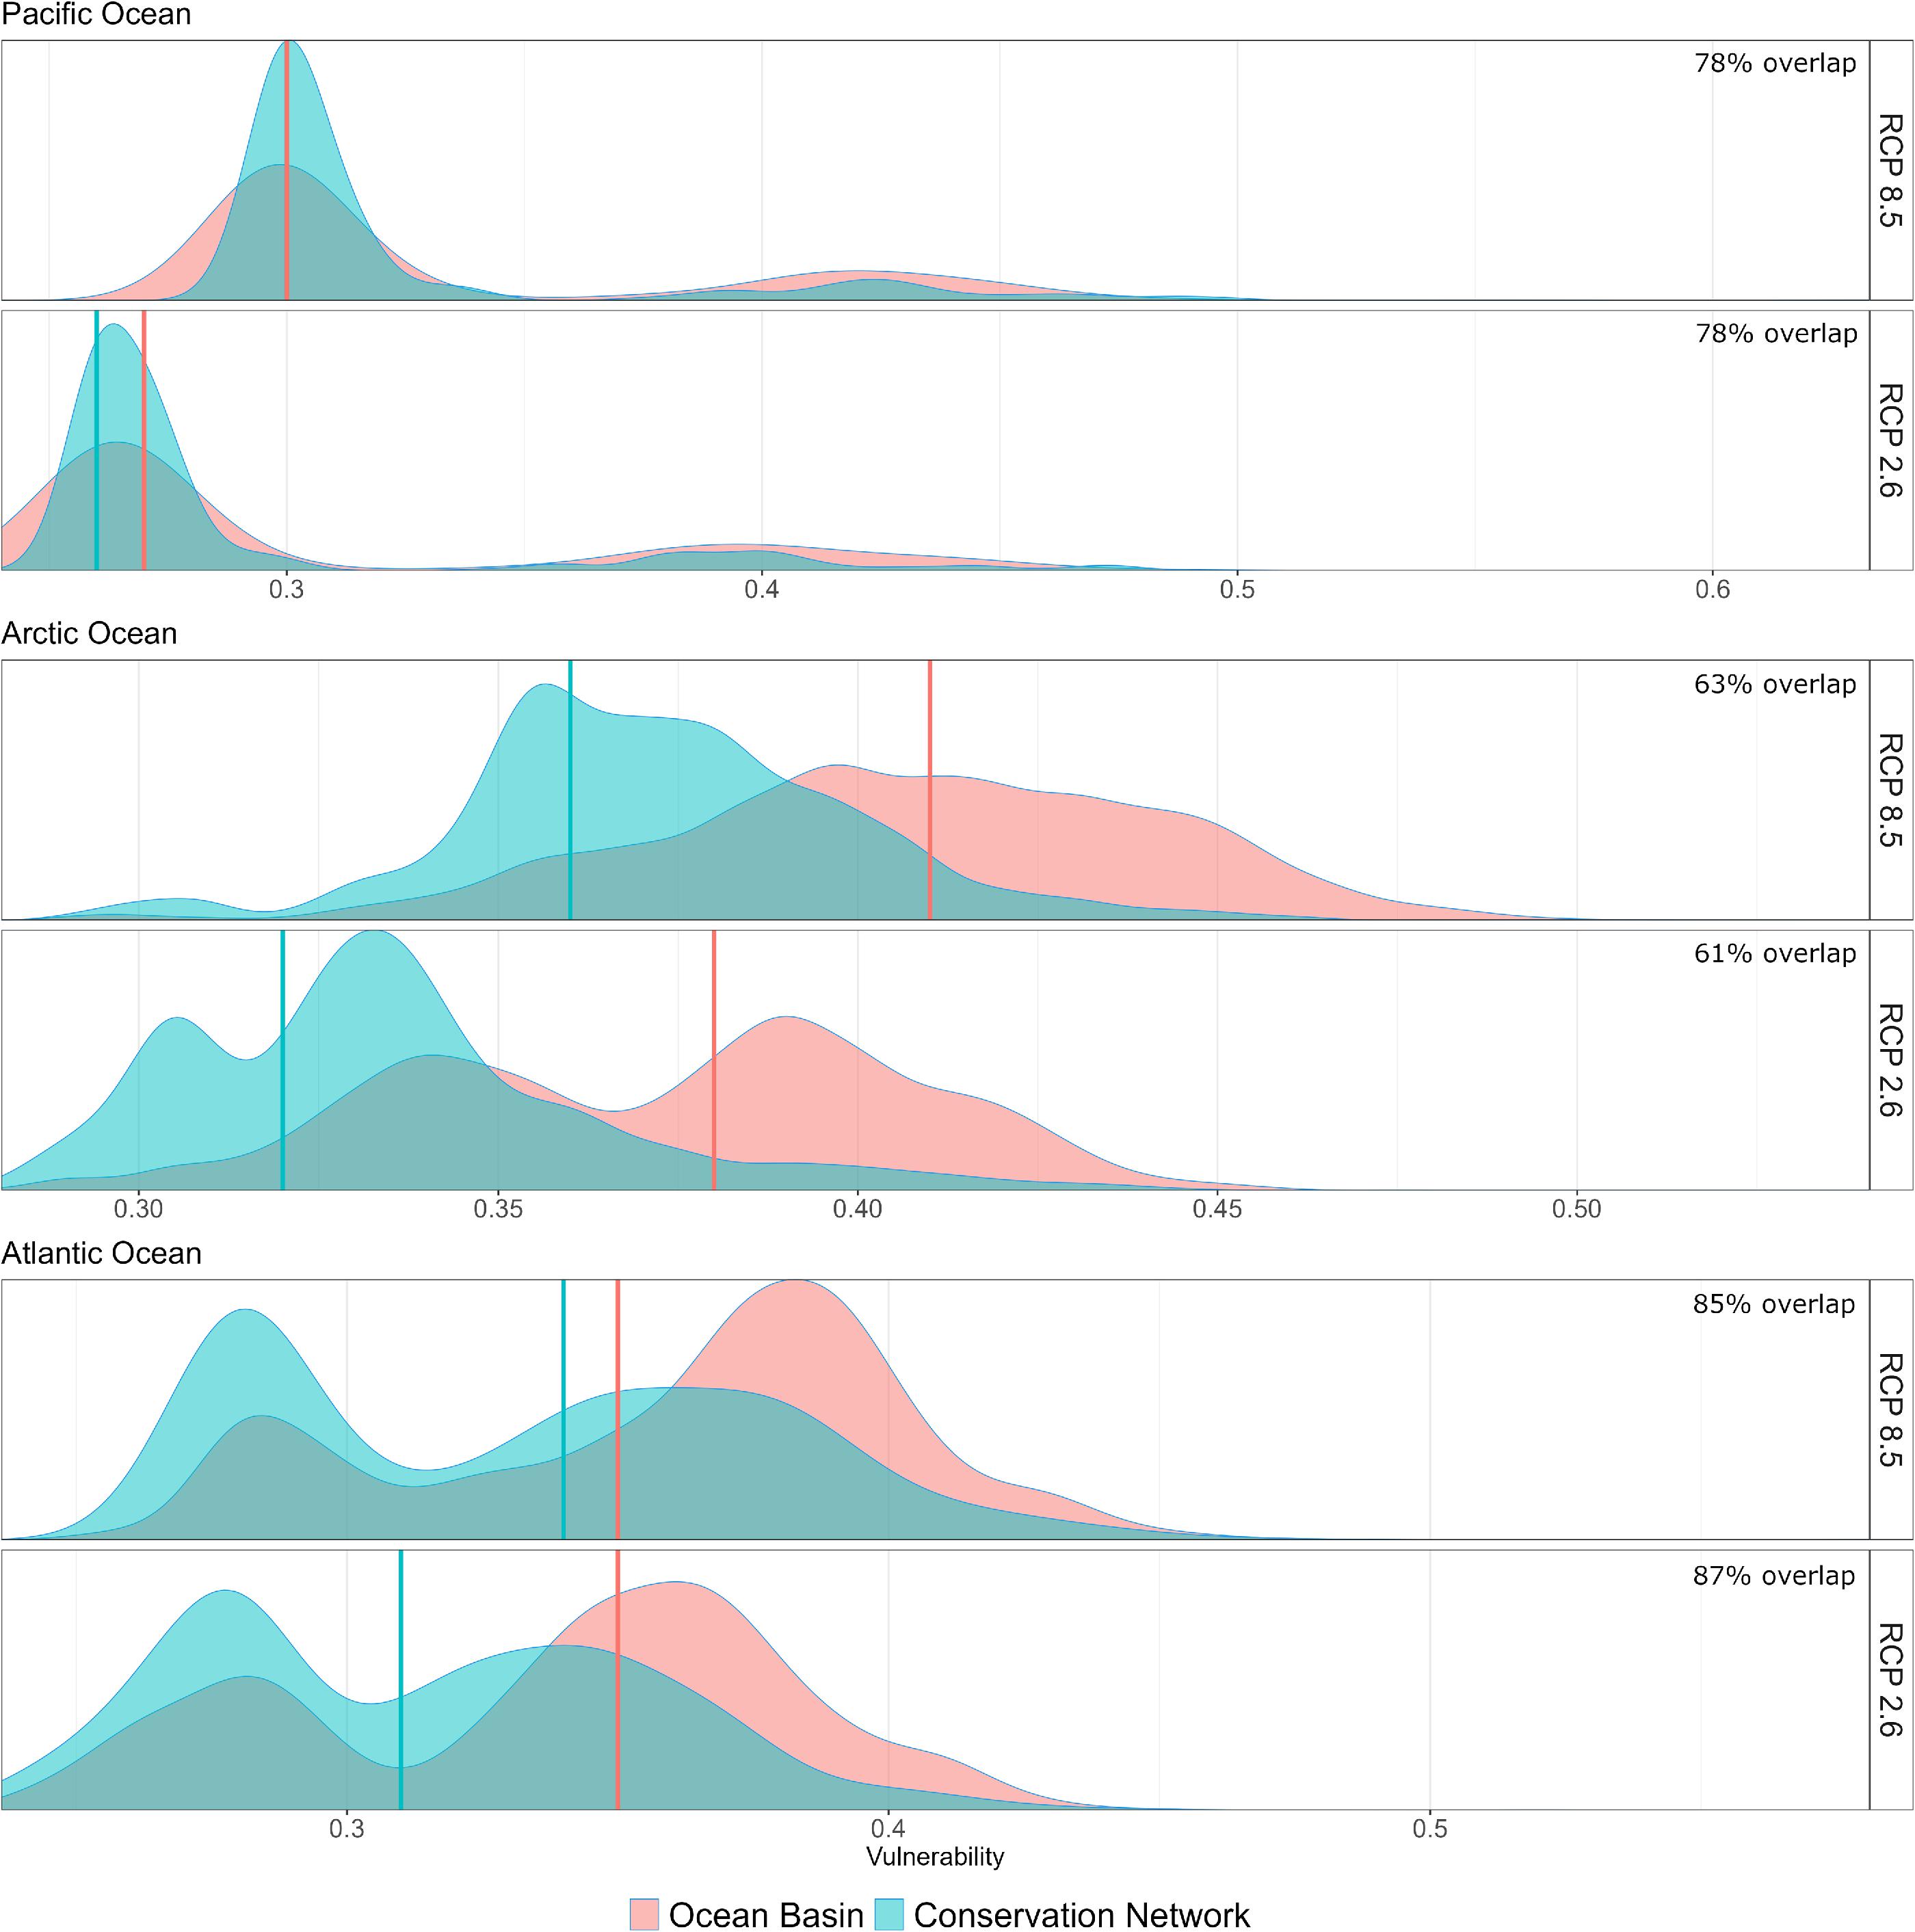
Fig. 4.
When evaluating representativity of climate change vulnerability in MPAs at the ocean basin scale, we found that MPAs tended to proportionally over-represent lower vulnerability areas under both emissions scenarios across all three ocean basins (Fig. 3). We found that vulnerability increased between low and high emissions scenarios both inside and outside MPAs. Notably, vulnerability increased more so inside of MPAs than outside, narrowing the gap between median vulnerability inside versus outside MPAs under the highest emissions scenario, particularly in the Pacific and Atlantic (Fig. 3). The degree to which climate change vulnerabilities inside MPAs were representative of vulnerabilities outside (i.e., the overlap of frequency distributions in Fig. 3) was lowest in the Arctic Ocean. In this context, the conservation network over-represented lower climate change vulnerabilities under both emissions scenarios, with vulnerability levels outside MPAs exceeding 0.5 under the high emissions scenario. Vulnerabilities inside MPAs represented 61% and 63% of vulnerabilities in the Arctic Ocean under low and high emissions scenarios, respectively. In the Pacific, representativity was 78% under both emissions scenarios, with median vulnerability scores being only slightly lower (0.37) inside MPAs compared to outside (0.41) under the highest emissions scenario (Fig. 3). We found that overall, representativity of climate change vulnerability was highest in Canadian MPAs of the Atlantic Ocean at 87% and 85% under low and high emissions scenarios, respectively.
Bioregions
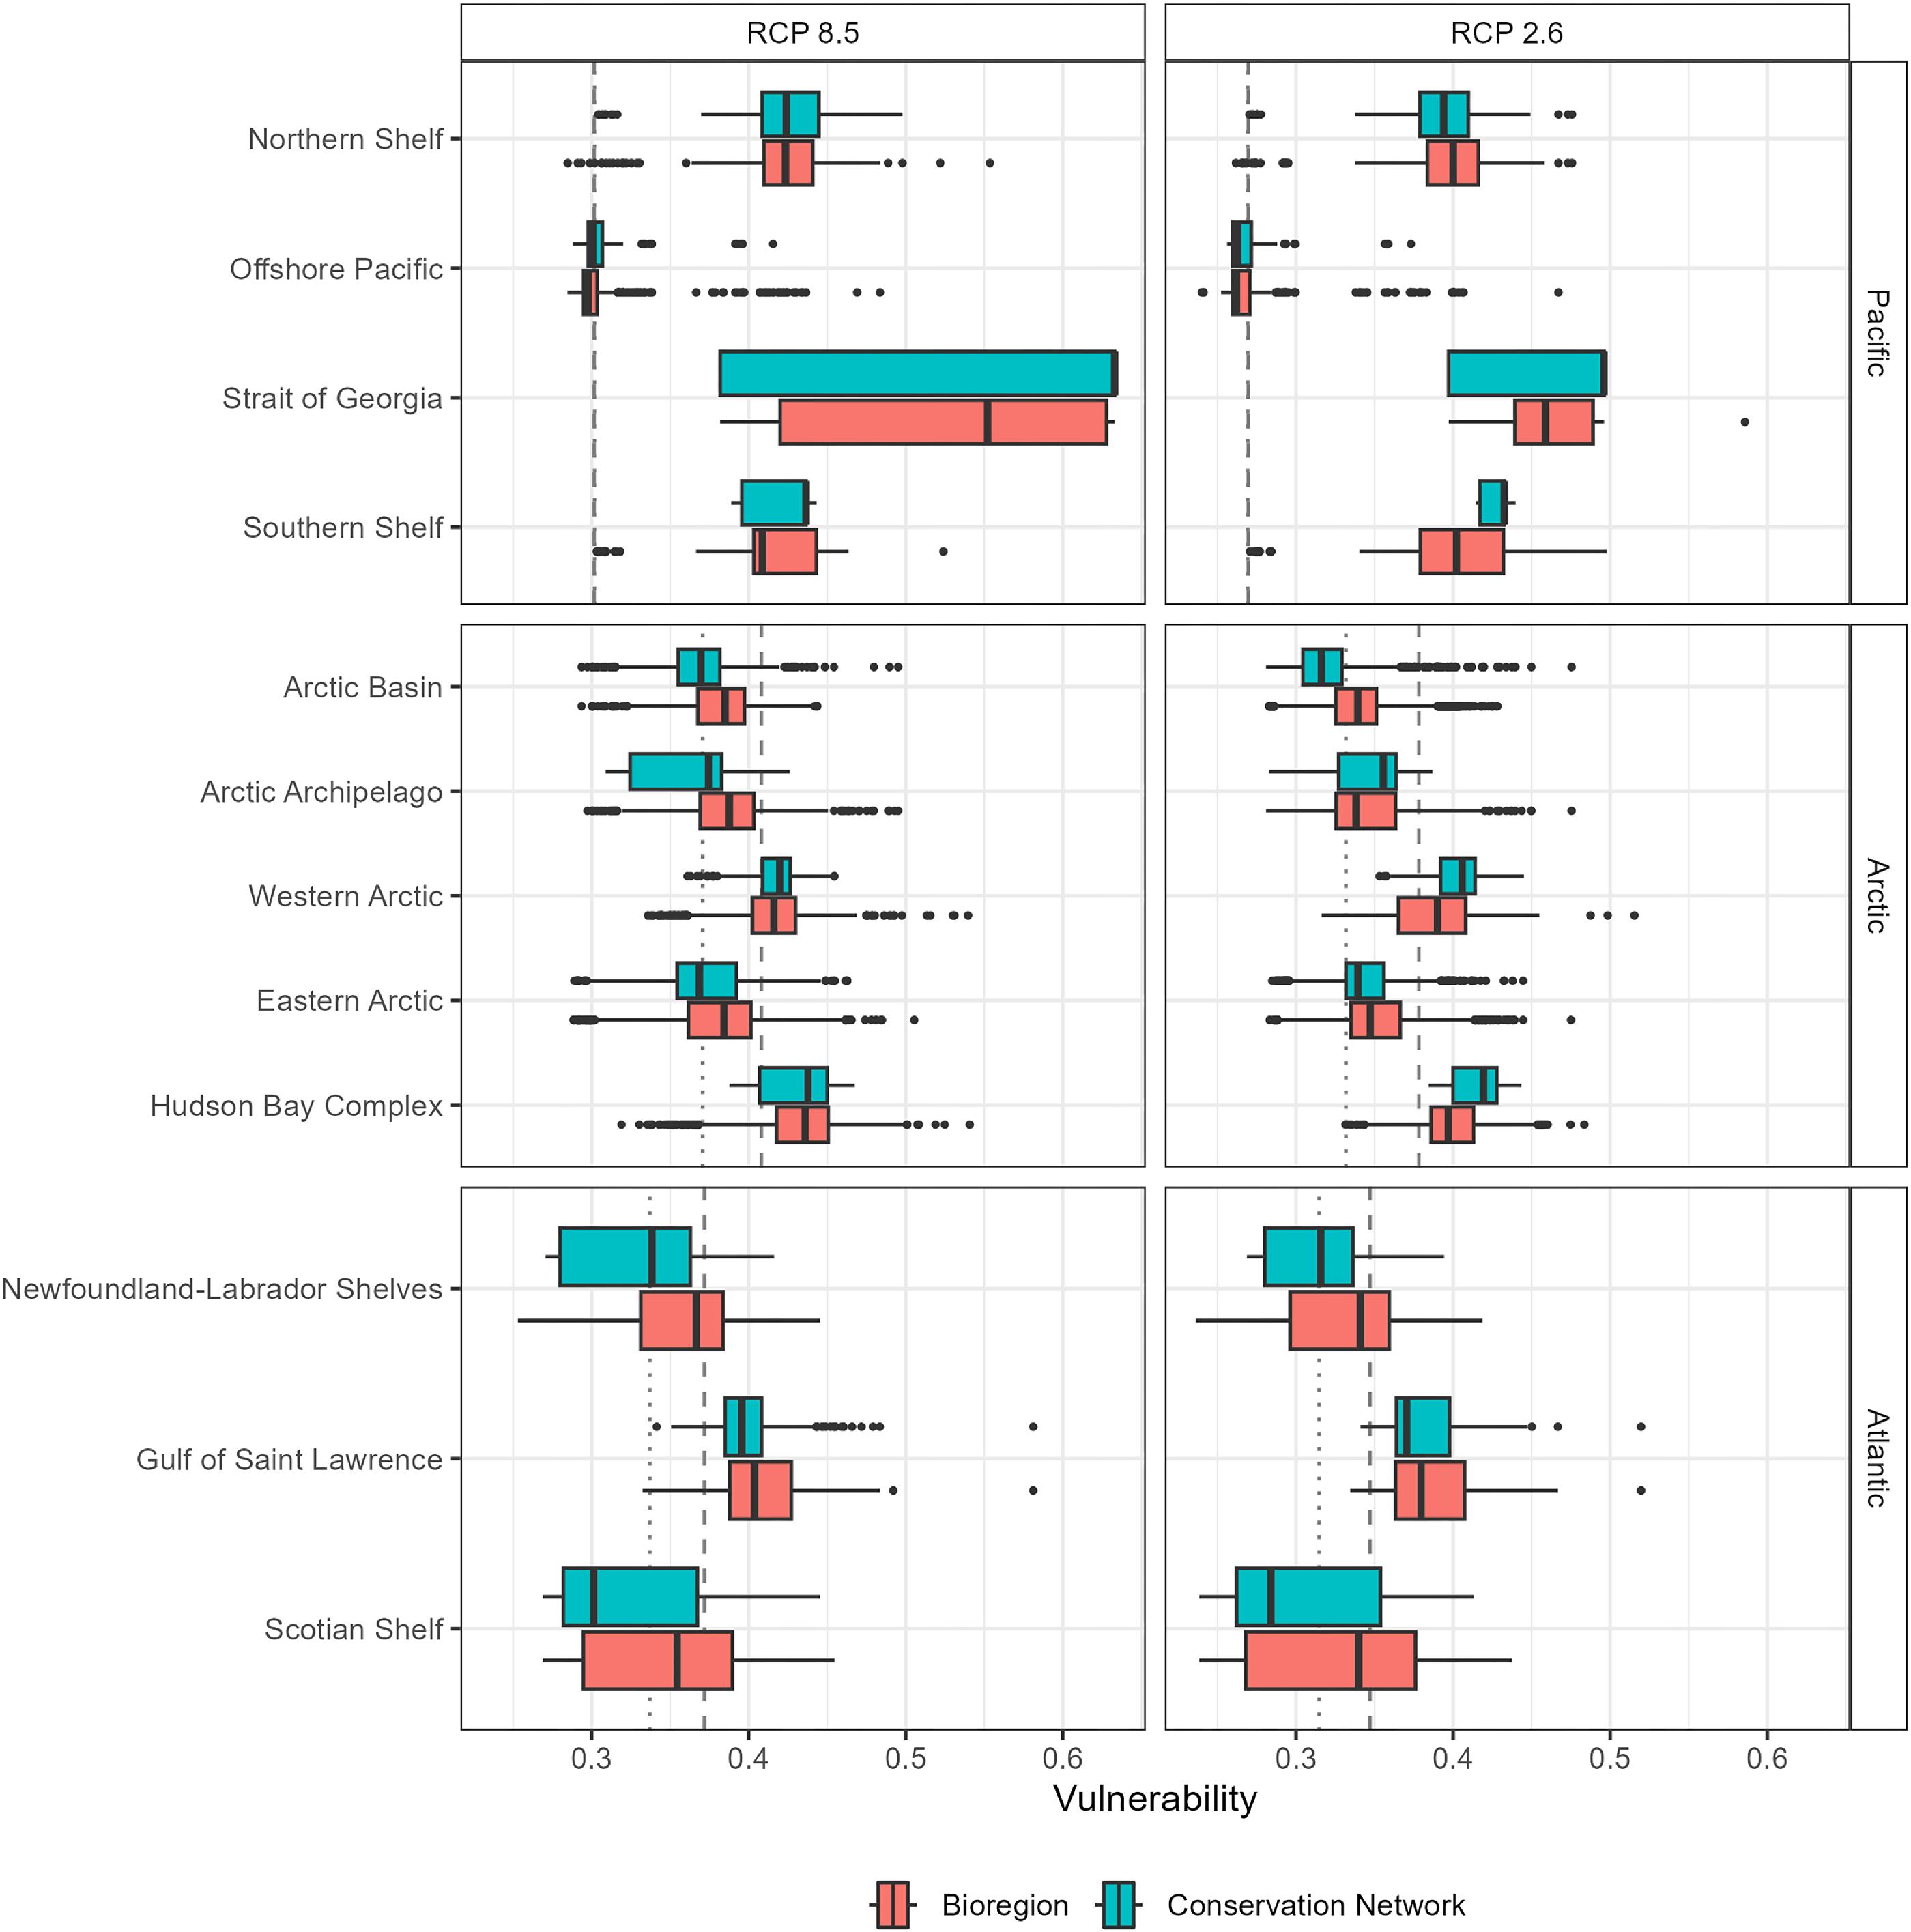
We observed consistently lower climate change vulnerability in Canadian bioregions relative to global levels (Boyce et al. 2022). The most vulnerable bioregions were the Strait of Georgia (median vulnerability = 0.52, under high emissions), followed by the Hudson Bay Complex (median vulnerability = 0.43 under high emissions) and the Northern Shelf/Western Arctic bioregions each with a median vulnerability of 0.42 under the high emissions (Fig. 4). While area-weighted median climate change vulnerabilities in the Strait of Georgia were moderate (0.4–0.5), many areas both inside and outside of MPAs contained elevated vulnerability (>0.6) under the high emissions scenario (Fig. 4), which would be considered high on the global scale. This bioregion experienced the most significant relative increase in ecosystem-level climate change vulnerabilities between low and high emissions scenarios, with a net increase of approximately 10% (Fig. 4). The Western Arctic, Hudson Bay Complex, Northern Shelf, and Gulf of Saint Lawrence bioregions contained several areas where climate change vulnerability was anomalously high, with scores exceeding 0.5 under the high emissions scenario, albeit these areas were less densely distributed than in the Strait of Georgia (Fig. 4).
The least vulnerable bioregions were the Offshore Pacific (median = 0.26 under the low emissions scenario) and the Scotian Shelf (median = 0.34 under low emissions; Fig. 4), both exhibiting climate change vulnerability scores ranging from 0.24–0.5, with only slight variation between emissions scenarios. Vulnerability scores in the Newfoundland-Labrador Shelves, Eastern Arctic, and Arctic Basin bioregions followed a similar trend, though with slightly higher area-weighted median vulnerabilities approximating 0.34–0.38 under both emissions scenarios.
Evaluating whether climate vulnerabilities within MPAs reflected those in surrounding areas at the bioregional scale (i.e., the degree of representativity of bioregional climate change vulnerability inside of MPAs) revealed more spatial variability than our evaluation at the broader ocean basin scale implied. Under both emissions scenarios, MPAs in 7 of the 12 bioregions were representative of over 75% of the ecosystem-level climate change vulnerability in the bioregion overall (Fig. 5A). Across all bioregions, representativity of climate change vulnerability inside MPAs (hereafter referred to as “climate representativity” or simply “representativity”) varied between 42% and 92% (Fig. 5A). The conservation network with lowest climate representativity was in the Southern Shelf bioregion (42%) under the low emission scenario. The conservation networks with highest climate representativity were in the Gulf of St. Lawrence (∼91%), Northern Shelf (90%), Eastern Arctic (∼88%), and Scotian Shelf (85%) bioregions (Fig. 5). All bioregions, except for the Southern Shelf and Arctic Archipelago (under low and high emissions scenarios, respectively), had conservation networks representative of over 65% of the climate change vulnerabilities of the bioregion under both emissions scenarios.
Fig. 5.

For half of the bioregions, climate representativity inside MPAs was lower under the high emissions scenarios relative to the low emissions scenario, but representativity increased under the higher emission scenario for the other half (Fig. 5B). This contrast was most evident in the Arctic Archipelago, where representativity inside MPAs was reduced by 26%, and in the Southern Shelf bioregion, where representativity was increased by 37% under the high emissions scenario relative to the low emissions scenario. Only the Arctic Archipelago and Offshore Pacific bioregions had reduced climate representativity from low to high emissions scenarios by more than 2%. In contrast, the Arctic Basin, Strait of Georgia, Western Arctic, Hudson Bay Complex, and Scotian Shelf bioregions had increases in representativity between 8% and 37% (Fig. 5B).
In general, lower climate representativity corresponded to an overrepresentation of ecosystem-level climate change vulnerability at the lower end of the distribution. Across all bioregions, conservation networks exhibited equal or lower median vulnerability compared to the entire bioregion under both emissions scenarios. However, exceptions were observed in the Hudson Bay Complex, the Western Arctic, and the Strait of Georgia, where vulnerability was higher inside than outside MPAs under the low emissions scenario (Fig. 4).
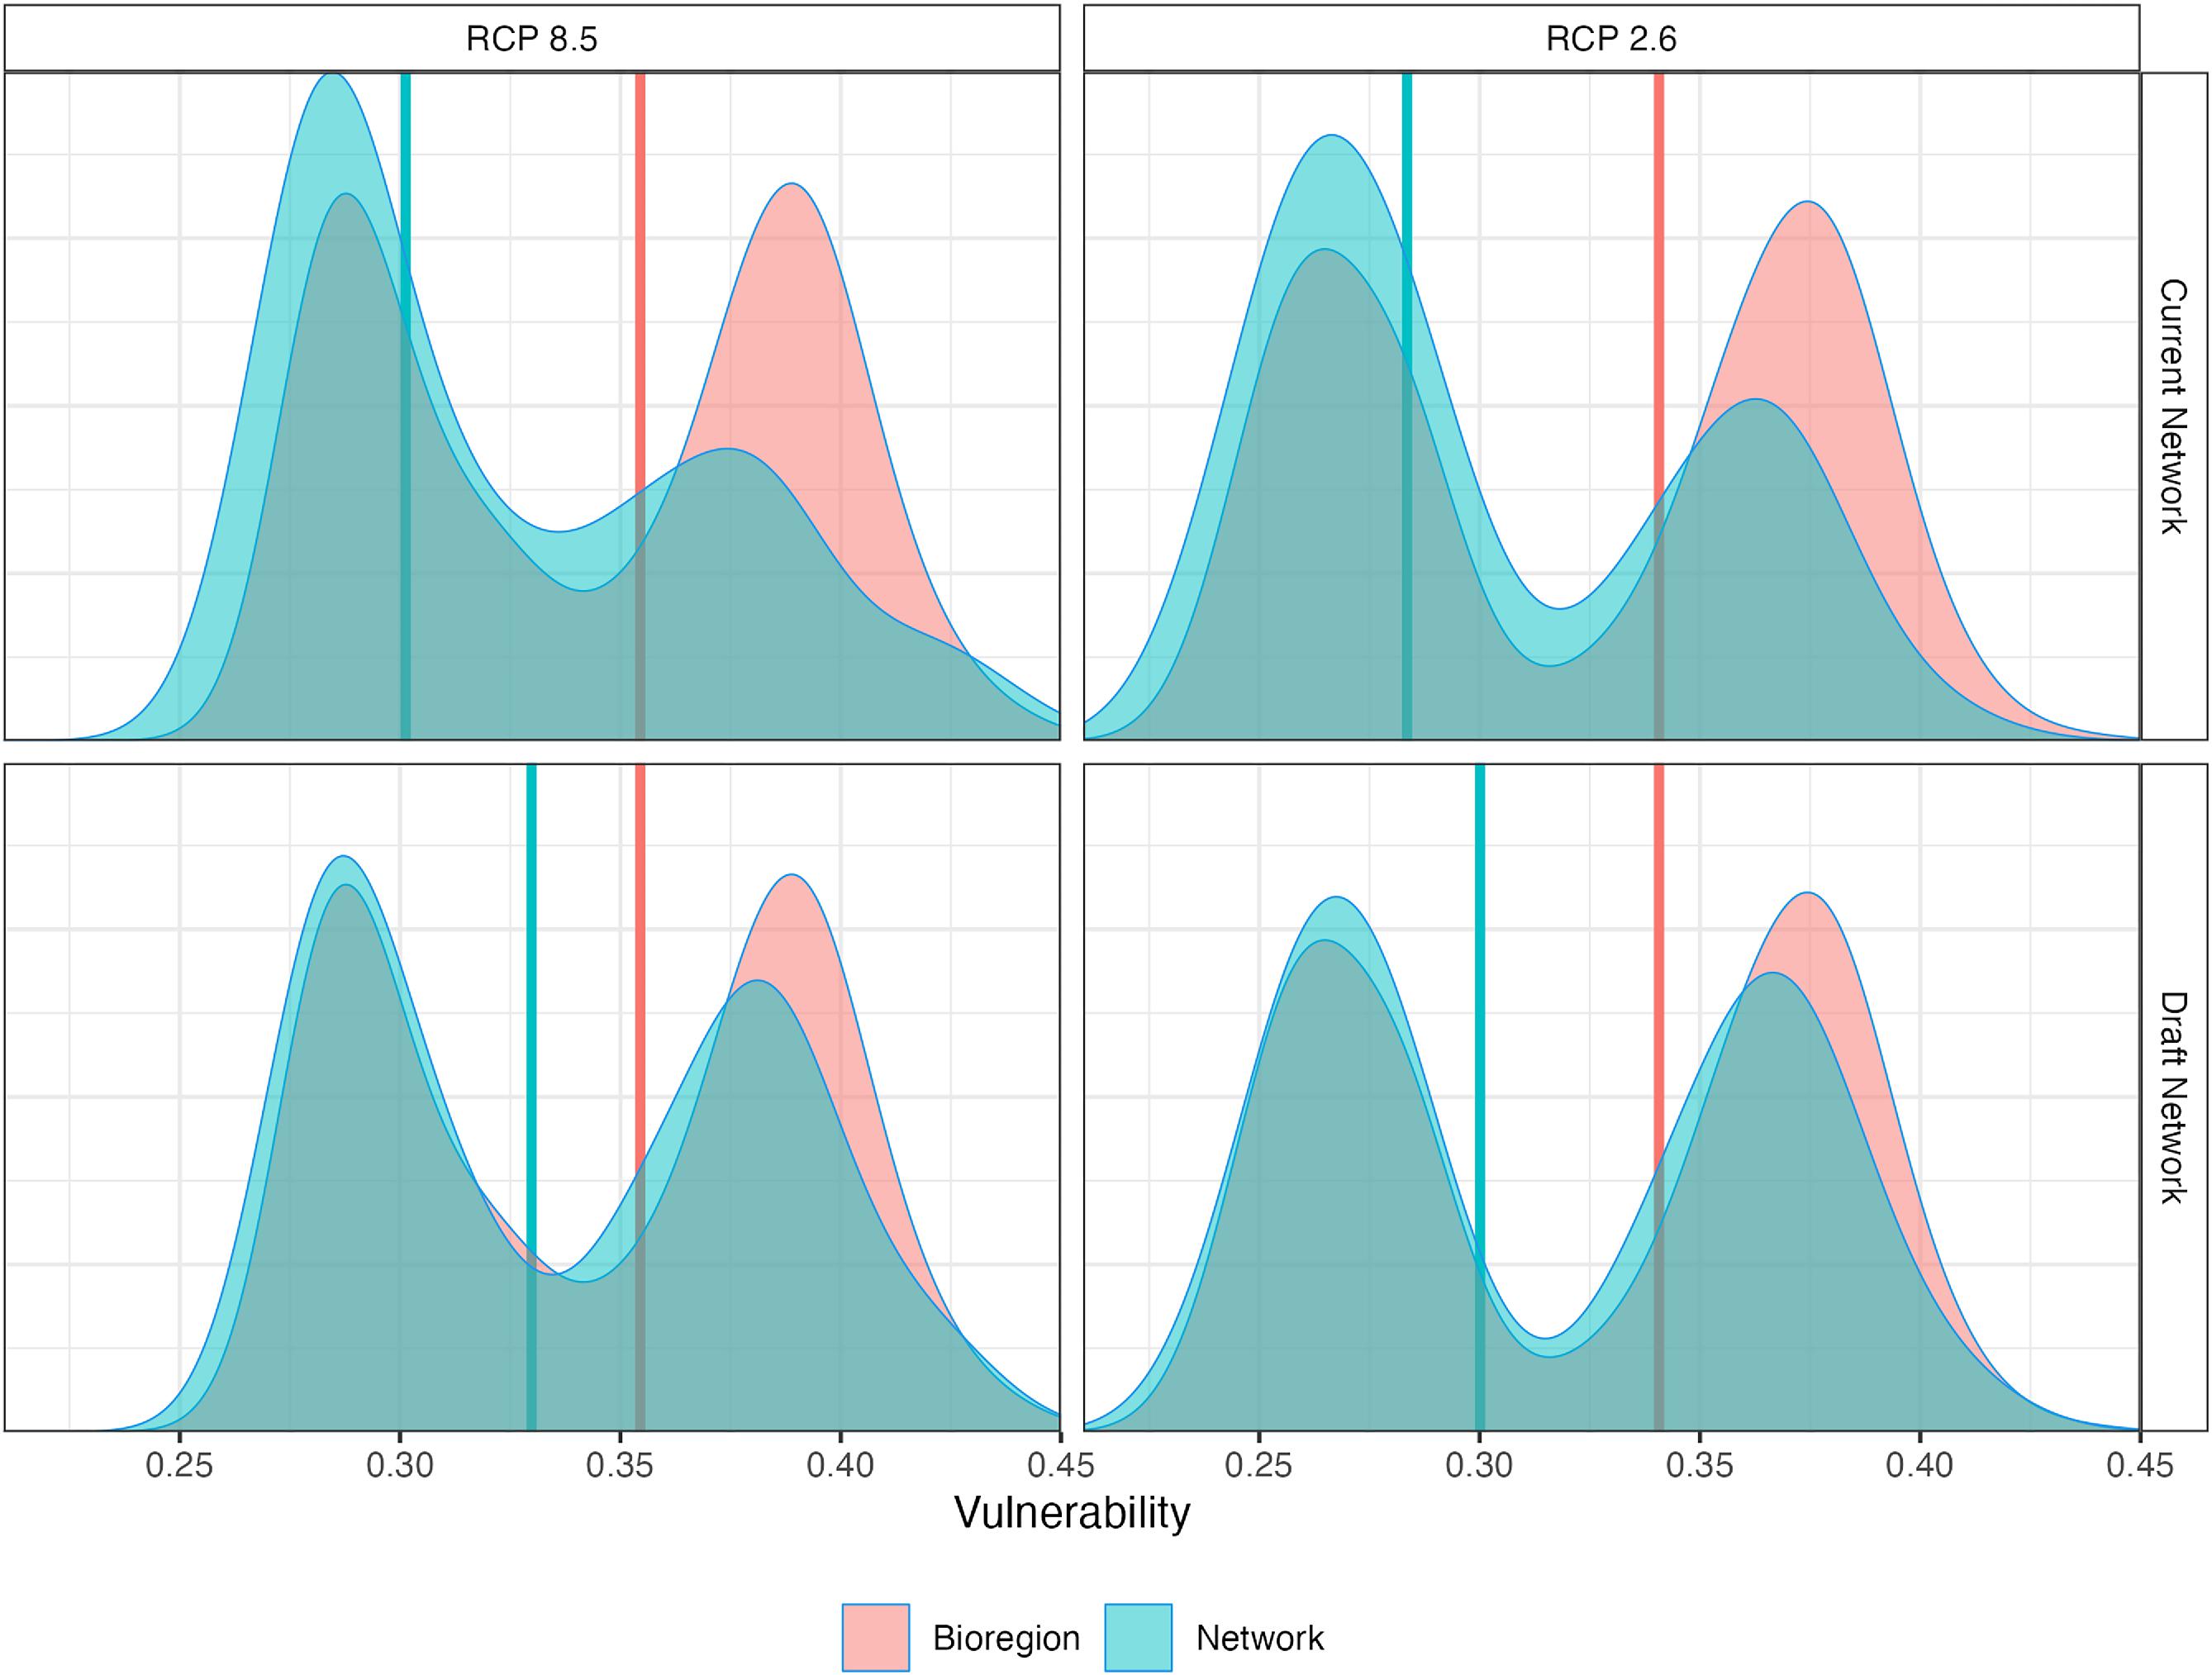
Scotian Shelf-Bay of Fundy
We compared the existing Scotian Shelf-Bay of Fundy conservation network, comprising designated MPAs or OECMs, to a bioregional draft network (Fig. 1D). We aimed to evaluate whether regional geographic and ecological representativity targets, such as spatial stratification between coastal, shelf, and deep-water areas, would yield a design configuration representative of projected climate change vulnerabilities for the region. Ecosystem-level climate change vulnerabilities were distributed between 0.25 and 0.45 within the current and draft networks, with minimal variation across emission scenarios (Fig. 6). The existing MPAs in the Scotian Shelf-Bay of Fundy bioregion were highly climate representative (85%–86%). Including additional draft network sites designed to improve habitat representativity also increased climate representativity across the conservation network to 94%–96%. This improvement primarily stemmed from the expanded coverage of shelf and coastal areas, which increased coverage of vulnerabilities >0.35 (Fig. 6).
Fig. 6.
The role of depth in climate-resilient MPA planning
Over the entire study area, MPAs, which typically protect everything from the water’s surface to the sea floor within their boundaries, were generally situated in deeper waters. We found that >50% of the CMCN was located where bottom depths were over 500 m (Fig. 7A). Areas with intermediate and shallow bottom depths (i.e., depth categories 0–50 m, 50–100 m, and 100–250 m), where surface and bottom warming is more rapid, and where human activities such as fishing are most pronounced, were underrepresented overall in the conservation networks across all ocean basins (Fig. 7B). This pattern was most apparent in the Arctic and Atlantic, where bottom depths between 500 and 5200 m were disproportionately overrepresented by ∼30% in the conservation network (Fig. 7B). A similar trend was also observed for the Pacific, where areas with bottom depths ranging between 500 and 5200 m were overrepresented in MPAs by just under 20% (Fig. 7B).
Fig. 7.
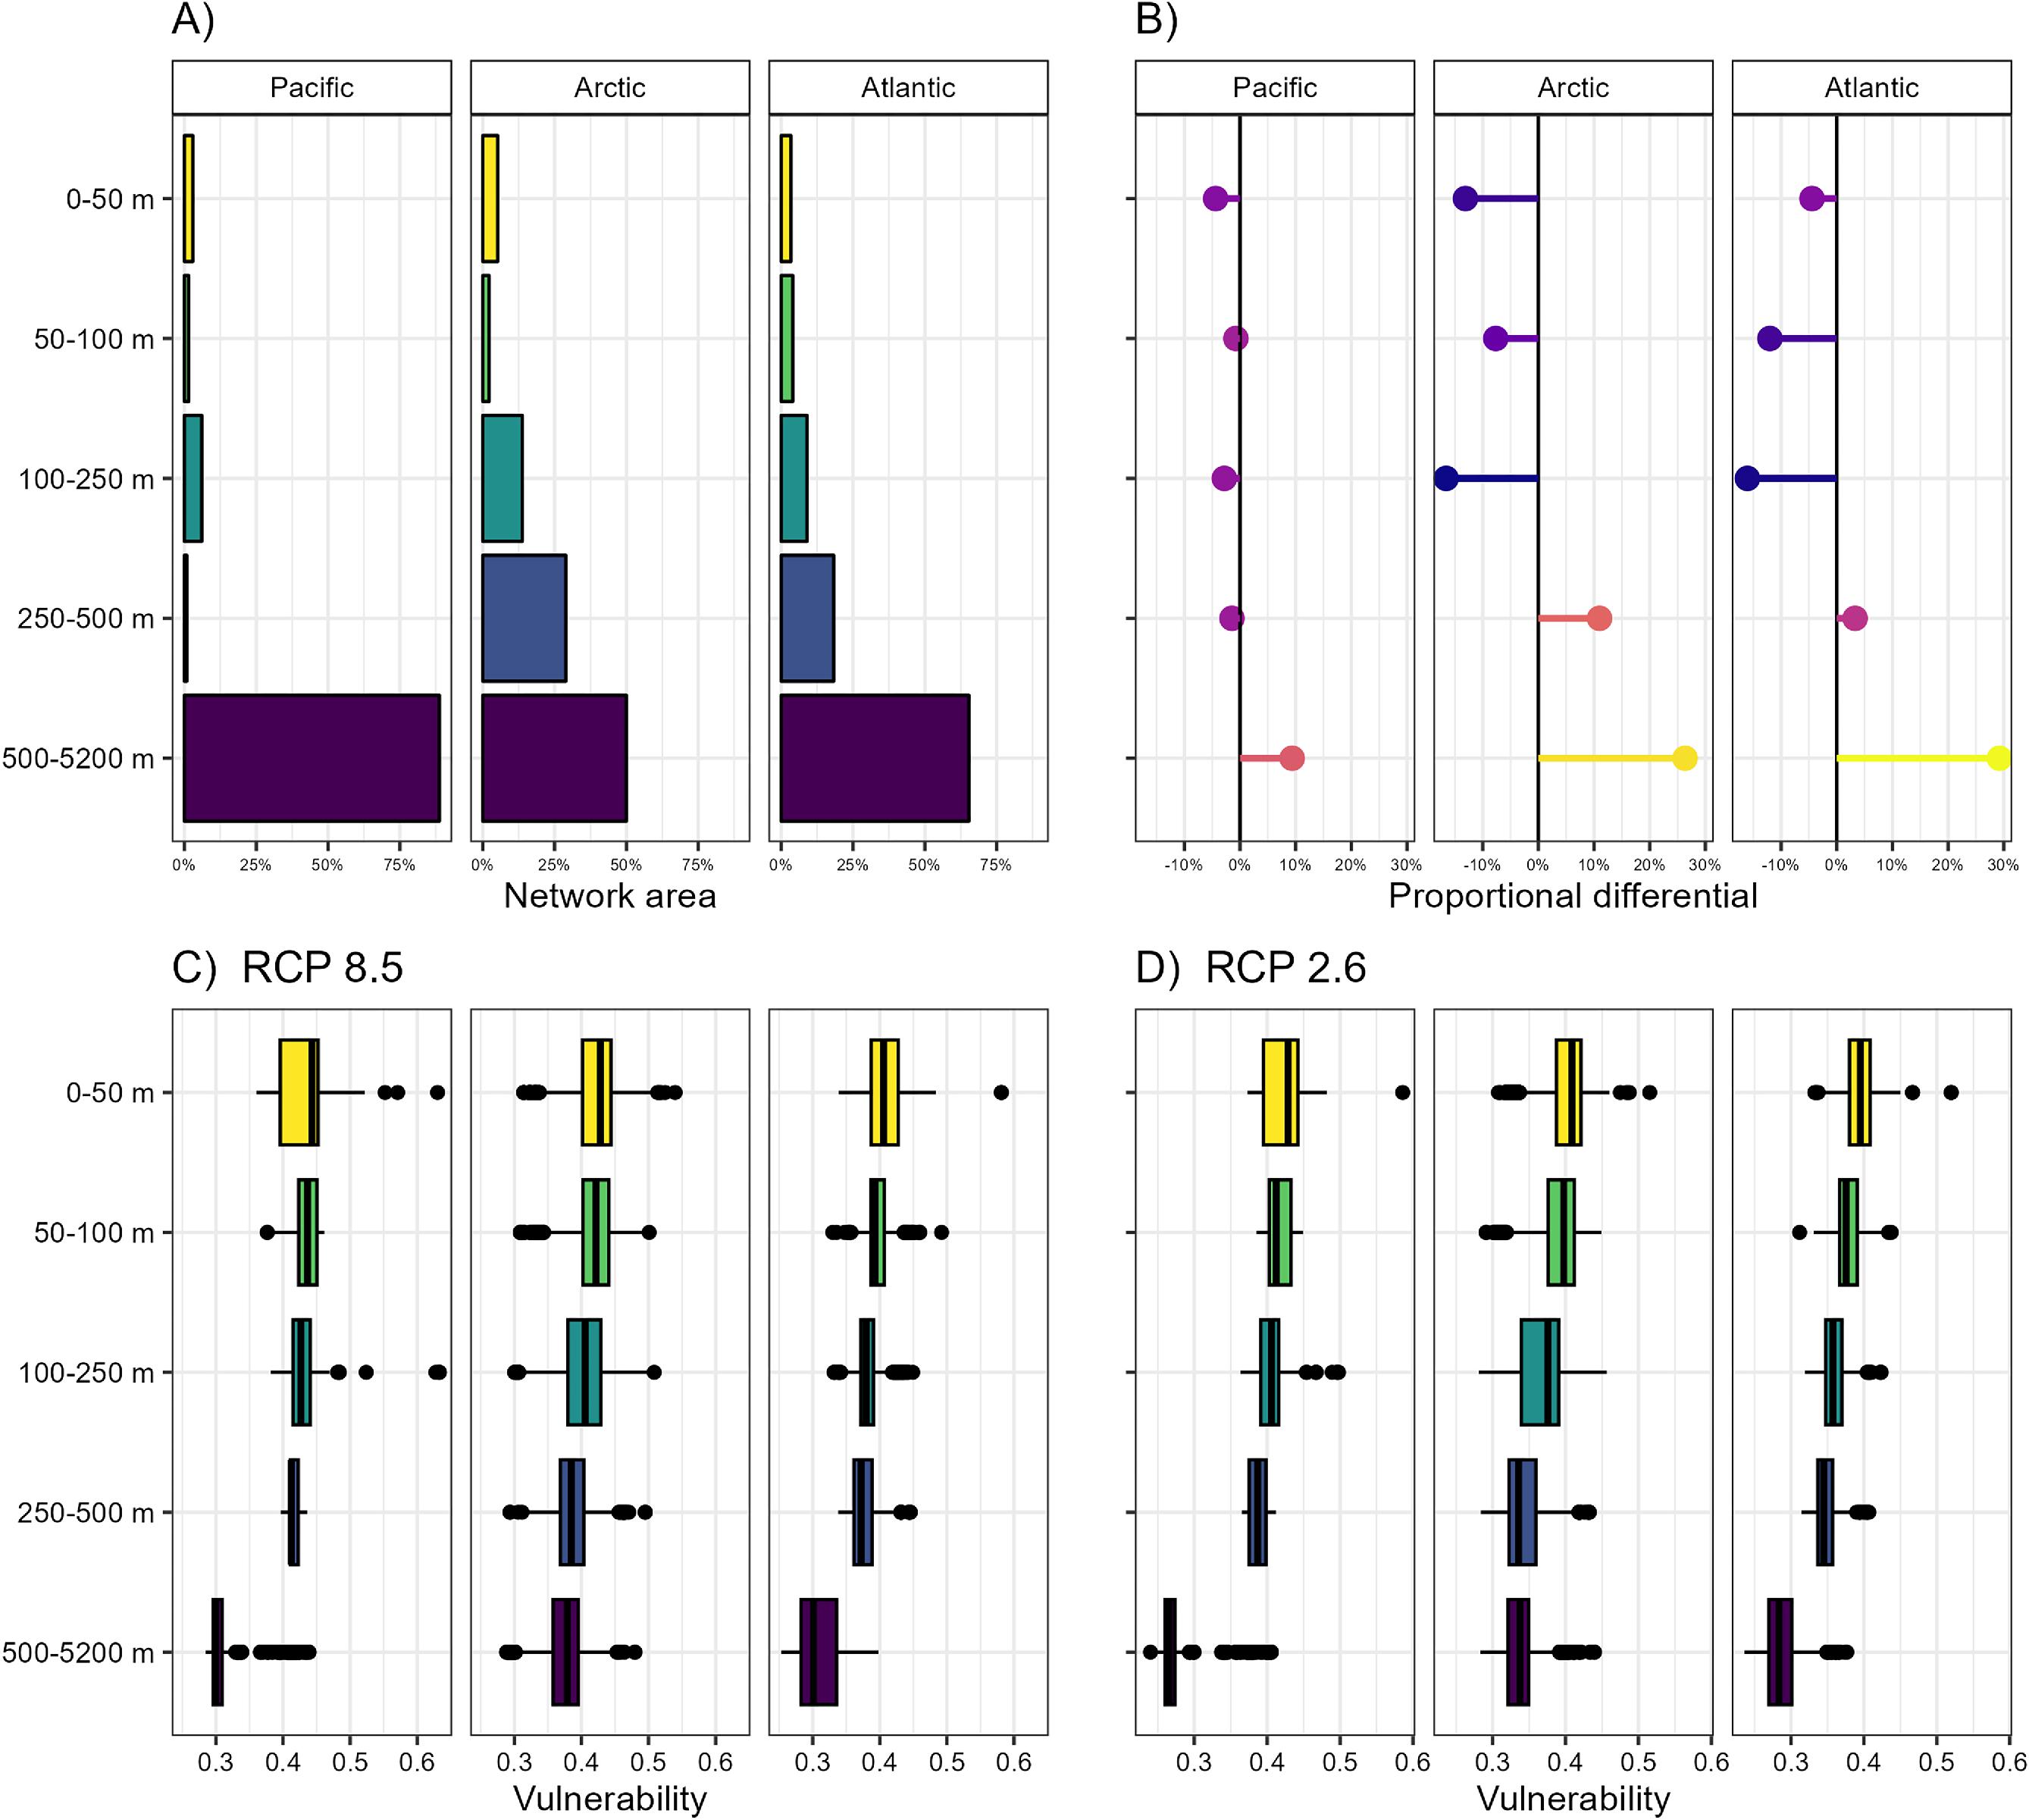
Climate vulnerability showed a consistent negative association with depth: areas with bottom depths falling within the deepest depth category exhibited the lowest median vulnerabilities (e.g., 0.30 for high emissions in the Pacific) under both emissions scenarios (Figs. 7C and 7D). Areas with shallower bottom depths, which were generally underrepresented, had higher median vulnerabilities. For example, under the high emissions scenario in the Arctic Ocean, areas in the 0–50 m depth category had a median vulnerability score of 0.43, while areas in the 250–500 m depth category had a median vulnerability of 0.39.
Discussion
Our results indicated that the Canadian EEZ, throughout the Pacific, Arctic, and Atlantic Oceans, exhibited generally low climate change vulnerability (<0.5) compared to the global picture, where it ranges from 0 to 1 (Boyce et al. 2022). A notable exception to this was the Strait of Georgia, where vulnerability in some areas approached 0.64 under the high emissions scenario (Fig. 4). However, in all cases, average climate change vulnerability inside and outside of MPAs increased under the high emissions scenario, suggesting that the magnitude of climate change vulnerability in Canadian marine ecosystems is tied to the extent of emissions mitigations implemented globally.
While climate change represents a pervasive global threat, it is not the sole challenge facing marine ecosystems, which also face an expanding array of stressors that can cumulatively alter and erode their function over time (Côté et al. 2016). Fishing pressure and the cascading influence of changing species biomass have led to significant shifts in ecosystem structure (Pedersen et al. 2017) and regime shifts in Atlantic Canada (Frank et al. 2005; Petrie et al. 2009; Shackell et al. 2010; Frank et al. 2011; Pedersen et al. 2020) and elsewhere (e.g., Ellingsen et al. 2020). Conservation efforts are crucial in managing the impacts of ecosystem stressors. Establishing conservation measures with high protection (e.g., Grorud-Colvert et al. 2021) can yield tangible benefits for adaptation and mitigation, potentially enhancing natural carbon sequestration and bolstering ecosystem resilience to disturbances such as climate change (Jacquemont et al. 2022).
One strategy to support ecosystem resilience in a regional planning area is to ensure representative protections across a broad spectrum of habitat types, oceanographic features, and species assemblages. Representativity is a design feature advised by the Convention on Biological Diversity (CBD 2010) and adopted by nations worldwide (Balbar and Metaxas 2019), including Canada (Government of Canada 2011). With a changing climate, representativity takes another dimension, where biodiversity protection achieved using spatial conservation measures becomes a moving target. When appropriately distributed, scaled, and protected, conservation networks have the potential to support transient ecological states as conditions continue to change in a fashion akin to terrestrial protected area “corridors” for shifting distributions and species turnover (Rice and Houston 2011; Fredston-Hermann et al. 2018). In this sense, ensuring the resilience of spatial conservation measures involves representing a broad spectrum of climate vulnerabilities, safeguarding not only slow-changing areas (or “climate refugia”) but also those undergoing more rapid changes. This strategy “hedges” against uncertainty in ecosystems' responses to climate change, increasing the likelihood that spatial conservation measures aimed at maintaining biodiversity will remain effective even as conditions change (Queirós et al. 2016; Fredston-Hermann et al. 2018). Additionally, it protects emerging ecosystems, some of which may become highly productive and diverse (Queirós et al. 2016; Queirós et al. 2021). As Canada advances its Marine Conservation Targets and fulfills the objective of designing ecologically comprehensive, resilient, and representative conservation networks, it is crucial to consider how ecosystems are likely to change to ensure that spatial conservation measures are robust to anticipated change (Bryndum-Buchholz et al. 2022).
High climate representativity (>75%) in all but one (Arctic Archipelago) of the 12 bioregions indicates that the distribution of MPAs in the CMCN proportionally represents most of the modelled climate change vulnerability, even when emissions scenarios are uncertain. However, there was some variation among bioregions and between emissions scenarios. Under the high emission scenario, climate change vulnerability was higher (Fig. 4) and representativity of bioregional climate change vulnerability inside of MPAs was improved relative to the low emissions scenario throughout the Western Arctic, Hudson Bay Complex, Southern Shelf, Arctic Basin, Strait of Georgia, and Newfoundland-Labrador Shelves bioregions, (Fig. 5A). Given the correspondingly high vulnerability scores of these bioregions relative to others in the EEZ, this improved representativity under increased warming could be indicative of broad homogenization of habitats (e.g., a transition to ice-free habitats). This could foreshadow the immigration of new assemblages seeking highly altered, warmer areas (e.g., Cheung et al. 2011; Alabia et al. 2020). However, with representativity levels still below 80%, there remains potential to improve the representation of higher vulnerability areas.
Conversely, climate representativity of bioregional climate change vulnerabilities inside MPAs was substantially reduced under the higher emissions scenario in the Arctic Archipelago, Eastern Arctic, and Offshore Pacific bioregions (Fig. 5A). In these bioregions, rates of environmental change have been shown to vary between different habitat types. For instance, in the Eastern Arctic, sea ice has been melting less rapidly than in other areas in the Arctic Ocean (Post et al. 2013). In the Offshore Pacific, complex oceanography and proximity to an ocean warming hotspot have led to predictions of rapid and spatially variable ecological change (e.g., Okey et al. 2014). In the Arctic Archipelago, the complex geomorphology of the bioregion's constituent oceanic islands may contribute to variable responses to climate change. This variability could account for the observed trend of decreasing representativity under the high emissions scenario, whereby changes are more pronounced and heterogeneous than other bioregions. Bioregional differences in ecosystem response to warming highlight the complexity of conservation planning in a changing climate. Nonetheless, by understanding these differences, conservation planning exercises can help make informed decisions and identify areas that may require adaptive management strategies.
Where gaps existed in climate representation, it was often because the placement of MPAs was skewed towards areas with lower vulnerability relative to the rest of the bioregion in question (Figs. 3 and 4). This is a common theme in marine conservation, where conservation planners prioritize both biological and human-use objectives, thus avoiding areas of high human usage to limit socio-economic costs/trade-offs (e.g., DFO 2018). These high-human-use areas, such as fishing grounds, are typically closer to shore (Halpern et al. 2008), where waters are shallower and often more influenced by atmospheric warming (IPCC 2018; Albouy et al. 2020). Gaps in coverage of high vulnerability areas suggest that the representativity of regional biodiversity could decrease over time, particularly in nearshore environments, as novel assemblages and ecosystems emerge with a changing climate. Increasing the designation of MPAs in higher-vulnerability areas could address this representativity gap, helping to ensure that the conservation of biodiversity in networks is more resilient to change (Cheung et al. 2009; Bryndum-Buchholz et al. 2019; Descamps and Strom 2021). This approach could also contribute to distributing protection from other stressors, such as fishing and fossil fuel drilling, and support areas poised to become more productive. Indeed, it has been predicted that bioregions in the Arctic Ocean, some of which had lower levels of climate representativity (e.g., Arctic Basin and the Arctic Archipelago, Fig. 5A), will experience the most significant transformation of species assemblages of the entire global ocean, with a large magnitude of new species moving into this area, high turnover of ecosystem structure (Alabia et al. 2020; Florko et al. 2021; IPCC 2023), and increasing primary productivity (e.g., Wassmann 2011), potentially leading to an increase in catch potential of many existing and incoming commercial species (IPCC 2018; Tia et al. 2019).
Reflecting the widely observed tendency toward the biased designation of MPAs in low-vulnerability areas and the low representativity of conservation areas in traditionally high-use coastal areas, MPAs were disproportionately designated in deeper waters across all three ocean basins, particularly in the Pacific (Fig. 7). While this has led to climate representativity gaps throughout the EEZ, it also highlights a representativity gap for shallow-water coastal and continental shelf habitats, and their associated species assemblages and ecosystem functions.
Coastal shallow-water habitats, such as eelgrass (Zostera marina) and kelp (Laminarian spp.) beds, play crucial ecological and economic roles by supporting keystone species and providing essential ecosystem services like carbon sequestration and coastal protection (Lilley and Unsworth 2014; Röhr et al. 2018; Infantes et al. 2022). These areas are also hotspots for commercial fishing and thus face cumulative stressors that reduce their resilience to environmental changes (Halpern et al. 2008; Sharples et al. 2013; Beauchesne et al. 2020). In contrast, deep-sea habitats host slow-growing, late-maturing species like octocorals and stony corals, which are highly sensitive to disturbance from fishing activities and emerging threats such as deep-sea mining (Gollner et al. 2017; Beazley et al. 2021; Paulus 2021). As fishing efforts expand into deeper waters, concerns mount over increased impacts on these ecosystems, underscoring the need for comprehensive protections to sustain their fragile biodiversity and ecosystem functions.
Given the varying ecological functions and vulnerabilities of shallow and deep-water ecosystems to climate change, it is essential to prioritize balanced protection across both. This study underscores the need to increase protections, particularly in shallow-water coastal areas. Prioritizing representativity across different depths, habitats, and climate change vulnerabilities within the CMCN can enhance biodiversity protections and promote ecological stability amid environmental changes (McLeod et al. 2009; Pettersen et al. 2022).
Our analysis of a draft conservation network proposed for the Scotian Shelf-Bay of Fundy Bioregion supports this approach. Prioritizing representativity of habitats (including depths and sediments), oceanographic features (e.g., temperature regimes), and geography (i.e., targets stratified for the Eastern and Western Scotian Shelf) in the conservation planning process (DFO 2018) resulted in balanced protection of regional diversity and high climate representativity in the bioregion (Fig. 6). This study strongly advocates for maintaining representativity as a cornerstone in conservation planning efforts as Canada progresses towards its conservation targets, ensuring the long-term resilience of biodiversity in marine ecosystems, whether embodied by present day or future/emerging ecological communities (Queirós et al. 2016, 2021).
Caveats
While integrating climate change considerations into conservation planning is crucial (Tittensor et al. 2019; Bryndum-Buchholz et al. 2022), it is essential to acknowledge the inherent uncertainty associated with available tools and data products. Predictions from global ocean climate models may introduce uncertainty at the local scale, potentially leading to over- or under-representation of species-specific vulnerability scores in certain areas. However, general ocean-scale patterns, such as the poleward movement of isotherms, and ecosystem-level vulnerabilities can provide insight into broader trends expected in a warming ocean. Moreover, considering the median conservation area size of ∼100 km2 in the CMCN, the resolution of the CMIP oceanographic models used in this study and by Boyce et al. (2022) are likely sufficient to resolve expected gradients of change within planning regions and MPAs in Canada.
Further, while broad-scale physical ocean models predicting future thermal conditions are more readily available (e.g., the CMIP model family), they may not adequately capture other environmental conditions such as oxygen concentration and pH level. Consequently, climate vulnerabilities may be underestimated, particularly those related to oxygen reduction in deep areas (e.g., Beauchesne et al. 2020; Ross et al. 2020). This can lead to further habitat losses and prevent species from migrating deeper to avoid warming surface waters (Stortini et al. 2017; Thompson et al. 2023). Additionally, the CRIB does not account for potential shifts in interspecific interactions (e.g., predation shifts Zabihi-Seissan et al. 2024) that could result in higher ecosystem-level vulnerabilities.
Recognizing the potential underestimation of climate vulnerabilities, taking a precautionary approach is crucial, ensuring that networks offer adequate protection and are broadly representative to support long-term resilience. While a representative approach to conservation planning is recommended based on our results, this is only one dimension of effective, climate-resilient network design. Conservation planning and design principles must also consider spacing between MPAs, population connectivity (Beger et al. 2022), and fisheries management objectives (Fovargue et al. 2018).
Notwithstanding these limitations, this study used models, projections, and data to assess Canada’s MCNs based on the best available decision-support tools. Importantly, inferences drawn from this work provide a needed initial foundation on which to start the conversation regarding building climate resilience into Canada’s national marine conservation network.
Conclusion
This study provides tangible guidance for Canadian marine conservation practitioners to incorporate climate resilience into conservation planning as the country strives to protect 30% of its EEZ by 2023. Our analyses reveal that Canada’s marine conservation areas offer, for the most part, balanced representation of potential climate change impacts. However, to ensure the representativeness and long-term resilience of the growing CMCN, prioritizing biogeographic representativity, specifically more balanced protection for vulnerable coastal and shelf regions, will be essential as Canada works towards its conservation targets. Utilizing the vulnerability information provided through this study can also inform the site design process, whereby sites with higher vulnerability could be designed with stronger protective measures to enhance resilience to change.
The generalized analytical approach presented through this study can also be applied elsewhere, given the global scale of Boyce et al. (2022) risk index methods and results. Prioritizing the representativity of habitats, oceanographic features, depth categories, and ground-truth where possible with the representativity of climate change vulnerabilities will support global efforts to preserve our oceans’ biodiversity and the critical services they provide.
Acknowledgements
We would like to thank Fisheries and Oceans Canada (DFO) for partially funding this work and members of the DFO Maritimes Region Conservation Network Technical Working Group for input on climate change resilience priorities for the Scotian Shelf-Bay of Fundy marine conservation network.
References
Alabia I., Molinos J., Saitoh S., Hirata T., Hirawake T., Mueter F. 2020. Multiple facets of marine biodiversity in the Pacific Arctic under future climate. Science of the Total Environment, 744:140913.
Albouy C., Delattre V., Donati G., Frölicher T., Albouy-Boyer S., Rufino M., et al. 2020. Global vulnerability of marine mammals to global warming. Scientific Reports, 10(1):.
Arafeh-Dalmau N., Brito-Morales I., Schoeman D., Possingham H., Klein C., Richardson A. 2021. Incorporating climate velocity into the design of climate-smart networks of marine protected areas. Methods in Ecology and Evolution, 12(10): 1969–1983.
Balbar A.C., Metaxas A. 2019. The current application of ecological connectivity in the design of marine protected areas. Global Ecology and Conservation, 17: e00569. Available from http://www.sciencedirect.com/science/article/pii/S2351989418304347.
Bates A., Cooke R., Duncan M., Edgar G., Bruno J., Benedetti-Cecchi L., et al. 2019. Climate resilience in marine protected areas and the 'Protection Paradox'. Biological Conservation, 236: 305–314.
Beauchesne D., Daigle R., Vissault S., Gravel D., Bastien A., Bélanger S., et al. 2020. Characterizing exposure to and sharing knowledge of drivers of environmental change in the St. Lawrence system in Canada. Frontiers in Marine Science, 7.
Beazley L., Kenchington E., Korabik M., Fenton D., King M. 2021. Other effective area-based conservation measure promotes recovery in a cold-water coral reef. Global Ecology and Conservation, 26.
Beger M., Metaxas A., Balbar A., McGowan J., Daigle R., Kuempel C., et al. 2022. Demystifying ecological connectivity for actionable spatial conservation planning. Trends in Ecology & Evolution, 37(12): 1079–1091.
Boyce D., Lotze H., Tittensor D., Carozza D., Worm B. 2020. Future ocean biomass losses may widen socioeconomic equity gaps. Nature Communications, 11(1):.
Boyce D.G., Shackell N., Greenan B. 2024. A climate risk index for marine life across the Canadian exclusive economic zone. Can. Tech. Rep. Fish. Aquat. Sci.3568: iv + 40p.
Boyce D.G., Tittensor D.P., Garilao C., Henson S., Kaschner K., Kesner-Reyes K., et al. 2022. A climate risk index for marine line. Nature Climate Change, 12: 854–862.
Bryce K., Hunter K.L. 2024. Enhancing climate change planning and adaptive management in marine protected areas through targets, thresholds, and social-ecological objectives. Frontiers in Marine Science, 11: 1339871.
Bryndum-Buchholz A., Boerder K., Stanley R.R.E., Hurley I., Boyce D.G., Dunmall K.M., et al. 2022. A climate-resilient marine conservation network for Canada. FACETS, 7: 571–590.
Bryndum-Buchholz A., Tittensor D., Blanchard J., Cheung W., Coll M., Galbraith E., et al. 2019. Twenty-first-century climate change impacts on marine animal biomass and ecosystem structure across ocean basins. Global Change Biology, 25(2): 459–472.
CBD 2010. Decisions adopted by The Conference Of The Parties To The Convention On Biological Diversity At its tenth meeting. In CoB Diversity (ed.). Available from https://www.cbd.int/doc/decisions/cop-10/full/cop-10-dec-en.pdf.
Cheung W., Lam V., Sarmiento J., Kearney K., Watson R., Pauly D. 2009. Projecting global marine biodiversity impacts under climate change scenarios. Fish and Fisheries, 10(3): 235–251.
Cheung W.W.L., Zeller D., Pauly D. 2011. Projected species shifts due to climate change in the Canadian Marine Ecoregions Report to Environment Canada: 46pp.
Côté I., Darling E., Brown C. 2016. Interactions among ecosystem stressors and their importance in conservation. Proceedings of the Royal Society B-Biological Sciences, 283(1824).
Descamps S., Strom H. 2021. As the Arctic becomes boreal: ongoing shifts in a high-Arctic seabird community. Ecology, 102(11):.
DFO. 2009. Development of a framework and principles for the biogeographic classification of Canadian marine areas. Canadian science Advisory Secretariat Advisory Report, 2009/056: 17pp.
DFO 2010. Spotlight on marine protected areas in Canada. In FaO Canada(ed.). Fisheries and Oceans Canada.
DFO 2014. Marine protected area Network Strategy for the Estuary and Gulf of St. Lawrence bioregion. In FaO Canada(ed.).
DFO. 2018. Design strategies for a network of marine protected areas in the Scotian Shelf bioregion. DFO Canadian Science Advisory Secretariat Science Advisory Report, 2018/006.
DFO 2023. Marine protected areas (MPA) protection standard. In FaO Canada(ed.). Available from https://www.dfo-mpo.gc.ca/oceans/mpa-zpm/-standard-norme-protection-eng.html
Ellingsen K., Yoccoz N., Tveraa T., Frank K., Johannesen E., Anderson M., et al. 2020. The rise of a marine generalist predator and the fall of beta diversity. Global Change Biology, 26(5): 2897–2907.
Faille G., Laurian C., McQuinn I., Roy V., Galbraith P., Savenkoff C. 2019. Review of the indicators and recommendations for an Ecological Monitoring Plan for the Banc-des-Américains Marine Protected Area. Canadian Science Advisory Secretariat Research Document, 2019/065: v + 53p.
Fawzy S., Osman A., Doran J., Rooney D. 2020. Strategies for mitigation of climate change: a review. Environmental Chemistry Letters, 18(6): 2069–2094.
Florko K., Tai T., Cheung W., Ferguson S., Sumaila U., Yurkowski D., et al. 2021. Predicting how climate change threatens the prey base of Arctic marine predators. Ecology Letters, 24(12): 2563–2575.
Foden W., Young B., Akçakaya H., Garcia R., Hoffmann A., Stein B., et al. 2019. Climate change vulnerability assessment of species. Wiley Interdisciplinary Reviews-Climate Change, 10(1).
Fovargue R., Bode M., Armsworth P. 2018. Size and spacing rules can balance conservation and fishery management objectives for marine protected areas. Journal of Applied Ecology, 55(3): 1050–1059.
Frank K.T., Petrie B., Choi J.S., Leggett W.C. 2005. Trophic cascades in a formerly cod-dominated ecosystem. Science, 308(5728): 1621–1623.
Frank K.T., Petrie B., Fisher J.A., Leggett W.C. 2011. Transient dynamics of an altered large marine ecosystem. Nature, 477(7362): 86–89.
Fredston-Hermann A., Gaines S., Halpern B. 2018. Biogeographic constraints to marine conservation in a changing climate. Annals of the New York Academy of Sciences, 1429(1): 5–17.
GEBCO 2023. General Bathymetric Chart of the Ocean gridded bathymetry data. Available from https://www.gebco.net/data_and_products/gridded_bathymetry_data/.
Gollner S., Kaiser S., Menzel L., Jones D., Brown A., Mestre N., et al. 2017. Resilience of benthic deep-sea fauna to mining activities. Marine Environmental Research, 129: 76–101.
Government of Canada. 2011. National Framework for Canada's Network of Marine Protected Areas. Fisheries and Oceans Canada, Ottawa. 31p.
Government of Canada 2023. Canadian Protected and Conserved Areas Database. Available from https://www.canada.ca/en/environment-climate-change/services/national-wildlife-areas/protected-conserved-areas-database.html. Government of Canada.
Grorud-Colvert K., Sullivan-Stack J., Roberts C., Constant V., Horta e Costa B., Pike E.P., et al. 2021. The MPA Guide: A framework to achieve global goals for the ocean. Science, 373(6560): eabf0861.
Halpern B.S., Walbridge S., Selkoe K.A., Kappel C.V., Micheli F., D'Agrosa C., et al. 2008. A global map of human impact on marine ecosystems. Science, 319(5865): 948–952.
Henson S., Beaulieu C., Ilyina T., John J., Long M., Séférian R., et al. 2017. Rapid emergence of climate change in environmental drivers of marine ecosystems. Nature Communications, 8.
Infantes E., Hoeks S., Adams M., van der Heide T., van Katwijk M., Bouma T. 2022. Seagrass roots strongly reduce cliff erosion rates in sandy sediments. Marine Ecology Progress Series, 700: 1–12.
IPCC. 2018. Summary for policymakers. In Global Warming of 1.5° C. An IPCC Special Report on the impacts of global warming of 1.5° C above pre-industrial levels and related global greenhouse gas emission pathways, in the context of strengthening the global response to the threat of climate change, sustainable development, and efforts to eradicate poverty.
IPCC. 2021. Summary for policymakers. Climate Change 2021: the Physical Science Basis. Contribution of Working Group I to the Sixth Assessment Report of the Intergovernmental Panel on Climate Change. 3–32.
IPCC 2023. Polar Regions. In Climate Change 2022 – Impacts, Adaptation and Vulnerability: Working Group II Contribution to the Sixth Assessment Report of the Intergovernmental Panel on Climate Change. Edited by O. Anisimov, G. Falto, C. Xiao.
IUCN-WPCA. 2018. Applying IUCN's Global Conservation Standards to Marine Protected Areas (MPA). Delivering effective conservation action through MPAs, to secure ocean health & sustainable development. (Version 1.0.): 4 pp.
Jacquemont J., Blasiak R., Le Cam C., Le Gouellec M., Claudet J. 2022. Ocean conservation boosts climate change mitigation and adaptation. One Earth, 5(10): 1126–1138.
Lewis S.A., Stortini C.H., Boyce D.G., Stanley R.R. 2023. Climate change, species thermal emergence, and conservation design: a case study in the Canadian Northwest Atlantic. FACETS, 8: 1–16.
Lilley R., Unsworth R. 2014. Atlantic Cod (Gadus morhua) benefits from the availability of seagrass (Zostera marina) nursery habitat. Global Ecology and Conservation, 2: 367–377.
Lotze H., Tittensor D., Bryndum-Buchholz A., Eddy T., Cheung W., Galbraith E., et al. 2019. Global ensemble projections reveal trophic amplification of ocean biomass declines with climate change. Proceedings of the National Academy of Sciences of the United States of America, 116(26): 12907–12912.
McLeod E., Salm R., Green A., Almany J. 2009. Designing marine protected area networks to address the impacts of climate change. Frontiers in Ecology and the Environment, 7(7): 362–370.
Molinos J., Halpern B., Schoeman D., Brown C., Kiessling W., Moore P., et al. 2016. Climate velocity and the future global redistribution of marine biodiversity. Nature Climate Change, 6(1): 83–8+.
Okey T., Alidina H., Lo V., Jessen S. 2014. Effects of climate change on Canada's Pacific marine ecosystems: a summary of scientific knowledge. Reviews in Fish Biology and Fisheries, 24(2): 519–559.
O'Regan S.M., Archer S.K., Friesen S.K., Hunter K.L. 2021. A global assessment of climate change adaptation in marine protected area management plans. Frontiers in Marine Science, 8. Available from https://www.frontiersin.org/articles/10.3389/fmars.2021.711085.
Paulus E. 2021. Shedding light on deep-sea biodiversity-a highly vulnerable habitat in the face of anthropogenic change. Frontiers in Marine Science, 8.
Pebesma E. 2018. Simple features for R: standardized support for spatial vector data. R Journal, 10(1): 439–446.
Pedersen E., Koen-Alonso M., Tunney T. 2020. Detecting regime shifts in communities using estimated rates of change. ICES Journal of Marine Science, 77(4): 1546–1555.
Pedersen E., Thompson P., Ball R., Fortin M., Gouhier T., Link H., et al. 2017. Signatures of the collapse and incipient recovery of an overexploited marine ecosystem. Royal Society Open Science, 4(7):.
Petrie B., Frank K., Shackell N., Leggett W. 2009. Structure and stability in exploited marine fish communities: quantifying critical transitions. Fisheries Oceanography, 18(2): 83–101.
Pettersen A., Marzinelli E., Steinberg P., Coleman M. 2022. Impact of marine protected areas on temporal stability of fish species diversity. Conservation Biology, 36(2):.
Post E., Bhatt U., Bitz C., Brodie J., Fulton T., Hebblewhite M., et al. 2013. Ecological consequences of sea-ice decline. Science, 341(6145): 519–524.
Prime Minister of Canada 2021. Minister of Fisheries, Oceans and the Coast Guard Mandate letter. In Go Canada(ed.). Available from https://pm.gc.ca/en/mandate-letters/2021/12/16/minister-fisheries-oceans-and-canadian-coast-guard-mandate-letter.
Pörtner H., Peck M. 2010. Climate change effects on fishes and fisheries: towards a cause-and-effect understanding. Journal of Fish Biology, 77(8): 1745–1779.
Pörtner H.-O., Bock C., Knust R., Lannig G., Lucassen M., Mark F.C., et al. 2008. Cod and climate in a latitudinal cline: physiological analyses of climate effects in marine fishes. Climate Reseach, 37: 253–270. internal-pdf://3438922898/Portner et al. 2008 Cod and climate.pdf.
Queirós A., Huebert K., Keyl F., Fernandes J., Stolte W., Maar M., et al. 2016. Solutions for ecosystem-level protection of ocean systems under climate change. Global Change Biology, 22(12): 3927–3936.
Queirós A., Talbot E., Beaumont N., Somerfield P., Kay S., Pascoe C., et al. 2021. Bright spots as climate-smart marine spatial planning tools for conservation and blue growth. Global Change Biology, 27(21): 5514–5531.
R Core Team. 2022. R: a language and environment for statistical computing. R Foundation for Statistical Computing, Vienna, Austria. Available from https://www.r-project.org/.
Rice J., Houston K. 2011. Representativity and networks of Marine protected Areas. Aquatic Conservation-Marine and Freshwater Ecosystems, 21(7): 649–657.
Rilov G., Fraschetti S., Gissi E., Pipitone C., Badalamenti F., Tamburello L., et al. 2020. A fast-moving target: achieving marine conservation goals under shifting climate and policies. Ecological Applications, 30(1):.
Roberts C.M., O'Leary B.C., McCauley D.J., Cury P.M., Duarte C.M., Lubchenco J., et al. 2017. Marine reserves can mitigate and promote adaptation to climate change. Proceedings of the National Academy of Sciences, 114(24): 6167–6175. Available from https://www.pnas.org/doi/abs/10.1073/pnas.1701262114.
Röhr M., Holmer M., Baum J., Björk M., Chin D., Chalifour L., et al. 2018. Blue carbon storage capacity of temperate Eelgrass (Zostera marina) Meadows. Global Biogeochemical Cycles, 32(10): 1457–1475.
Ross T., Du Preez C., Ianson D. 2020. Rapid deep ocean deoxygenation and acidification threaten life on Northeast Pacific seamounts. Global Change Biology, 26(11): 6424–6444.
Rubidge E.M., Robb C.K., Thompson P.L., McDougall C., Bodtker K.M., Gale K.S., et al. 2024. Evaluating the design of the first marine protected area network in Pacific Canada under a changing climate. FACETS, 9: 1–18.
Scheffers B., De Meester L., Bridge T., Hoffmann A., Pandolfi J., Corlett R., et al. 2016. The broad footprint of climate change from genes to biomes to people. Science, 354(6313):.
Shackell N., Frank K., Fisher J., Petrie B., Leggett W. 2010. Decline in top predator body size and changing climate alter trophic structure in an oceanic ecosystem. Proceedings of the Royal Society B-Biological Sciences, 277(1686): 1353–1360.
Sharples J., Scott B., Inall M. 2013. From physics to fishing over a shelf sea bank preface. Progress in Oceanography, 117: 1–8.
Stortini C., Chabot D., Shackell N. 2017. Marine species in ambient low-oxygen regions subject to double jeopardy impacts of climate change. Global Change Biology, 23(6): 2284–2296.
Thompson P., Nephin J., Davies S., Park A., Lyons D., Rooper C., et al. 2023. Groundfish biodiversity change in northeastern Pacific waters under projected warming and deoxygenation. Philosophical Transactions of the Royal Society B-Biological Sciences, 378(1881):.
Tia T.C., Steiner N.S., Hoover C., Cheung W.W.L., Sumaila U.R. 2019. Evaluating present and future potential of arctic fisheries in Canada. Marine Policy, 108: 103637.
Tittensor D.P., Beger M., Boerder K., Boyce D.G., Cavanagh R.D., Cosandey-Godin A., et al. 2019. Integrating climate adaptation and biodiversity conservation in the global ocean. Science Advances, 5(11): eaay9969. Available from https://advances.sciencemag.org/content/advances/5/11/eaay9969.full.pdf.
Wassmann P. 2011. Arctic marine ecosystems in an era of rapid climate change. Progress in Oceanography, 90(1-4): 1–17.
Wilson K.L., Tittensor D.P., Worm B., Lotze H.K. 2020. Incorporating climate change adaptation into marine protected area planning. Global Change Biology, 26(6): 3251–3267.
Zabihi-Seissan S., Baker K.D., Stanley R.R.E., Tunney T.D., Beaucham B., Benoît H.P., et al. 2024. Interactive effects of predation and climate on the distributions of marine shellfish in the Northwest Atlantic. Oikos, In revision.
Information & Authors
Information
Published In

FACETS
Volume 9 • Number 1 • January 2024
Pages: 1 - 15
Editor: Derek Tittensor
History
Received: 14 July 2023
Accepted: 25 June 2024
Version of record online: 18 October 2024
Notes
This paper is part of a collection titled Climate change and the Canadian marine conservation framework.
Copyright
© 2024 Authors Keen, Boyce, and The Crown. This work is licensed under a Creative Commons Attribution 4.0 International License (CC BY 4.0), which permits unrestricted use, distribution, and reproduction in any medium, provided the original author(s) and source are credited.
Data Availability Statement
Data generated or analyzed during this study are available in the CAN_MCN_Vulnerability GitHub repository, [doi: https://doi.org/10.5281/zenodo.12724210; https://github.com/rystanley/CAN_MCN_Vulnerability/tree/1.1].
Key Words
Sections
Subjects
Plain Language Summary
Assessing Climate Vulnerability in Canada’s Marine Protected Areas: Enhancing Resilience through Strategic Conservation Planning
Authors
Author Contributions
Conceptualization: LHK, CHS, DGB, RRES
Data curation: LHK, CHS, DGB, RRES
Formal analysis: LHK, CHS, DGB, RRES
Funding acquisition: RRES
Investigation: LHK, CHS, DGB, RRES
Methodology: LHK, CHS, DGB, RRES
Project administration: CHS, RRES
Resources: DGB
Software: LHK, DGB, RRES
Supervision: CHS, DGB, RRES
Visualization: LHK, CHS, DGB, RRES
Writing – original draft: LHK, CHS, DGB, RRES
Writing – review & editing: CHS, DGB, RRES
Competing Interests
The authors declare there are no competing interests.
Metrics & Citations
Metrics
Other Metrics
Citations
Cite As
Laura H. Keen, Christine H. Stortini, Daniel G. Boyce, and Ryan R.E. Stanley. 2024. Assessing climate change vulnerability in Canadian marine conservation networks: implications for conservation planning and resilience. FACETS.
9: 1-15.
https://doi.org/10.1139/facets-2023-0124
Export Citations
If you have the appropriate software installed, you can download article citation data to the citation manager of your choice. Simply select your manager software from the list below and click Download.
Cited by
1. Protection of seabed sediments in Canada's marine conservation network for potential climate change mitigation co-benefit