What are Canadians willing to pay for bird habitat conservation? A contingent valuation approach
Abstract
The North American Waterfowl Management Plan (NAWMP) is an international agreement between the Governments of Canada, the United States, and Mexico to coordinate the conservation and restoration of wetlands, associated uplands, and other key habitats for waterfowl and other bird species. To understand public support of NAWMP goals, we conducted a survey of Canadians (n = 2324) and asked about their willingness to make a one-time donation to NAWMP using the contingent valuation method (CVM). Results demonstrate that almost one-third were willing to donate to NAWMP to protect and conserve bird habitats. Parametric analysis of CVM responses provides a mean one-time donation estimate of roughly $33.00 per person. We found that participation in birdwatching is associated with higher willingness to donate to NAWMP, and that this association is stronger among people who participate in multiple outdoor recreation activities. Financial support is more likely to be captured by a variety of donation mechanisms. Fundraising communications that promote purchase of conservation lands, or conservation on public lands, science, and education/outreach programs are more likely to attract donors than conservation on private lands. These findings provide important insights that can assist conservation groups in Canada and beyond in formulating public engagement strategies to enhance revenues from voluntary donations.
Introduction
Despite widespread recognition of the dependence of people and wildlife on healthy ecosystems (MEA 2005a), financing biodiversity conservation continues to be a global challenge (Cosma et al. 2023). Wetlands are among the most threatened ecosystems on the planet (van Asselen et al. 2013), with an estimated 20% of the world's wetlands converted to other uses since the 1700s (Fluet-Chouinard et al. 2023). Wetland losses have significant implications due to the important contributions wetlands make to a number of essential ecosystem services, including carbon storage, water filtration, flood protection, and provision of habitat for wildlife (MEA 2005b; Zedler and Kercher 2005). Wetland flora and fauna provide economic and social benefits, such as opportunities for wildlife viewing, fishing and hunting, and gathering medicinal plants and wild plant foods (Nicholas 1998; Boyer and Polasky 2004; Roberts et al. 2017). Almost one-quarter of the world's wetlands are found in Canada (Environment Canada 2004).
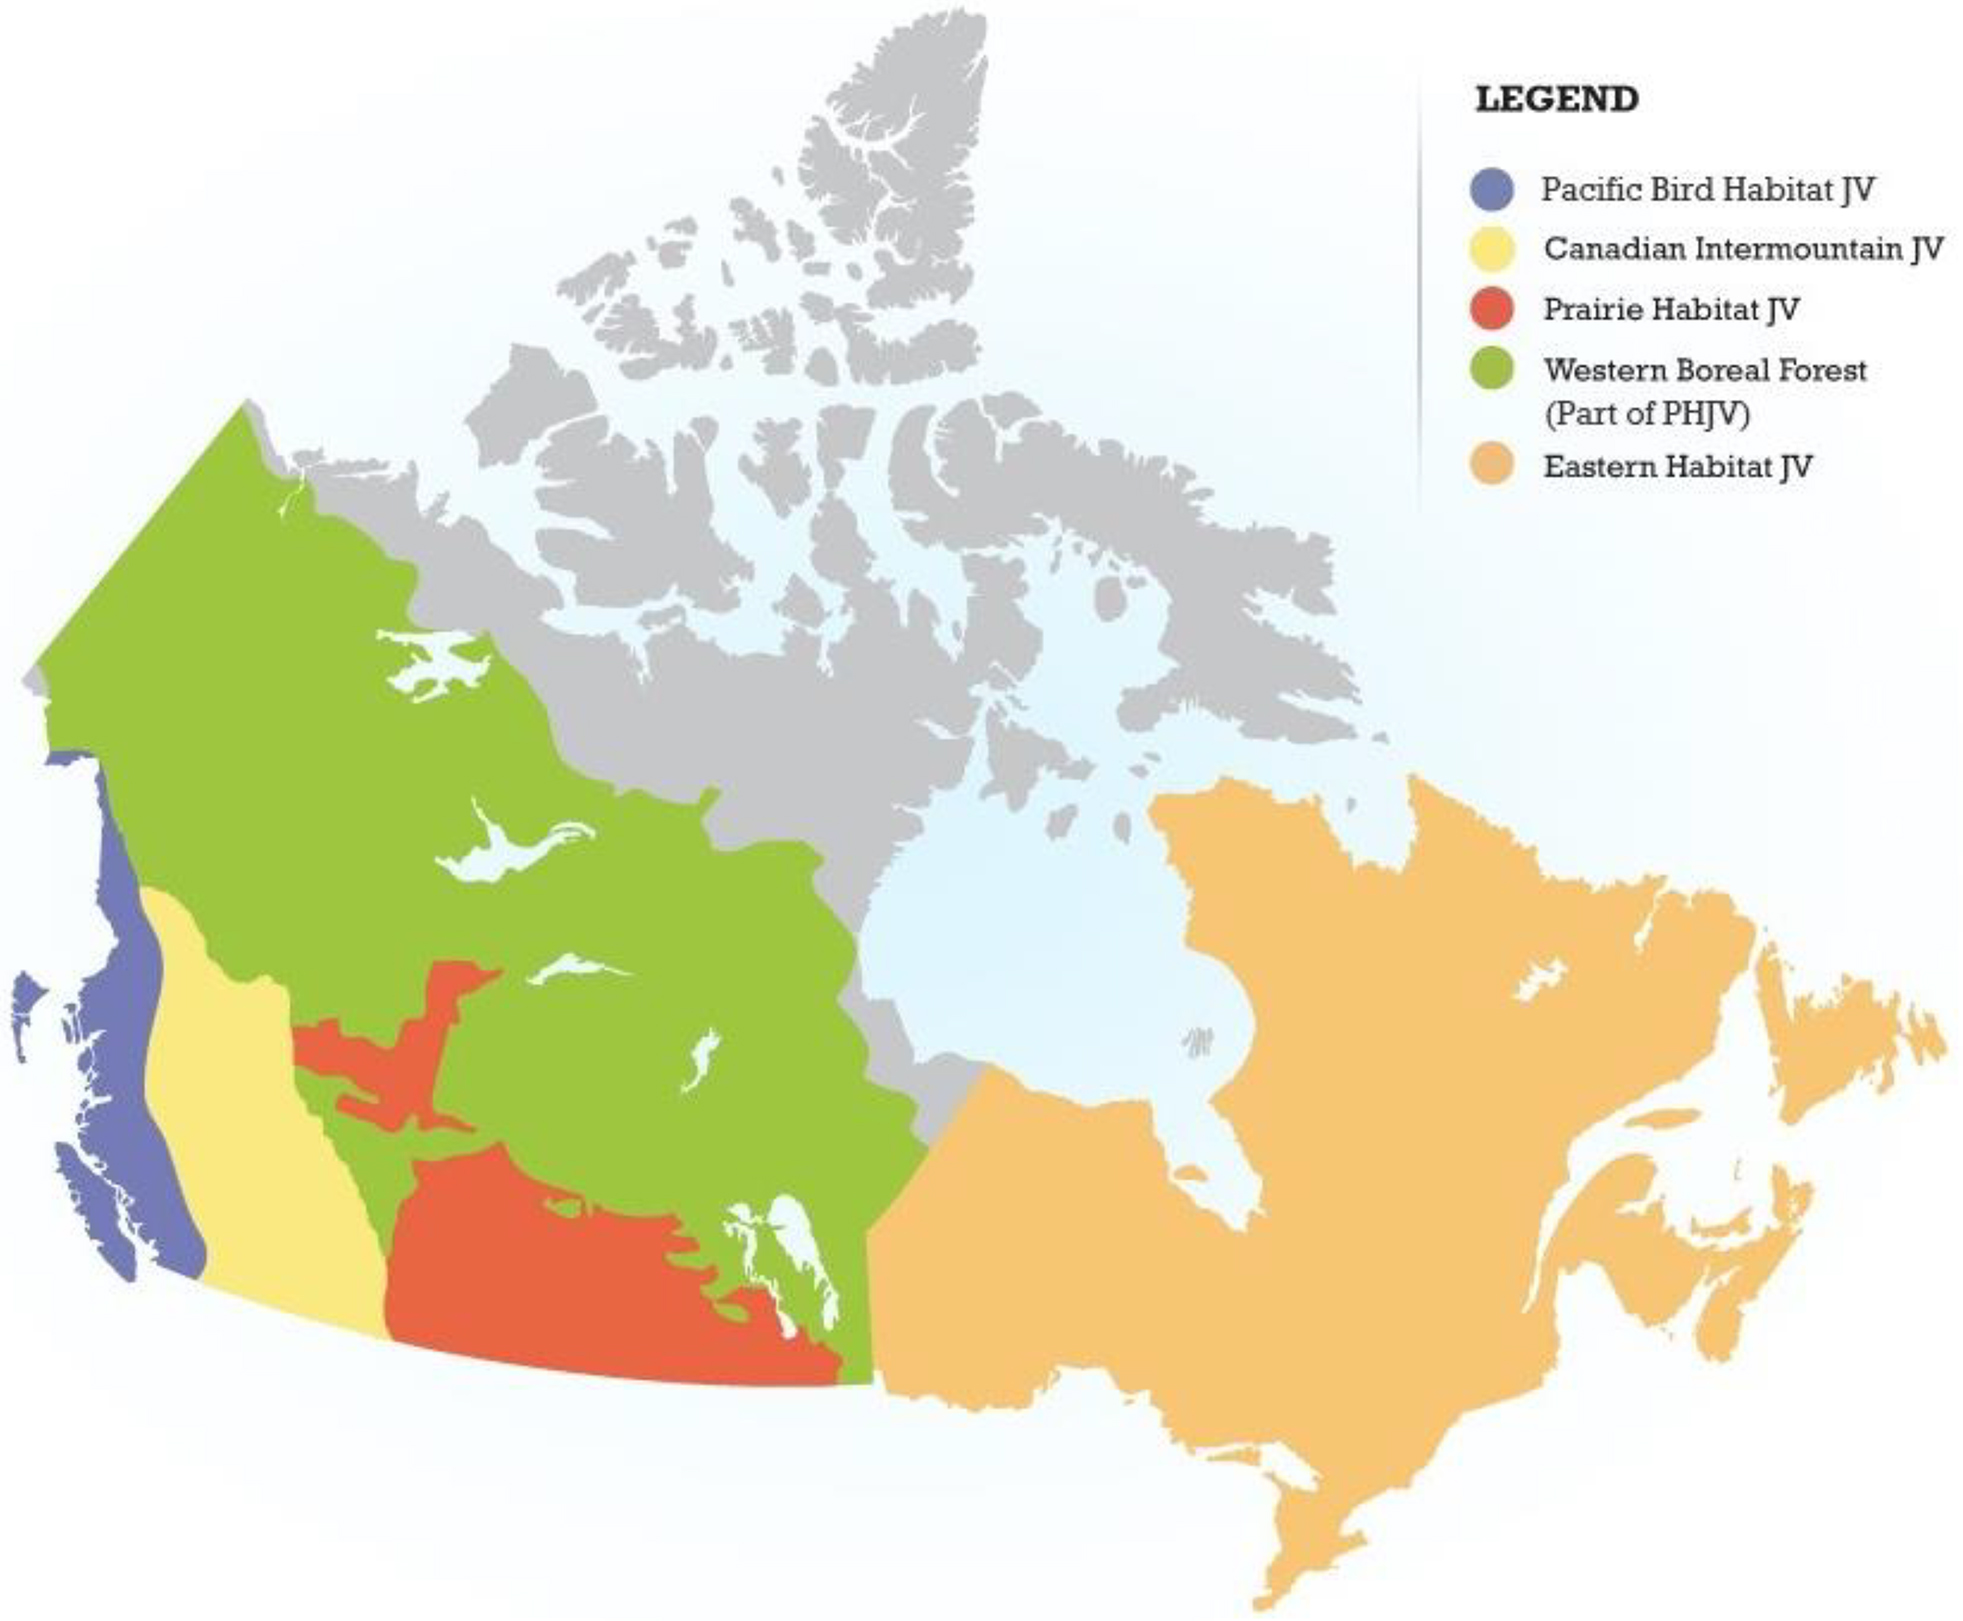
Established in 1986 against a backdrop of declining waterfowl populations and wetland loss, the North American Waterfowl Management Plan (NAWMP) is a trilateral agreement between the Governments of Canada, the United States, and Mexico. The NAWMP operates at international, national, and regional scales to coordinate the conservation and restoration of wetlands, associated uplands, and other key habitats for waterfowl and other bird species (Williams et al. 1999). The NAWMP is delivered through regional public–private partnerships, or joint ventures (JVs). Four Canadian Habitat JVs integrate planning, science, governance, partnerships, and management to achieve NAWMP objectives in Canada (Fig. 1). Funding for NAWMP comes from the North American Wetlands Conservation Act, the Pittman Robertson Wildlife Restoration Act, government programs, and public–private partnerships in both Canada and the United States (Anderson and Padding 2015; Humburg et al. 2018). In addition, funding provided by the Migratory Bird Hunting and Conservation Stamp (U.S.) and the Canadian Wildlife Habitat Conservation Stamp (i.e., “Duck Stamps”) support initiatives that contribute towards NAWMP goals.
Fig. 1.
Despite NAWMP's success (Williams et al. 1999; Anderson and Padding 2015; Howerter et al. 2024), many challenges remain for wetland and waterfowl management (Humburg et al. 2018). For example, waterfowl hunter numbers in the United States (U.S.) and Canada have been declining since the 1970s, reflected in diminishing sales of Duck Stamps (NAWMP 2012). The reduction in waterfowl hunters and revenues from Duck Stamps has implications for the funding available to purchase, lease, or restore wetland habitats for conservation (Vrtiska et al. 2013). In 2012 the NAWMP established a goal (“Goal 3”) to broaden the stakeholder base from focusing primarily on waterfowl hunters to including other conservationists and society at large (Devers et al. 2017). Goal 3 created the challenge of identifying and engaging people who are interested in, concerned about, and willing to take action to support wetlands and waterfowl conservation. Assessing the potential donations that people with different connections to wetlands are prepared to make is one way to understand the scope and distribution of support for wetlands and their conservation among different constituencies.
Non-market valuation techniques are well-established methods used to estimate the economic value of natural resources and the environment. Methods include stated preference (SP) techniques, such as contingent valuation and discrete choice experiments, and revealed preference techniques, such as hedonic pricing and travel cost methods (Sarker and McKenney 1992). Choice of valuation method depends on many factors, including budget, expediency, type of resource, and policy directive. When the resource or environmental amenity in question is related to observable human behaviours, revealed preference methods are often appropriate. In cases where the environmental good or service is not directly associated with observable action, or when hypothetical or future changes in resource condition are relevant for policy, survey-based SP methods can be employed. SP methods applied across four Canadian provinces have found that Canadians value wetlands positively and are willing to pay to protect the ecosystem services that wetlands provide (Pattison et al. 2011; Lantz et al. 2013; Dias and Belcher 2015; He et al. 2017).
The contingent valuation method (CVM) is an SP approach that relies on asking direct questions about willingness to pay (WTP) for beneficial changes or willingness to accept for changes that are detrimental. Owing to its relative ease of implementation, flexibility, and ability to estimate non-use values, CVM has been used in more than 10 000 studies to understand the value of species, habitats, and environmental management alternatives across the globe since the 1960s (Bishop and Heberlein 2019; Haab et al. 2020). Numerous reviews of methodological issues, best practices, and applications of CVM are available in the literature (see for example Hanemann 1984, 1994; Arrow et al. 1993; Diamond and Hausman 1994; Champ et al. 1997; Cummings and Taylor 1999; Carson and Hanemann 2005; Carson 2012; Kling et al. 2012; Haab et al. 2013; Bishop et al. 2017; Penn and Hu 2019). The principal advantage of CVM is the ability to estimate values that are not associated with use (e.g., existence value, option value, bequest value) or values for states of the world that have not yet transpired. The main disadvantage stems from biases that may be introduced by the hypothetical, non-binding nature of the valuation scenarios. With no real commitment of time or resources required other than the time to complete the survey, stated responses may differ from the behaviours that would take place in practice. Nonetheless, it remains that there are few alternatives to SP methods for valuing non-market goods and services (Baker and Ruting 2014), and CVM has been employed widely to estimate the value of birds (MacMillan et al. 2004;Martín‐López et al. 2008), wetlands (Brouwer et al. 1999), as well as WTP for birdwatching (e.g., Lee et al. 2009; Myers et al. 2010), bird (Martín-López et al. 2007; Jin et al. 2008; Hynes and Hanley 2009; Zander et al. 2014), and wetland habitat conservation (Whitehead 1990; Haefele et al. 2019). CVM studies have also examined factors that contribute to heterogeneity in WTP for bird and habitat conservation. Kaval and Roskruge (2009) found that WTP for bird conservation in New Zealand was influenced by income, ethnicity, and age, with a majority of respondents willing to make donations as an addition to their taxes. Clucas et al. (2015) found that demographic, socio-economic, and cultural factors influenced WTP for bird conservation in Seattle and Berlin. In this paper, we explore beyond these measures in our assessment of the scope and distribution of potential donations to bird and habitat conservation.
As Bryan (2000) has noted, outdoor recreation activities can serve as “windows to the environment”. For many people, outdoor recreation provides one of the few opportunities to experience, interact with, learn about, and ultimately understand natural areas. Wildlife recreationists, such as waterfowl hunters and birdwatchers, are 4–5 times more likely to engage in pro-environmental behaviours than non-recreationists (Cooper et al. 2015). In the last 5 years, approximately one in 10 Canadians went waterfowl hunting and more than half of Canadians went birdwatching (Harshaw and Sainsbury 2023). Foraging, or gathering and harvesting wild plants for food, medicine, or materials for craft, household, cultural, or spiritual uses is a ubiquitous practice (Svizzero 2016; Shackleton et al. 2017) that provides opportunities for people to connect with nature and share ecological knowledge (McLain et al. 2014; Pleininger et al. 2015). In urban settings, gathering is increasingly seen as an important way to foster interactions with nature (Fischer and Kowarik 2020). A recent survey of Canadians found that around one-quarter went foraging for wild plants in the last 5 years (Teel et al. 2022). Gatherers can forge close connections with the environment (Poe et al. 2014), which makes it likely that gatherers may be supportive of biodiversity conservation. In the CVM literature, there is evidence that WTP for wetland conservation is higher among outdoor recreationists than non-outdoor recreationists (Whitehead 1990). Different types of outdoor recreation activities may be associated with variation in WTP: participants in licensed activities (e.g., hunting, fishing) have higher WTP for habitat conservation than participants in unlicensed activities (birdwatching, hiking; Haefele et al. 2019; Casola et al. 2023). To provide conservation organizations with a practical means of targeting solicitations toward those who are more likely to donate, we investigate whether participation in combinations of waterfowl hunting, birdwatching, and gathering might influence WTP for wetland conservation.
In this paper, we use a contingent valuation approach to estimate the WTP for bird habitat conservation in Canada. We use the NAWMP as a case study to assess Canadian donation preferences in response to a real-world scenario. Using information collected in an online national survey of Canadians, we combine WTP preferences with socio-economic and outdoor recreation participation data to explore factors that influence financial support for wetlands conservation. We hypothesize that engagement in outdoor recreation activities such as hunting, birdwatching, and plant gathering will increase willingness to donate to NAWMP (e.g., Casola et al. 2023) and that socio-economic (age, income, gender) and geographic (JV) characteristics will influence donation decisions (e.g., Clucas et al. 2015). We investigate how people would prefer to donate their money and what conservation action they would prefer their donations to be used for. The findings from this research have implications for policy makers and practitioners seeking to expand the base of financial support for bird and habitat conservation.
Methods
We carried out a web-based nationwide survey of the Canadian general public (16 years and over) between November and December, 2022. Respondents were research panel participants recruited by Abacus Data (Ottawa) from a number of subpanels to minimize respondent bias. The survey was available in French and English. To meet the power requirements necessary for all planned analysis and ensure representativeness, the sample frame was stratified by JV, province, age, and biological sex of respondents to match Canadian census weightings, and included a French language quota. Respondents were purposely sampled from the 10 Canadian provinces, but not the three Territories due to lack of coverage in the panels. Respondents were given incentives to participate. Sample quality was assessed via several checks, including time to complete, whether or not respondents had answered all interval scale questions identically, and whether they had given the same response to a question that was repeated in the survey. Respondents who did not meet quality check standards were removed from the sample. The survey was designed in Sawtooth Lighthouse Studio (software version: 9.14.2). The study was approved by the University of Alberta's Research Ethics Board (reference: Pro00112000) and all participants gave informed consent before beginning the survey.
Survey design
The full questionnaire included questions concerning respondents’ attitudes, behaviours, and preferences for habitat and bird conservation, as well as a contingent valuation section. Respondents were asked about their outdoor recreation activities and their conservation donation history. Socio-demographic information collected included age, income, and gender identity (see Supplementary material S1).
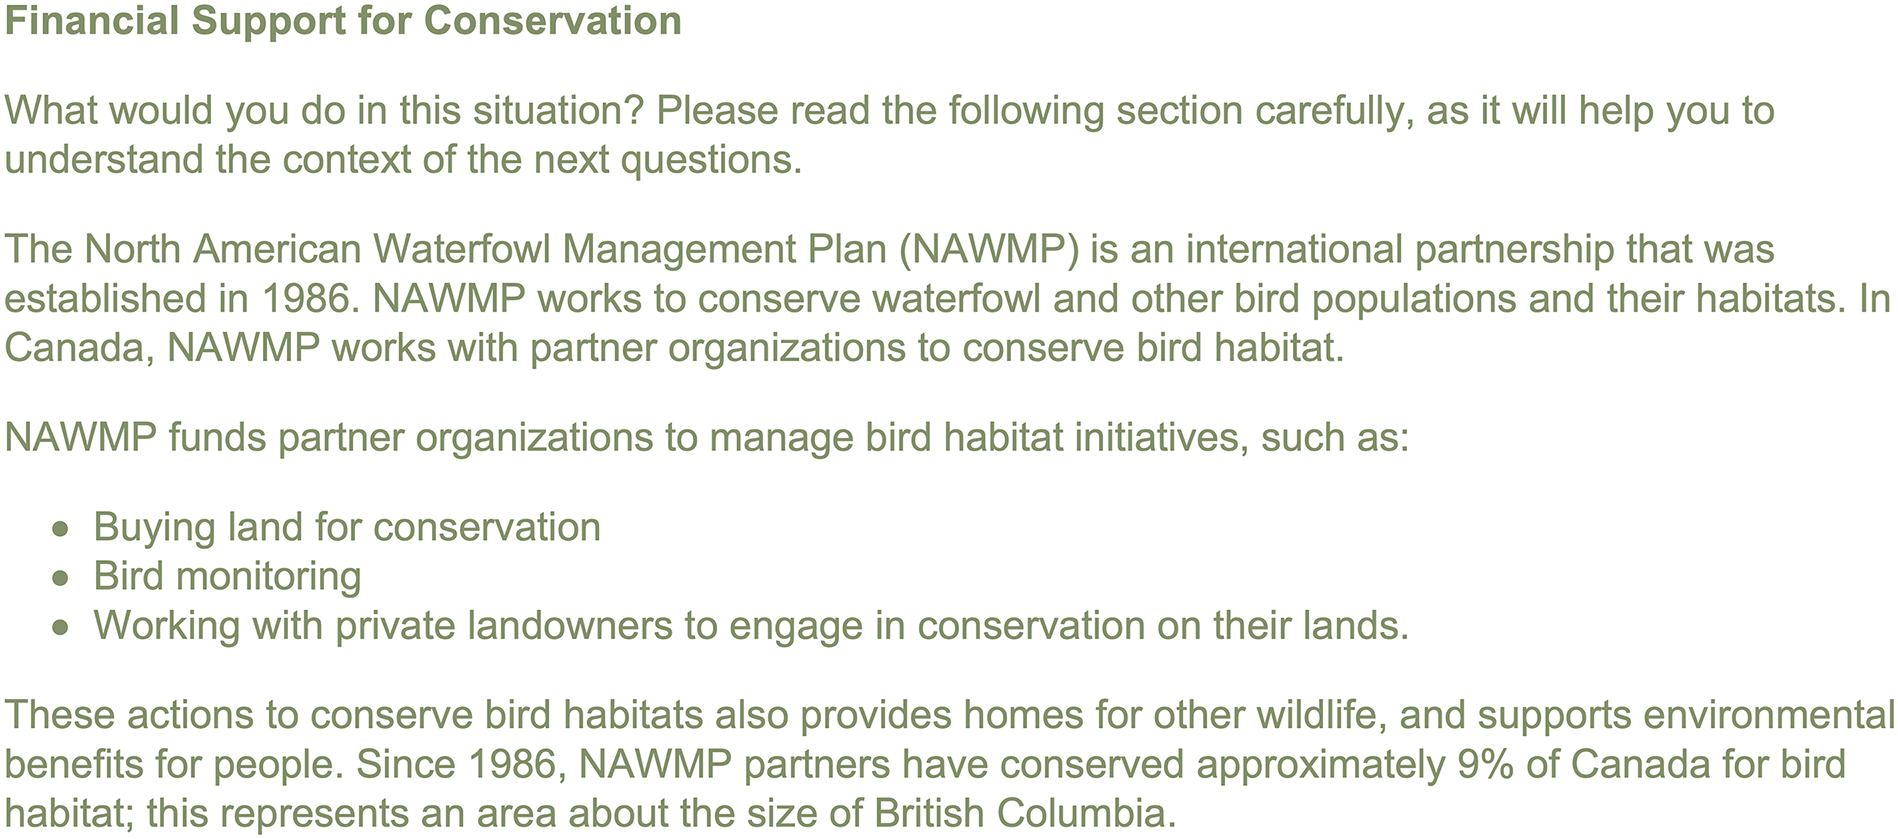
After being presented with an overview of the approach to conservation undertaken by NAWMP partners (Fig. 2), respondents were asked about their willingness to make a one-time donation (WTP) of a given value to NAWMP. Voluntary payments (i.e., charitable donations) were selected over compulsory payments as the latter (e.g., Duck Stamps) have historically contributed to the NAWMP, prompting interest in the viability of donations as a source of wetland conservation funding (see Champ and Bishop 2001 for a discussion of the advantages of voluntary donations over compulsory payments). A one-time donation was selected because they tend to yield more conservative and plausible values for the present value of WTP than repeat payments (Brouwer et al. 2008; Myers et al. 2017). To minimize hypothetical bias, we used a dichotomous-choice question (Hanemann 1984; Whitehead and Blomquist 2006) and provided a “cheap talk” statement reminding respondents of their household obligations, and other opportunities to donate to conservation initiatives (Cummings and Taylor 1999; List 2001; Ladenburg and Olsen 2014; Penn and Hu 2019). We also asked respondents to state their confidence in their donation decision using a six-point interval scale (1 = not confident; 6 = confident) after the donation question (as per Champ and Bishop 2001) so that models could be validated by only including responses from those who were confident in their donation decision (Lyssenko and Martínez-Espiñeira 2012).
Fig. 2.
Donation values were initially determined through discussions during three focus groups (n = 16) with participants from across Canada in April and May 2022. These values were adjusted following a soft launch first wave (n = 94) and again following a second wave (n = 419) of the survey. The final possible donation amounts included $1, $10, $25, $50, $75, $100, $150, and $200. In the first adjustment, the lowest and highest values were changed from a $10 to a $2 minimum and from $150 to a $200 maximum. The second wave showed that the $2 minimum value had not increased the uptake of donations much more than the $10 donation original minimum level (<50%), and so the minimum donation amount offered was reduced to $1. Donation amounts were presented to each respondent randomly; donation amounts were quota-controlled to ensure that each value appeared evenly through the sample.
Respondents who declined to donate were asked why not to identify protest votes (Carson 2000). Respondents who were willing to donate were asked how they would prefer the money to be collected and how they would prefer for it to be spent using lists determined from the focus groups. We included an “Other” category for each follow up question with a free text field. Free text responses were reviewed and recoded into the pre-determined response categories where possible. The order of the response categories for these questions was randomized for each respondent.
Data analysis
To derive estimates of WTP for wetland conservation under NAWMP and to understand factors associated with WTP, we modelled the CVM responses using the non-parametric Turnbull approach and parametric analysis via logit regression (Haab and McConnell 2002; see Supplementary material S2 for details of the empirical approach).
The survey data were extracted and prepared for analysis in R Studio (R Version 4.2.1, R Core Team 2022) using the package “tidyverse” (Wickham et al. 2019). The Turnbull calculation was estimated using Microsoft® Excel®. Logit models and mean WTP were estimated using Nlogit 6.0 (Econometric Software Inc., Greene 2016). Logit models were estimated without covariates (Model A) and with covariates (Models B and C). Socio-economic variables (age, gender identity, income, and location) were added using stepwise inclusion. Given the biases inherent to CVM, our model selection process was guided by identifying the most conservative WTP estimate while controlling for relevant socio-economic variables and exploring associations between WTP and recreation participation. As the number of responses to each socio-economic question varied (each question in the survey was optional), it was our preference to present parsimonious models to maximize the sample size included in the analysis. We adopted a threshold of p < 0.1 for excluding variables to retain marginally significant terms for discussion. Participation in outdoor recreation activities was modelled in two ways: Model B included a binary variable (Y/N indicating previous participation) for each activity (hunting, birdwatching, and gathering) and Model C included an eight-level nominal dummy-coded variable called “Recreation Activities” (levels: never participated, hunted only, gathered only, birdwatched only, hunted and birdwatched, hunted & gathered, gathered & birdwatched, hunted & gathered & birdwatched), with “never participated” as the reference level. For the logit models only, income was converted to a continuous variable from the categories provided in the survey by taking the midpoint of each category, and using $151 000 as the highest amount to represent >$150 000 and modelled both as a linear and quadratic term. Models excluding respondents who were not confident in their donation response (where confidence was <4 on a scale of (1) not at all confident and (6) very confident) and excluding protest votes were estimated and compared to the final models. All monetary amounts are presented in Canadian dollars unless otherwise stated.
Finally, a series of separate post-hoc χ2 tests of association were carried out in R (Package: sjPlot, Lüdecke 2022) to examine (i) reasons for not donating, (ii) preferences for how to donate, and (iii) what the money should be spent on by income (four-level ordinal variable as per original data collection: $0–$49k, $50k–99k, $100k–149k, $150k+), age (four-level ordinal variable: 16–25 years, 26–40 years, 41–65 years, 66 years+), gender identity (two-level nominal variable: female, male; note: small sample sizes of non-binary genders meant that these were excluded from post-hoc analyses), JV (five-level nominal variable: EHJV, PHJV—Prairie Parkland, PHJV—Western Boreal, CIJV, PBHJV), and historical hunting, birdwatching, and gathering participation (total number of activities participated in and binary Y/N for each activity). To mitigate for Type I errors from running multiple tests of the same data, Bonferroni-adjusted alpha values were applied to assess significance (alpha value = 0.006; Field et al. 2012). Yates corrections were applied to calculate p values for matrices with <20% of cells with values <5 (McHugh 2013). Effect sizes were assessed using Cohen's w (small effect = 0.1, medium effect = 0.3, large effect = 0.5; Cohen 1988; Volker 2006).
Results
In total, 3358 respondents completed the survey, of whom 3324 answered the CVM question. A subset of respondents also answered the income, activities, and confidence questions (n = 2721). The majority of respondents were confident in their donation decision (median = 5, SD = 1.30), with only 15% of respondents reporting confidence ≤3 (n = 397, Supplementary material S3). To address hypothetical bias and to present the most conservative WTP estimates, all unconfident responses were excluded from the analysis, leaving a final sample size of 2324 respondents (Table 1). Consistent with the distribution of the population in Canada, almost half of the sample came from the Eastern Habitat JV (Ontario, Quebec, New Brunswick, Nova Scotia, Prince Edward Island, and Newfoundland and Labrador). A small majority of respondents identified their gender as female. The mean age of respondents was 47.6 (SD: 16.49 years), slightly above the mean age of the Canadian population in 2021 (Statistics Canada 2023). Just over one-third of respondents earned <$50 000 per household per year pre-tax, and three-quarters of respondents earned <$100 000 per household per year pre-tax, which indicates our data are slightly skewed towards lower incomes than the national average (Statistics Canada 2023). As WTP is often associated with income (Jacobsen and Hanley 2009), we considered the implication of this to be that our estimate would be conservative. When asked about outdoor recreation activities, over half reported having been birdwatching, over one-quarter had previously gathered plants or fungi, and approximately one-tenth had hunted waterfowl before. One-third of respondents had never participated in any of these activities. Although a large proportion of respondents reported participating in only one of these activities, one-fifth had participated in two of the activities, and a minority had participated in all three of the activities. Very few respondents had heard of NAWMP prior to the survey. Almost half of all respondents indicated that they had donated money or raised funds for conservation causes in the 12 months prior to participating in the survey (Supplementary material S4).
Table 1.
| Characteristic | n | % |
|---|---|---|
| Age | ||
| 16–25 years | 238 | 10.2% |
| 26–40 years | 656 | 28.2% |
| 41–65 years | 1019 | 43.8% |
| 66 years+ | 376 | 16.2% |
| Unknown | 35 | 1.5% |
| Gender identity | ||
| Male | 1017 | 43.8% |
| Female | 1286 | 55.3% |
| Non-traditional (transgender, non-binary, gender non-conforming, other) | 17 | 0.7% |
| Unknown | 4 | 0.2% |
| Income | ||
| $49 000 or less | 922 | 39.7% |
| $50 00–$99 000 | 838 | 36.1% |
| $100 000–$149 000 | 393 | 16.9% |
| $150 000+ | 171 | 7.4% |
| NAWMP joint venture | ||
| EHJV | 1058 | 45.5% |
| PHJV Prairie Parkland | 508 | 21.9% |
| CIJV | 298 | 12.8% |
| PBHJV | 310 | 13.3% |
| PHJV Western Boreal | 150 | 6.5% |
| Familiarity with NAWMP prior to survey | ||
| Yes | 176 | 7.6% |
| No | 1975 | 85.0% |
| Don't know | 173 | 7.4% |
| Activities | ||
| Previously hunted only | 37 | 1.6% |
| Previously birdwatched only | 739 | 31.8% |
| Previously gathered only | 161 | 6.9% |
| Previously hunted and birdwatched | 98 | 4.2% |
| Previously hunted and gathered | 15 | 0.6% |
| Previously birdwatched and gathered | 350 | 15.1% |
| Previously hunted, birdwatched, and gathered | 111 | 4.8% |
| Not participated | 813 | 35.0% |
Willingness to donate to NAWMP
Overall, 32.1% of respondents (n = 746) reported that they were willing to donate to NAWMP (Table 2), which is smaller than the percentage of respondents who reported making a donation to conservation causes 1 year prior to completing the survey. Two-thirds of these respondents accepted the $1 donation value, and almost half of respondents accepted the $2, $10, and $20 donation values. Acceptance rates fell to around one-third for the $25 and $50 donation values, and one-quarter of respondents accepted the $75 and $100 donation values. Between 16% and 20% of respondents accepted donations of $125 or more. To maintain the monotonicity assumption of the non-parametric Turnbull estimate of mean WTP, the $10 (n = 291), $20 (n = 6), $100 (n = 292), and $150 (n = 292) responses were pooled into the lower categories ($2, $75, and $125 respectively). Pooling the responses into the lower response categories reduces the WTP boundary estimates, i.e., generates more conservative estimates. The lower bound non-parametric Turnbull estimate of mean WTP (see supplementary material eq. 1) is $44.46. Assuming a $201.00 maximum donation value produces an upper bound estimate of $54.81. All three logit regression models (see supplementary material eq. 5; Table 3) had negative and highly significant donation coefficients, suggesting that respondents are less willing to donate larger amounts. Parametric estimates of mean WTP for a one-time donation to NAWMP were between $33.59 and $37.98. Model C generated the most conservative mean WTP estimate of $33.59 (±$6.74; Table 3). The confidence intervals for the parametric estimates fall within the bounds of the non-parametric Turnbull estimate of WTP.
Table 2.
| Interval | # Yes | # times offered | % Yes | Cumulative % Yes |
|---|---|---|---|---|
| $1–$1.99 | 175 | 262 | 66.8% | 66.8% |
| $2–$24.99 | 156 | 334 | 46.7% | 55.5% |
| $25–$49.99 | 88 | 268 | 32.8% | 48.5% |
| $50–$74.99 | 79 | 265 | 29.8% | 44.1% |
| $75–$124.99 | 137 | 589 | 23.3% | 37.0% |
| $125–$199.99 | 60 | 301 | 19.9% | 34.4% |
| $200–$200.99 | 51 | 305 | 16.7% | 32.1% |
Table 3.
| Model A: no covariates | Model B: income + individual activities | Model C: income + combined activities | ||||
|---|---|---|---|---|---|---|
| Variable | Coefficient (SE) | p value | Coefficient (SE) | p value | Coefficient (SE) | p value |
| Constant | −0.083 (0.067) | 0.215 | −1.310 (0.127) | <0.0001 | −1.333 (0.135) | <0.0001 |
| Donation amount1 | −0.010 (0.001) | <0.0001 | −0.010 (0.001) | <0.0001 | −0.010 (0.001) | <0.0001 |
| Income (cont.) | 0.006 (0.001) | <0.0001 | 0.007 (0.001) | <0.0001 | ||
| Hunted (Y/N)2 | 0.269 (0.147) | 0.067 | ||||
| Birdwatched (Y/N)2 | 1.063 (0.104) | <0.0001 | ||||
| Gathered (Y/N)2 | 0.323 (0.107) | 0.003 | ||||
| Combined activities (8 levels)2 | ||||||
| Hunted only | 0.075 (0.444) | 0.866 | ||||
| Birdwatched only | 1.123 (0.123) | <0.0001 | ||||
| Gathered only | 0.592 (0.208) | 0.005 | ||||
| Hunted & birdwatched | 1.297 (0.235) | <0.0001 | ||||
| Hunted & gathered | −0.317 (0.666) | 0.633 | ||||
| Birdwatched & gathered | 1.291 (0.149) | <0.0001 | ||||
| Hunted & birdwatched & gathered | 1.895 (0.225) | <0.0001 | ||||
| Mean willingness to donate | $37.98 (3.82) | <0.0001 | $33.93 (3.483) | <0.0001 | $33.59 (3.44) | <0.0001 |
| 95% confidence intervals: Lower Bound, Upper Bound WTP | $30.49, $45.48 | $27.10, $40.75 | $26.85, $40.34 | |||
| Log likelihood | −1373.330 | −1280.017 | −1276.593 | |||
| AIC | 2750.700 | 2572.000 | 2573.200 | |||
| McFadden's pseudo R2 | 0.058 | 0.122 | 0.125 | |||
| n | 2324 | 2324 | 2324 | |||
1
Values in table rounded to 2 decimal places for dollar amounts and 3 decimal places for all other coefficients for clarity. This masks variation in the donation amount coefficients that generate the WTP values for each model. Coefficient estimates for donation amount for Models A, B, and C are −0.00956 (SE: 0.00079), −0.01002 (SE: 0.00082), and −0.01009 (SE: 0.00083), respectively.
2
Reference level: no historical participation.
Models with covariates (Models B and C) had lower WTP estimates and better explanatory power (R2 values), albeit slightly higher AIC and lower log likelihood values, than the base model (Model A). Model fit statistics were similar between Models B and C. Models B and C both revealed significant effects of income and past participation in waterfowl hunting, birdwatching, and/or gathering on WTP. Age, gender, and location variables were excluded from Models B and C for parsimony as the significance levels were far outside of the bounds of our threshold of p < 0.1. Both models found that respondents with higher incomes were willing to donate more to NAWMP. Income was tested using log income and income as a quadratic term, but these variations did not improve on the original models, and so were not included in the final model specifications. When outdoor recreation participation was modelled as binary variables (Model B), birdwatching and gathering participation had statistically significant (p < 0.05) positive associations with WTP, whereas the hunting participation coefficient was marginal (p < 0.1). The birdwatching coefficient was more than three times greater than gathering. Closer inspection of the combinations of participation in different outdoor recreation activities (Model C) confirmed that birdwatching (on its own or in combination with any other activities) was always associated with a higher WTP. Plant gathering had a positive association with WTP on its own, or when combined with birdwatching, but not when combined with hunting. Waterfowl hunting history was not associated with WTP except when combined with birdwatching. This result may be due to the relatively low number of waterfowl hunters in the sample who only hunted, or only hunted and gathered, and should be treated with caution. Respondents who had previously participated in all three activities had the greatest willingness to donate.
Reasons for declining to donate
A total of 1578 respondents declined to donate to NAWMP. There was significant variation in the reasons for declining to donate (χ2 = 3330.50, df = 5, p = <0.001; excluding “Other”). Not being able to afford to pay was the main reason cited for not donating (Fig. 3). The protest vote, ‘‘I do not believe the money will be used effectively’’, was the second most common reason selected by respondents. Of those who originally responded “Other” (118 individuals), 24 respondents were recoded to ‘‘I cannot afford to pay’’ and two respondents to “It is not my responsibility to support the conservation of birds and their habitats in Canada”. The majority remaining in “Other” (92 individuals) stated they supported other non-conservation causes, or had other financial priorities (55 respondents). Eighteen respondents wanted more information or time to research NAWMP before making a decision and several respondents preferred to make non-financial contributions, or might consider donating at another time of year.
Fig. 3.

Analyses of associations with reasons for declining to donate revealed small to medium effects of income, gender identity, number of activities participated in, and hunting and birdwatching history (Table 4). Lower income earners (up to $49 000) were more likely to choose ‘‘I cannot afford to pay’’; higher income earners ($100 000–149 000) were less likely to choose this. Women were more likely to choose ‘‘I cannot afford to pay’’ and men were more likely to choose the protest vote option. People who had previously hunted waterfowl were less likely to choose ‘‘I cannot afford to pay’’, and more likely to choose either the protest vote option, or that they did not believe birds or habitat required protection, or that it was not their responsibility to support conservation. This last result should be treated with caution due to the small number of responses to this answer combined with the relatively low proportion of waterfowl hunters in the sample. There was no significant variation in reasons for declining to donate by JV, or for those who had previously gathered.
Table 4.
| Variable | χ2 | df | p value | Cohen's w |
|---|---|---|---|---|
| Income1 | 88.470 | 18 | <0.001* | 0.237 |
| Age1 | 42.873 | 18 | <0.001* | 0.166 |
| Gender identity | 38.432 | 6 | <0.001* | 0.157 |
| Joint Venture region1 | 27.058 | 24 | 0.302 | 0.130 |
| Activity count1 | 39.122 | 18 | 0.003* | 0.158 |
| Previously hunted | 49.576 | 6 | <0.001* | 0.177 |
| Previously birdwatched | 20.160 | 6 | 0.003* | 0.113 |
| Previously gathered1 | 8.417 | 6 | 0.209 | 0.073 |
1
Yates correction applied to p value due to some cell values (<20%) of <5.
*
Indicates statistical significance using a Bonferroni adjusted p value of 0.006.
“Yes” responses: preferred payment vehicle
There was significant variation in responses for preferred donation mechanisms (χ2 = 62.477, df = 4, p = <0.001; excluding “Other”). There was not a single dominant preference for donation mechanism, although payment via a non-governmental organization and voluntary donations when filing taxes were the most popular options (Fig. 4). Two of 15 responses in the “Other” category were recategorized into “Payment via a non-governmental organization” and “Purchase of a wildlife collectible”. Of the remainder, three people suggested some sort of point-of-sale mechanism, one preferred to donate directly to NAWMP, and the remainder specified responses relating to money type (e.g., cash, cheque, online). There were no statistically significant differences by income, gender identity, JV, or number of recreation activities (Table 5).
Fig. 4.
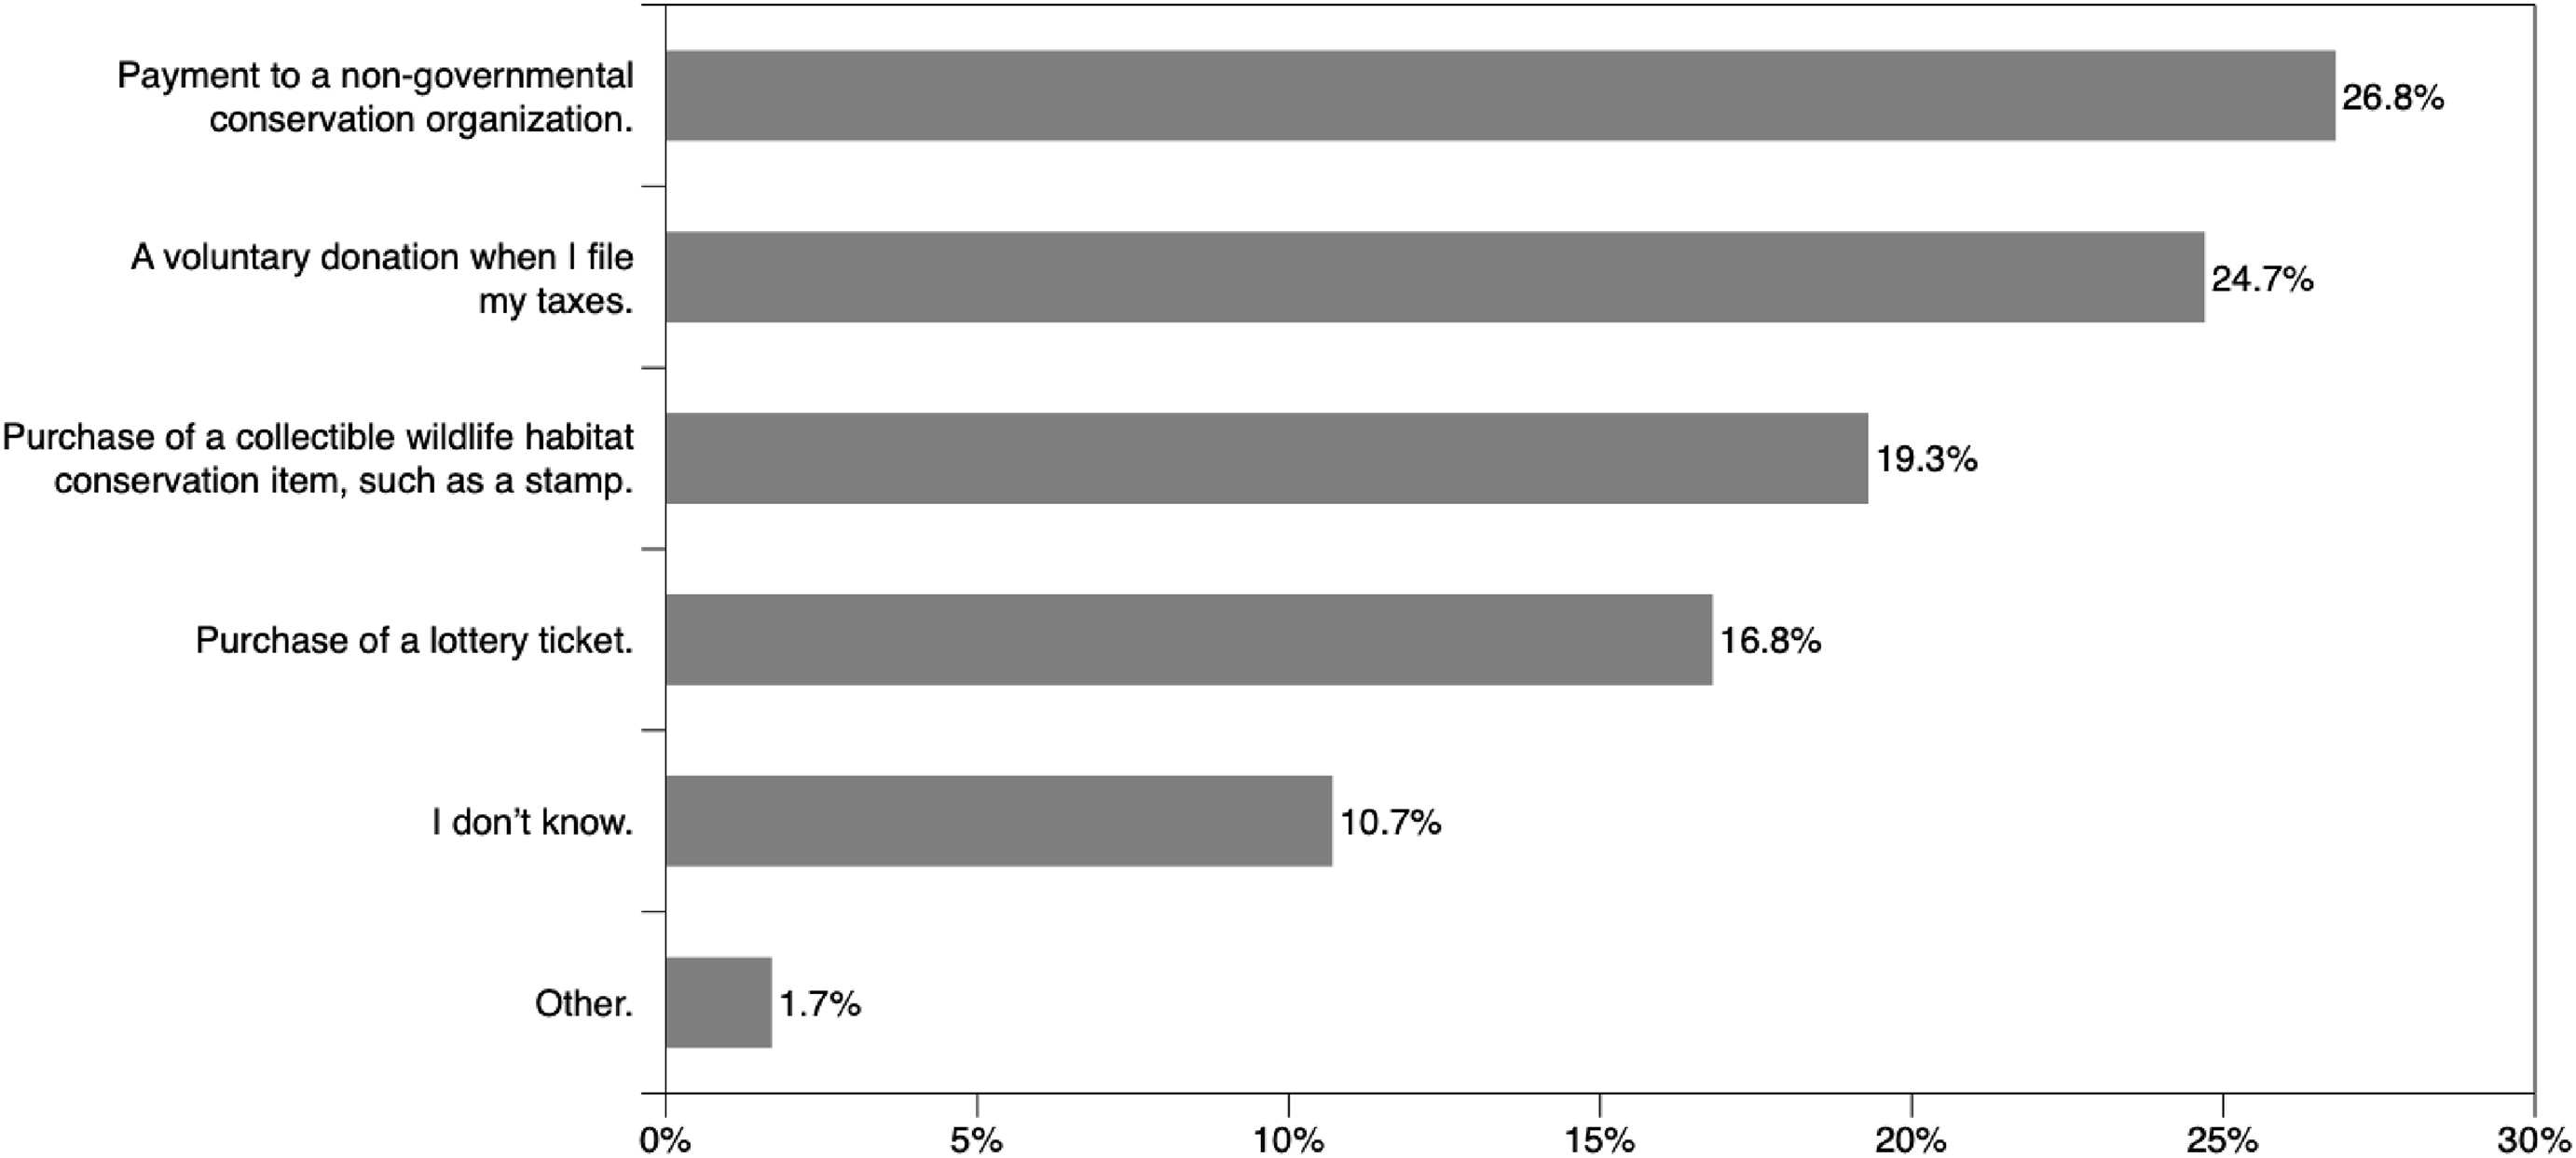
Table 5.
| Variable | χ2 | df | p value | Cohen's w |
|---|---|---|---|---|
| Income1 | 28.707 | 15 | 0.018 | 0.196 |
| Age1 | 23.023 | 15 | 0.084 | 0.177 |
| Gender identity | 6.573 | 5 | 0.254 | 0.094 |
| Joint Venture region1 | 22.967 | 20 | 0.290 | 0.176 |
| Activity count1 | 23.008 | 15 | 0.084 | 0.175 |
| Previously hunted1 | 5.903 | 5 | 0.316 | 0.089 |
| Previously birdwatched | 11.219 | 5 | 0.047 | 0.123 |
| Previously gathered | 7.219 | 5 | 0.205 | 0.098 |
1
Yates correction applied to p value due to some cell values (<20%) of <5.
“Yes” responses: preferred conservation activity
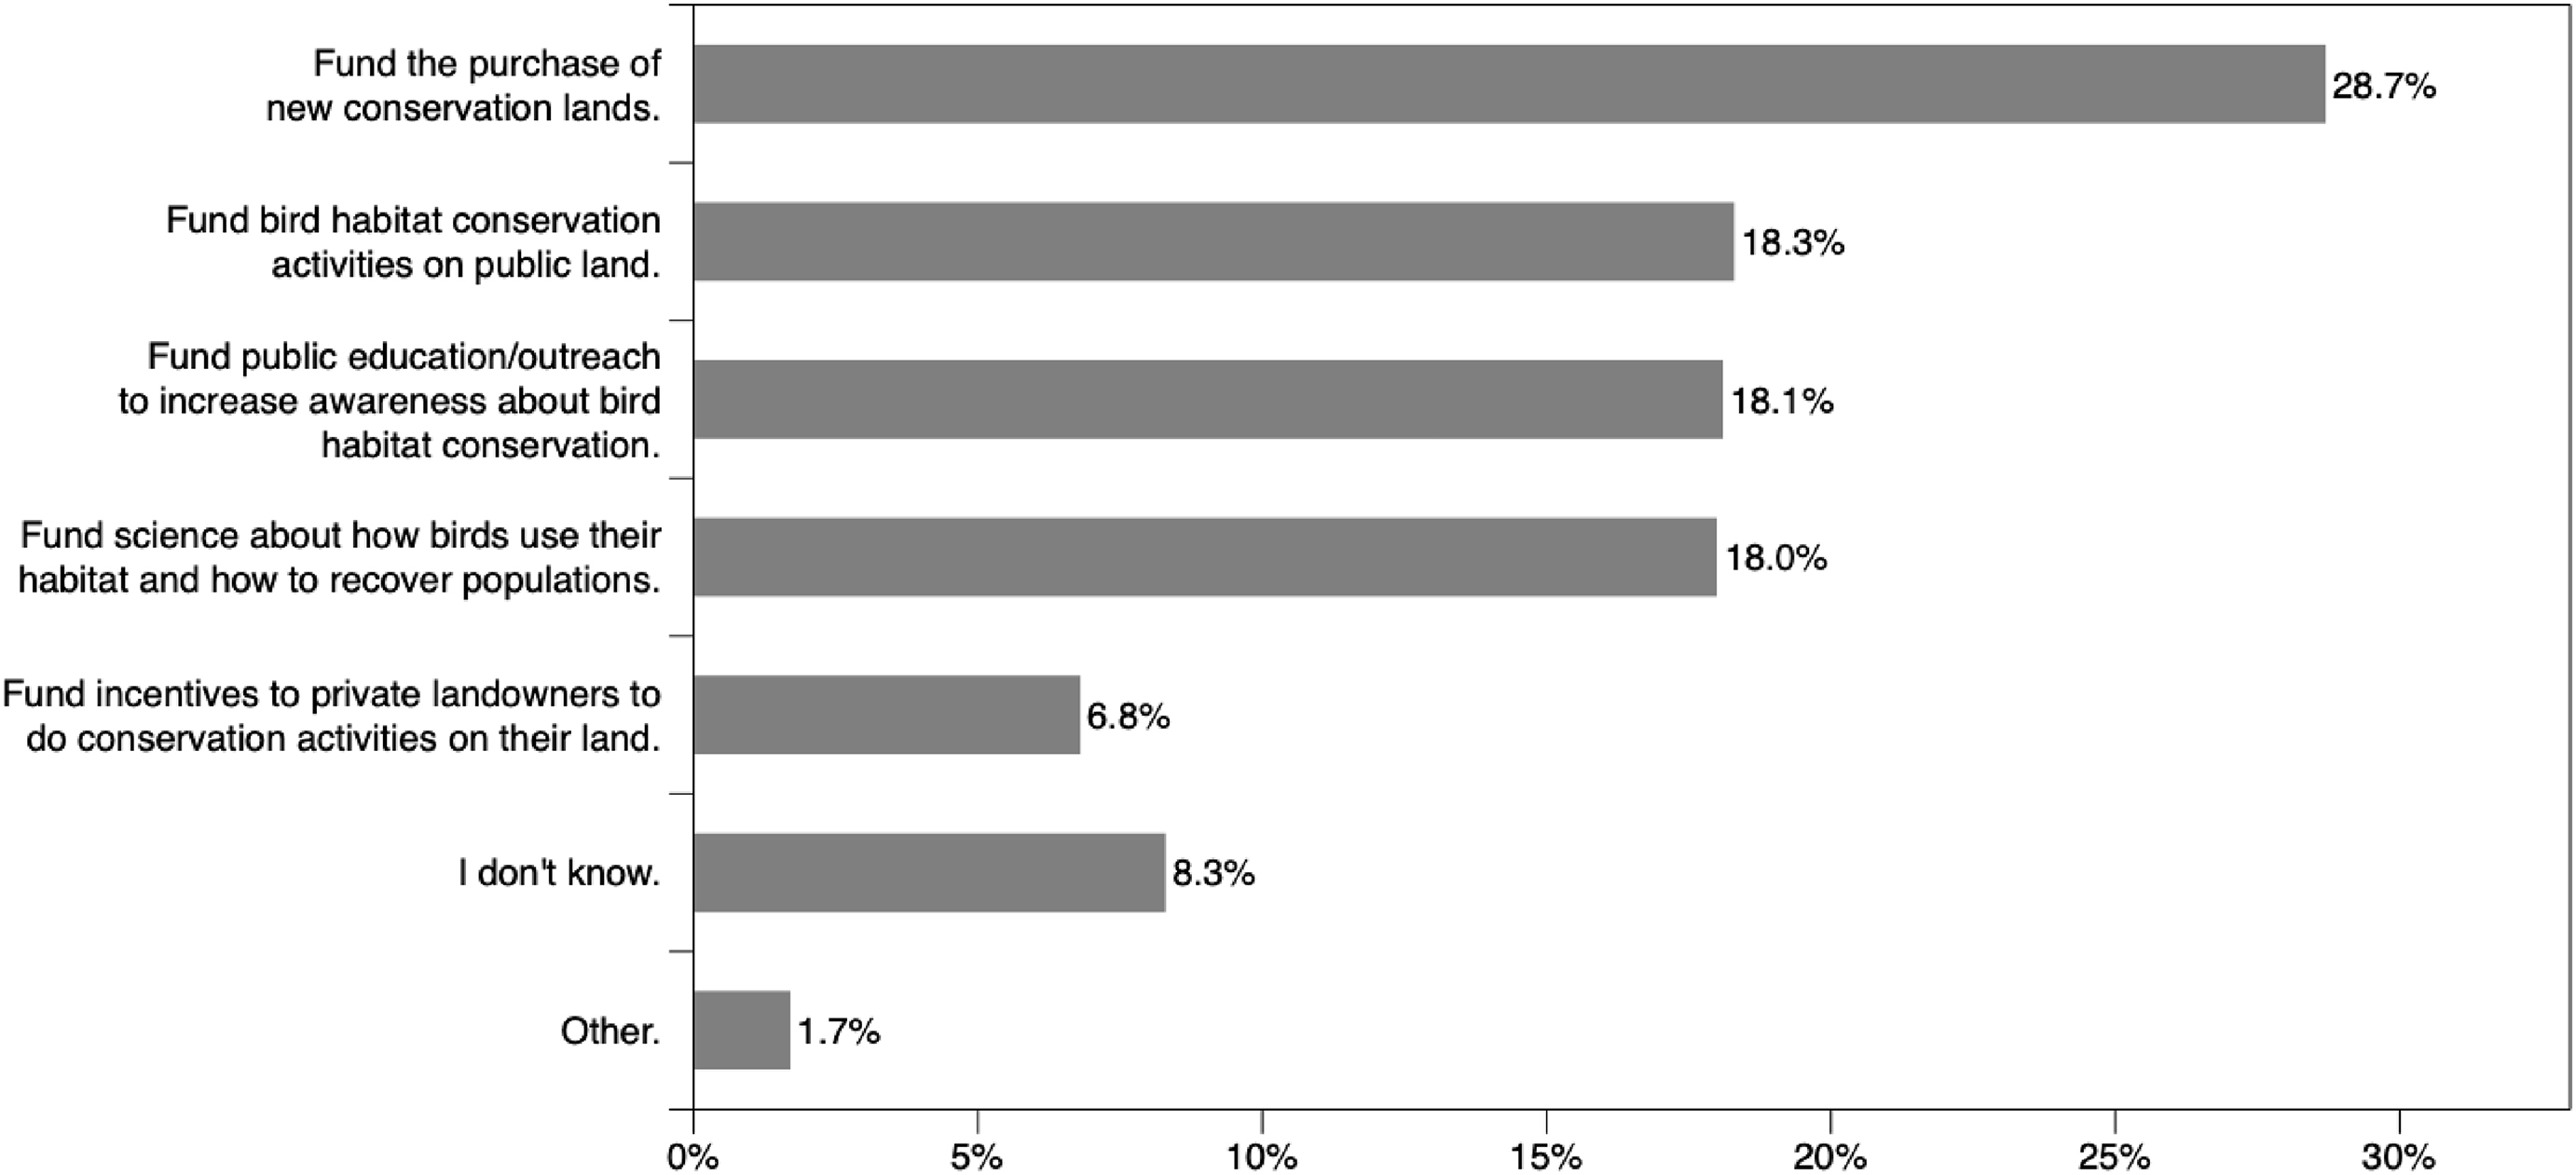
There was significant variation in preferences for how donations should be spent (χ2 = 144.380, df = 5, p = <0.001; excludes category “Other”). The most popular funding activity was the purchase of new conservation lands and the least was providing incentives to private landowners to carry out conservation on their land (Fig. 5). Only one response in “Other” (n = 14) was recategorized (into “I don't know”). The remaining “Other” responses comprised five people who preferred that NAWMP decide how to distribute the funds, four who would like the money to go wherever it was most needed, several people who wanted the donation to go to all suggested activities, and a handful of ungroupable responses.
Fig. 5.
Analyses of relationships between socio-demographic variables and willingness to donate revealed small to medium associations with number of activities participated in, birdwatching, and gender identity. Respondents who had never participated in any of the outdoor recreation activities were more likely to not know what they would prefer their donation to go towards, whereas birdwatchers were significantly less likely to choose this option. Men were more likely to support funding science, whereas women were more likely to support funding public education/outreach. Income, age, JV, and whether respondents had ever waterfowl hunted or gathered were not significantly associated with preferences for what donations would contribute towards (Table 6).
Table 6.
| Variable | χ2 | df | p value | Cohen's w |
|---|---|---|---|---|
| Income1 | 14.650 | 18 | 0.686 | 0.140 |
| Age1 | 11.821 | 18 | 0.856 | 0.126 |
| Gender identity1 | 20.408 | 6 | 0.002* | 0.166 |
| Joint Venture region1 | 38.115 | 24 | 0.033 | 0.226 |
| Activity count1 | 38.354 | 18 | 0.003* | 0.227 |
| Previously hunted1 | 6.352 | 6 | 0.385 | 0.092 |
| Previously birdwatched | 22.223 | 6 | 0.001* | 0.173 |
| Previously gathered | 9.568 | 6 | 0.144 | 0.113 |
1
Yates correction applied to p value due to some cell values (<20%) of <5.
*
Indicates statistical significance assessed using a Bonferroni adjusted alpha value of 0.006.
Discussion
Our results indicate that almost one-third of Canadians are willing to make a one-time donation to the NAWMP to protect and conserve bird habitats. Including only the confident respondents in our dataset, parametric analysis of CVM responses provides a lower-bound estimate of mean WTP a one-time donation of $33.59 ± $6.74 per person. Non-parametric analysis suggests slightly larger WTP, roughly $45.00. Applying our most conservative model results to the Canadian population (aged 15–94, n = 31 772 205, Statistics Canada 2023) suggests a total one-time donation potential of $1 067 228 366.
Our WTP estimates are broadly consistent with empirical evidence and the literature related to WTP for conservation of bird habitats. For example, Thogmartin et al. (2022) found that approximately half of Canadians would be willing to donate annually to Northern Pintail duck habitat conservation. Statistics Canada (2024) reports that approximately 18% of Canadians made charitable donations to registered charities via tax returns in 2021. Our estimate of the potential pool of donors falls between these two values and is lower than the donation history of the sample, suggesting that the estimate is reasonable and conservative. Statistics Canada (2024) data suggest that Canadians donate higher average amounts on an annual basis than our survey respondents indicated they would be willing to donate to NAWMP. It is possible that the Statistics Canada estimates are biased towards smaller numbers of larger donations and, on balance, our estimate of a larger number of potential donors (willing to give smaller amounts) seems plausible and realistic.
Much of the comparable CVM literature for bird and habitat conservation focusses on repeat donations. Our one-time donation estimate falls within the range of Whitehead's (1990) WTP estimate for annual contributions that Kentucky households were prepared to make toward a hypothetical “Wetland Preservation Fund” ($6.00–$13.00 USD per year; approximately $18.62–$40.33 CAD in 2022). However, our donation estimate is almost twice that of Haefele et al.’s (2019) WTP estimate for Canadian household annual donations to support Northern Pintail duck populations in Canada through habitat management ($11.64–$12.68 USD per year; approximately $18.08–$19.70 CAD in 2022) and larger than Zander et al.’s (2014) estimate that Australian citizens were willing to donate AUD $11 per year (roughly $12.75 CAD in 2022) to support threatened bird species conservation. In addition to different donation time frames, the difference between our estimate and Haefele et al. (2019) and Zander et al.’s (2014) may be related to scope as an artefact of the CVM positioning statement, in which we emphasized NAWMP's broad remit (i.e., support for habitat conservation for other birds and wildlife as well as waterfowl in general, and benefits to people) and successes to date, which may have generated more support than programs focused on a single bird species, or more general threatened bird species.
Socio-demographic factors and WTP
We found significant relationships between socio-demographic variables, including age, income, and gender and WTP, reasons for not donating, payment vehicle, and/or what donations should be spent on. In keeping with our expectations, we found a positive association between income and WTP (e.g., Jacobsen and Hanley 2009). Although age and gender identity were not significant in our WTP models, these characteristics were associated with preferences for payment vehicle and what donations should contribute towards. We did not find any relationship between location and WTP or in post-hoc tests, suggesting a broad geographic base of support for NAWMP. This lack of regional variation indicates that national communication campaigns to solicit donations from Canadians may be relevant if tailored to the outdoor recreation activities that people participate in, rather than where people reside.
Our finding that people who engaged in activities that rely on wildlife habitats are more willing to donate to conservation is consistent with evidence in the literature (e.g., Whitehead 1990; Haefele et al. 2019; Casola et al. 2023) and shows the importance of outdoor recreation participation as a foundation for conservation fundraising. Our study indicates that both birdwatching and plant gathering are important factors in willingness to donate to NAWMP. Encouraging engagement in these activities would be an obvious step to broaden support for conservation. There is a rich evolving literature on birdwatcher motivations (Scott et al. 1999; Hvenegaard 2002; Randler 2022), connections to conservation (Cooper et al. 2015), and WTP for birdwatching experiences (Steven et al. 2017). However, there is limited information about gathering experiences in Canada and more research would be useful to better understand the associated connections to and participation in conservation action.
Unlike other WTP/bird habitat conservation studies, we found limited evidence to suggest that waterfowl hunters were more likely to donate than the general public. The association between hunting and WTP was marginal (Model B), but this relationship disappeared when participation in other recreation activities was accounted for (Model C), indicating that hunters were only more likely to donate if they were also birdwatchers. Our results are similar to previous studies that have investigated more general participation in conservation activities, where recreationists who only hunt were found to engage less often in conservation activities than hunters who also view birds or other wildlife (Sinkular et al. 2022). This result may be due to the relatively small percentage of waterfowl hunters in our sample who did not also engage in birdwatching (2%), making detecting an effect of hunting difficult (i.e., Type II error), or it may be that, as our follow-up question for those who declined to donate cautiously indicates, waterfowl hunters are less likely to believe that wetlands and waterfowl require additional conservation support. Hunters are perhaps likely to receive communications about successful duck production to encourage them to take hunting trips, or, given that dabbling and diving duck numbers have been increasing in recent decades (NABCI 2022), this perception may result from hunting experiences. Our results did not suggest that waterfowl hunters were less likely to donate because they already donate to similar causes; it may be that waterfowl hunters consider the Canadian Wildlife Habitat Conservation Stamp as a mandatory licence purchase rather than a donation towards conservation. As waterfowl hunters are known to have heterogeneous practices and preferences (Schroeder et al. 2006, 2013; Moghimehfar et al. 2017; Sainsbury et al. 2024), additional research into the subject of waterfowl hunters’ engagement in and WTP for bird conservation seems warranted.
Importantly, our results suggest an association between wider participation in outdoor recreation activities such as waterfowl hunting, bird watching, and plant gathering on willingness to donate. Birdwatching appears to be particularly key to donation propensity, whether independently or in combination with other outdoor recreation activities. This additive effect reflects previous findings in the literature that suggest a positive association between WTP for conservation and experiences and familiarity with nature (e.g., Martín-López et al. 2007; Ren et al. 2022). While we cannot infer causation, i.e., that wider recreation participation is driving donation WTP propensity as opposed to a pre-existing affinity with nature causing both increased outdoor recreation participation and higher propensity to donate, it is possible that a diversity of outdoor experiences helps to broaden the appeal of nature and that supporting a range of engagements in natural environments (appreciative and consumptive) may help to increase people's connections with and understanding of values associated with those habitats. Our results suggest that people who engage in all three activities have the highest WTP, providing important implications for initiatives aimed at getting people actively engaged with conservation: strategies that promote bird and plant appreciation and foster a general engagement with nature (e.g., eBird, iNaturalist) may lead to contributions directed toward bird habitat conservation. Yet, funders should be mindful of donation fatigue or the possibility of crowding out contributions from existing donors when targeting recreationists that engage in multiple activites.
Donation mechanisms
We identified heterogeneity in preferences for donation payment mechanisms. Canadians chose donating via an NGO roughly as often as donating via taxation, and via wildlife collectibles such as a Duck Stamp approximately the same number of times as donating via a lottery. Therefore, to take full advantage of potential donations from the general public, managers should explore multi-pronged approaches that provide a variety of opportunities and payment mechanisms. While our estimate of mean WTP is around $30, two-thirds of respondents presented with $1 donation values were willing to donate and more than half were willing to donate $2–$24, indicating promise for mechanisms that capture smaller donations, such as on-site donation options at wetland complexes, or point of sale collections in places that sell bird-related products or outdoor recreation equipment.
The Canadian Wildlife Habitat Conservation Stamp, the only mechanism currently available for Canadians to donate directly towards NAWMP goals, garnered support from a large minority (one-fifth of respondents). Shipley et al.’s (2019) analysis of the Audubon Society bird count participants identified that birdwatchers, including non-hunting birdwatchers, do buy the U.S. Duck Stamp, providing empirical evidence that non-hunters choose to support conservation via wildlife collectibles. The Canadian Wildlife Habitat Conservation Stamp currently costs $8.50, well within the average WTP suggested by our results, suggesting an opportunity to take advantage of Canadian willingness to donate. Making charitable donations directly to specific causes when filing taxes is not currently an option available to Canadians, although payroll deductions for charitable donations are commonly used. In the U.S., there are mechanisms in some states for taxpayers to have an amount deducted from their tax refund, pay additional amount to taxes owed, or simply to make a payment of new funds, when they file their taxes. For example, California uses a “Voluntary Contribution Fund” while New York and Virginia use “Voluntary Contributions” and each state has options for taxpayers to direct their donation to wildlife and habitat conservation. The popularity of the “donation via taxation” option—almost as high as donating via an NGO—suggests that this might be a viable longer term option to explore.
Use of donations
Finally, in terms of preference for donation spending, our results suggest strong preferences for conservation on public land and the purchase of new conservation lands, both of which Canadian Habitat JV partners already engage in (e.g., NAWMP 2023). This alignment is a validation of the social license (Hampton and Teh-White 2019) for NAWMP partner actions. The lack of support for providing incentives for conservation activities on private lands suggests that private lands are seen differently than public lands. A lack of support for funding conservation on private land was similarly reflected in our focus groups, which identified issues of trust and transparency around conservation on private lands (H. Harshaw, K. Sainsbury, and P. Schuhmann unpublished data). The idea that ecosystem services of private lands (especially wetlands) provide public benefits has been documented in the academic literature (e.g., Villamagna et al. 2015), but these benefits may be poorly understood by the public. This result highlights a need to communicate the importance of working with private landowners to the public, to avoid a mismatch in expectations.
Conclusions
The NAWMP management approach to wetland and waterfowl conservation (including a concerted effort to restore, conserve, and protect core habitats) has shifted waterfowl and waterbird populations in a positive way across the continent (NABCI 2022). These successes have been underpinned by significant and consistent funding. A similar scale of funding and effort will be required to generate tangible improvements to the status of other families of birds currently in crisis, such as grassland species. Our results demonstrate widespread endorsement and financial support for much of the NAWMP-style approach to conservation across Canada. This is an important baseline position against which to measure the success of future conservation and communication campaigns. We also provide key insights into the WTP for conservation of bird habitats in Canada and in general. First, that there is a large pool of potential financial support available, with many people willing to donate small amounts. Enabling people to donate through a variety of donation mechanisms is important to maximize potential returns. Finding ways to connect with people who participate in multiple nature-based recreation activities and supporting programming that engages people with the natural world are likely to be effective ways to garner and pursue donations. Finally, although there is good support for habitat conservation as an approach, there is more to be done in terms of understanding attitudes towards working with private landowners. Given the importance of private landowners to successful conservation of species and habitats, further engagement with the public is required to ensure there is sufficient understanding of the importance of private land among supporters of bird conservation.
Acknowledgements
Funding support for this project was provided by Wildlife Habitat Canada, Environment & Climate Change Canada, the Canadian Wildlife Service, Ducks Unlimited Canada, Alberta-NAWMP, and the Social Sciences & Humanities Research Council. Katherine Sainsbury was funded by Mitacs IT18049, Ducks Unlimited Canada and the University of Alberta. Funding for open access publishing was provided by the Eastern Habitat Joint Venture and Ducks Unlimited Canada. We thank the Eastern Habitat Joint Venture, Prairie Habitat Joint Venture, Canadian Intermountain Joint Venture, and the Pacific Bird Habitat Joint Venture partners for their contributions to the survey design. Several key individuals associated with one or more of the organizations above provided significant contributions to and assistance with the design of the study, including Pierre Aquin, Jim Devries, Deanna Dixon, Mark Gloutney, Bruce Harrison, Andrew Huang, David Kostersky, Kathleen Moore, John Pattison-Williams, Catherine Poussart, and Corie White.
References
Anderson M.G., Padding P.I. 2015. The North American approach to waterfowl management: synergy of hunting and habitat conservation, International Journal of Environmental Studies, 72: 810–829.
Arrow K., Solow R., Portney P.R., Leamer E.E., Radner R., Schuman H. 1993. Report of the NOAA panel on contingent valuation. Federal Register, 58: 4601–4614.
Baker R., Ruting B. 2014. Environmental policy analysis: a guide to nonmarket valuation. Productivity Commission Staff Working Paper, Canberra.
Bishop R.C., Heberlein T.A. 2019. The contingent valuation method. In Economic valuation of natural resources: issues, theory, and applications. Edited by R.L. Johnson, G.V. Johnson. Routledge, New York, USA.pp. 81–104
Bishop R.C., Boyle K.J., Carson R.T., Chapman D., Hanemann W.M., Kanninen B., et al. 2017. Contingent valuation: flawed logic?—Response. Science, 357: 363–364.
Boyer T., Polasky S. 2004. Valuing urban wetlands: a review of non-market valuation studies. Wetlands, 24: 744–755.
Brouwer R., Langford I.H., Bateman I.J., Turner R.K. 1999. A meta-analysis of wetland contingent valuation studies. Regional Environmental Change, 1: 47–57.
Brouwer R., van Beukering P., Sultanian E. 2008. The impact of the bird flu on public willingness to pay for the protection of migratory birds. Ecological Economics, 64: 575–585.
Bryan H. 2000. Recreation specialization revisited. Journal of Leisure Research, 32: 18–21.
Carson R.T. 2000. Contingent valuation: a user's guide. Environmental Science and Technology, 34: 1413–1418.
Carson R.T. 2012. Contingent valuation: a practical alternative when prices aren't available. Journal of Economic Perspectives, 26: 27–42.
Carson R.T., Hanemann W.M. 2005. Contingent valuation. Handbook of Environmental Economics, 2: 821–936.
Casola W.R., Peterson M.N., Pacifici K., Sills E.O., Moorman C.E. 2023. Conservation motivations and willingness to pay for wildlife management areas among recreational user groups. Land Use Policy, 132: 106801.
Champ P.A., Bishop R.C. 2001. Donation payment mechanisms and contingent valuation: an empirical study of hypothetical bias. Environmental and Resource Economics, 19: 383–402.
Champ P.A., Bishop R.C., Brown T.C., McCollum D.W. 1997. Using donation mechanisms to value non-use benefits from public goods. Journal of Environmental Economics and Management, 33: 151–162.
Clucas B., Rabotyagov S., Marzluff J.M. 2015. How much is that birdie in my backyard? A cross-continental economic valuation of native urban songbirds. Urban Ecosystems, 18: 251–266.
Cohen J. 1988. Statistical power analysis for the behavioral sciences. 2nd ed. Erlbaum, Hillsdale, NJ, USA.
Cooper C., Larson L., Dayer A., Stedman R., Decker D. 2015. Are wildlife recreationists conservationists? Linking hunting, birdwatching, and pro-environmental behavior. The Journal of Wildlife Management, 79: 446–457.
Cosma S., Rimo G., Cosma S. 2023. Conservation finance: what are we not doing? A review and research agenda. Journal of Environmental Management, 336: 117649.
Cummings R.G., Taylor L.O. 1999. Unbiased value estimates for environmental goods: a cheap talk design for the contingent valuation method. American Economic Review, 89: 649–665.
Devers P.K., Roberts A.J., Knoche S., Padding P.I., Raftovich R. 2017. Incorporating human dimensions objectives into waterfowl habitat planning and delivery. Wildlife Society Bulletin, 15: 91–415.
Diamond P.A., Hausman J.A. 1994. Contingent valuation: is some number better than no number? Journal of Economic Perspectives, 8: 45–64.
Dias V., Belcher K. 2015. Value and provision of ecosystem services from prairie wetlands: a choice experiment approach. Ecosystem Services, 15: 35–44.
Environment Canada. 2004. Menaces pour la disponibilite de l'eau au Canada[Threats on the availability of water in Canada]. Burlington, Ontario: Institut national de recherche scientifique. Rapport no3, Se rie de rapports d'e valuation scientifique de l'INRE et Se rie de documents d'e valuation de la science de la DGSAC, numero 1. 148p.
Field A., Miles J., Field Z. 2012. Discovering Statistics using R. Sage, London.
Fischer L.K., Kowarik I. 2020. Connecting people to biodiversity in cities of tomorrow: is urban foraging a powerful tool? Ecological Indicators, 112: 106087.
Fluet-Chouinard E., Stocker B.D., Zhang Z., Malhotra A., Melton J.R., Poulter B., et al. 2023. Extensive global wetland loss over the last three centuries. Nature, 614: 281–286.
Greene W.H. 2016. NLogit 6.0 User Manual. Econometrics Software, Inc. New York.
Haab T., Lewis L.Y., Whitehead J. 2020. State of the art of contingent valuation. Oxford Research Encyclopedia of Environmental Science.
Haab T.C., McConnell K.E. 2002. Valuing environmental and natural resources: the econometrics of non-market valuation. Edward Elgar Publishing.
Haab T.C., Interis M.G., Petrolia D.R., Whitehead J.C. 2013. From hopeless to curious? Thoughts on Hausman's “dubious to hopeless” critique of contingent valuation. Applied Economic Perspectives and Policy, 35: 593–612.
Haefele M.A., Loomis J.B., Lien A.M., Dubovsky J.A., Merideth R.W., Bagstad K.J., et al. 2019. Multi-country willingness to pay for transborder migratory species conservation: a case study of northern pintails. Ecological Economics, 157: 321–331.
Hampton J.O., Teh-White K. 2019. Animal welfare, social license, and wildlife use industries. The Journal of Wildlife Management, 83: 12–21.
Hanemann W. 1994. Contingent valuation and economics. Working Paper No. 697. Department of Agricultural & Resource Economics, California Agricultural Experiment Station, University of California, Berkeley.
Hanemann W.M. 1984. Welfare evaluations in contingent valuation experiments with discrete responses. American Journal of Agricultural Economics, 66: 332–341.
Harshaw H.W., Sainsbury K.A. 2023. National Bird Habitat Conservation Survey: Canadian National Technical Report. Faculty of Kinesiology, Sport, and Recreation, University of Alberta, Edmonton, AB.
He J., Dupras J., Poder T.G. 2017. The value of wetlands in Quebec: a comparison between contingent valuation and choice experiment. Journal of Environmental Economics and Policy, 6: 51–78.
Howerter D., Anderson M., Eggeman D., Fleming K., Smith D., Vrtiska M., et al. 2024. Technical report in support of the 2024 update of the North American Waterfowl Management Plan. Available from: https://nawmp.org/sites/default/files/2024-04/combined-2024-nawmp-technical-report-4-4-24.pdf [accessed 27 February 2025].
Humburg D.D., Anderson M.G., Brasher M.G., Carter M.F., Eadie J.M., Fulton D.C., et al. 2018. Implementing the 2012 North American Waterfowl Management Plan revision: populations, habitat, and people. The Journal of Wildlife Management, 82: 275–286.
Hvenegaard G.T. 2002. Birder specialization differences in conservation involvement, demographics, and motivations. Human Dimensions of Wildlife, 7(1): 21–36.
Hynes S., Hanley N. 2009. The “crex crex” lament: estimating landowners willingness to pay for corncrake conservation on Irish farmland. Biological Conservation, 142: 180–188.
Jacobsen J.B., Hanley N. 2009. Are there income effects on global willingness to pay for biodiversity conservation? Environmental and Resource Economics, 43: 137–160.
Jin J., Wang Z., Liu X. 2008. Valuing black-faced spoonbill conservation in Macao: a policy and contingent valuation study. Ecological Economics, 68: 328–335.
Kaval P., Roskruge M. 2009. The value of native bird conservation: a New Zealand case study. Department of Economics Working Paper Series, Number 09/11. University of Waikato, Hamilton, New Zealand.
Kling C.L., Phaneuf D.J., Zhao J., 2012. From Exxon to BP: has some number become better than no number? Journal of Economic Perspectives, 26: 3–26.
Ladenburg J., Olsen S.B. 2014. Augmenting short cheap talk scripts with a repeated opt-out reminder in choice experiment surveys. Resource & Energy Economics, 37: 39e63.
Lantz V., Boxall P.C., Kennedy M., Wilson J. 2013. The valuation of wetland conservation in an urban/peri urban watershed.Regional Environmental Change, 13: 939–953.
Lee C.K., Lee J.H., Mjelde J.W., Scott D., Kim T.K. 2009. Assessing the economic value of a public birdwatching interpretative service using a contingent valuation method. International Journal of Tourism Research, 11: 583–593.
List J.A. 2001. Do explicit warnings eliminate the hypothetical bias in elicitation procedures? Evidence from field auctions for sportscards. American Economic Review, 91: 1498–1507.
Lüdecke D. 2022. sjPlot: data visualization for statistics in Social science. R package version 2.8.11. Available from https://CRAN.R-project.org/package=sjPlot [accessed 27 February 2025].
Lyssenko N., Martínez-Espiñeira R. 2012. Respondent uncertainty in contingent valuation: the case of whale conservation in Newfoundland and Labrador. Applied Economics, 44: 1911–1930.
MacMillan D., Hanley N., Daw M. 2004. Costs and benefits of wild goose conservation in Scotland. Biological Conservation, 119: 475–485.
Martín-López B., Montes C., Benayas J. 2007. The non-economic motives behind the willingness to pay for biodiversity conservation. Biological Conservation, 139: 67–82.
Martín-López B., Montes C., Benayas J. 2008. Economic valuation of biodiversity conservation: the meaning of numbers. Conservation Biology, 22: 624–635.
McHugh M.L. 2013. The chi-square test of independence. Biochemia Medica, 23: 143–149.
McLain R.J., Hurley P.T., Emery M.R., Poe M.R. 2014. Gathering “wild” food in the city: rethinking the role of foraging in urban ecosystem planning and management. Local Environment, 19: 220–240.
Millenium Ecosystem Assessment [MEA]. 2005a. Ecosystems and Human Well-Being: Synthesis. Island Press, Washington, DC.
Millennium Ecosystem Assessment [MEA]. 2005b. Ecosystems and human well-being: wetlands and water synthesis. World Resources Institute, Washington, DC.
Moghimehfar F., Harshaw H.W., Foote L. 2017. Hunting tourism: the case of Canadian prairie waterfowl hunters. In Wildlife tourism, environmental learning and ethical encounters: ecological and conservation aspects. Edited by I. Borges de Lima, R.J. Green. Springer International Publishing. pp. 273–3288.
Myers K., Parsons G., Train K. 2017. Inadequate response to frequency of payments in contingent valuation of environmental goods. In Contingent valuation of environmental goods. A comprehensive critique. Edited by D. McFadden, K. Train. Edward Elgar Publishing, Inc., Massachusetts, USA. pp. 43–357.
Myers K.H., Parsons G.R., Edwards P.E. 2010. Measuring the recreational use value of migratory shorebirds on the Delaware Bay. Marine Resource Economics, 25: 247–264.
Nicholas G.P. 1998. Wetlands and hunter-gatherers: a global perspective. Current Anthropology, 39: 720–731.
North American Bird Conservation Initiative [NABCI]. 2022. The State of the Birds, United States of America, 2022. Available from http://www.stateoftheBirds.org [accessed 27 February 2025].
North American Waterfowl Management Plan [NAWMP]. 2012. North American Waterfowl Management Plan 2012: people conserving waterfowl and wetlands. Available from https://nawmp.org/sites/default/files/2017-12/NAWMP-Plan-EN-may23_0.pdf [accessed 27 February 2025].
North American Waterfowl Management Plan [NAWMP]. 2023. Habitat Matters: 2022 Canadian NAWMP Report. Available from https://nawmp.wetlandnetwork.ca/Media/Content/files/HM2023-en-web%5B1%5D.pdf [accessed 27 February 2025].
North American Waterfowl Management Plan Canada [NAWMP]. 2023. Canadian Habitat Joint Ventures. Available from https://nawmp.wetlandnetwork.ca/joint-venture/habitat-joint-ventures/ [accessed 27 February 2025].
Pattison J., Boxall P.C., Adamowicz W.L. 2011. The economic benefits of wetland retention and restoration in Manitoba. Canadian Journal of Agricultural Economics/Revue canadienne d'agroeconomie, 59: 223–244.
Penn J., Hu W. 2019. Cheap talk efficacy under potential and actual hypothetical bias: a meta-analysis. Journal of Environmental Economics and Management, 96: 22–35.
Plieninger T., Bieling C., Fagerholm N., Byg A., Hartel T., Hurley P., et al. 2015. The role of cultural ecosystem services in landscape management and planning. Current Opinion in Environmental Sustainability, 14: 28–33.
Poe M.R., LeCompte J., McLain R., Hurley P. 2014. Urban foraging and the relational ecologies of belonging. Social & Cultural Geography, 15: 901–919.
R Core Team. 2022. R: a language and environment for statistical computing. R Foundation for Statistical Computing, Vienna, Austria. Available from https://www.R-project.org/ [accessed 27 February 2025].
Randler C. 2022. Motivations and specialization of birders are differently related to engagement in citizen science projects of different complexity. Behavioral Sciences, 12: 395.
Ren Y., Ding C., Zhang Y., Qing B., Duan W. 2022. Public attitudes and willingness to pay toward the conservation of Crested Ibis: insights for management. Journal for Nature Conservation, 66: 126118.
Roberts A.J., Devers P.K., Knoche S., Padding P.I., Raftovich R. 2017. Site preferences and participation of waterbird recreationists: using choice modelling to inform habitat management. Journal of Outdoor Recreation & Tourism, 20: 52–59.
Sainsbury K.A., Harshaw H.W., Fulton D.C., Cole N.W., Dayer A.A., Duberstein J.N., et al. 2024. What waterfowl hunters want: exploring heterogeneity in hunting trip preferences. Wetlands, 44: 35.
Sarker R., McKenney D.W. 1992. Measuring unpriced values: an economic perspective and annotated bibliography for Ontario. Forestry Canada, Ontario Region, Sault Ste. Marie, Ontario. Information Report O-X-422. 29p.
Schroeder S.A., Fulton D.C., Lawrence J.S. 2006. Managing for preferred hunting experiences: a typology of Minnesota waterfowl hunters. Wildlife Society Bulletin, 34: 380–387.
Schroeder S.A., Fulton D.C., Lawrence J.S., Cordts S.D. 2013. Identity and specialization as a waterfowl hunter. Leisure Sciences, 35: 218–234.
Scott D., Baker S.M., Kim C. 1999. Motivations and commitments among participants in the great Texas birding classic. Human Dimensions of Wildlife, 4: 50–67.
Shackleton C.M., Hurley P.T., Dahlberg A.C., Emery M.R., Nagendra H. 2017. Urban foraging: a ubiquitous human practice overlooked by urban planners, policy, and research. Sustainability, 9: 1884.
Shipley N.J., Larson L.R., Cooper C.B., Dale K., LeBaron G., Takekawa J. 2019. Do birdwatchers buy the duck stamp? Human Dimensions of Wildlife, 24: 61–70.
Sinkular E.N., Dayer A.A., Barnes J.C., Pototsky P.C., Plante S.D., Jennings K.K., Chaves W.A. 2022. National and Regional Results from the Wildlife Viewer Survey: Enhancing Relevancy and Engaging Support from a Broader Constituency. Virginia Tech. Available from http://hdl.handle.net/10919/111539 [accessed 27 February 2025].
Statistics Canada. 2023. (table). Census Profile. 2021 Census of Population. Statistics Canada Catalogue no. 98-316-X2021001. Ottawa. Available from https://www12.statcan.gc.ca/census-recensement/2021/dp-pd/prof/index.cfm?Lang=E [accessed 15 November 2023].
Statistics Canada. 2024. Table 11-10-0130-01. Summary of charitable donors.
Steven R., Smart J.C., Morrison C., Castley J.G. 2017. Using a choice experiment and birder preferences to guide bird-conservation funding. Conservation Biology, 31: 818–827.
Svizzero S. 2016. Foraging wild resources: evolving goals of an ubiquitous human behavior. Anthropology News, 4: 1000159.
Teel T.L., Manfredo M.J., Simmons B.A., Tran T. 2022. Canada's Wildlife Values: The Social Context of Wildlife Management in Canada. National Report for Wildlife Habitat Canada. Colorado State University, Department of Human Dimensions of Natural Resources, Fort Collins, CO:
Thogmartin W.E., Haefele M.A., Diffendorfer J.E., Semmens D.J., Derbridge J.J., Lien A., et al. 2022. Multi-species, multi-country analysis reveals North Americans are willing to pay for transborder migratory species conservation. People and Nature, 4: 549–562.
Van Asselen S.V., Verburg P.H., Vermaat J.E., Janse J.H. 2013. Drivers of wetland conversion: a global meta-analysis. PloS ONE, 8: e81292.
Villamagna A., Scott L., Gillespie J. 2015. Collateral benefits from public and private conservation lands: a comparison of ecosystem service capacities. Environmental Conservation, 42: 204–215.
Volker M.A. 2006. Reporting effect size estimates in school psychology research. Psychology in the Schools, 43: 653–672.
Vrtiska M.P., Gammonley J.H., Naylor L.W., Raedeke A.H. 2013. Economic and conservation ramifications from the decline of waterfowl hunters. Wildlife Society Bulletin, 37: 380–388.
Whitehead J.C. 1990. Measuring willingness-to-pay for wetlands preservation with the contingent valuation method. Wetlands, 10: 187–201.
Whitehead J.C., Blomquist G.C. 2006. The use of contingent valuation in benefit-cost analysis. In Handbook on contingent valuation. Edited by A. Alberini, J.R. Kahn. Edward Elgar Publishing, 92–3115. 448 p.
Wickham H., Averick M., Bryan J., Chang W., McGowan L.D., François R., et al. 2019. Welcome to the tidyverse. Journal of Open Source Software, 4: 1686.
Williams B.K., Koneff M.D., Smith D.A. 1999. Evaluation of waterfowl conservation under the North American Waterfowl Management Plan. The Journal of Wildlife Management, 63: 417–440.
Zander K.K., Ainsworth G.B., Meyerhoff J., Garnett S.T. 2014. Threatened bird valuation in Australia. Plos ONE, 9: e100411.
Zedler J.B., Kercher S. 2005. Wetland resources: status, trends, ecosystem services, and restorability. Annual Review of Environment and Resources, 30: 39–74.
Supplementary material
Supplementary Material 1 (DOCX / 33 KB).
- Download
- 32.23 KB
Information & Authors
Information
Published In
FACETS
Volume 10 • 2025
Pages: 1 - 15
Editor: David Lesbarrères
History
Received: 16 September 2024
Accepted: 15 January 2025
Version of record online: 20 March 2025
Copyright
© 2025 Authors Sainsbury, Harshaw, Schuhmann; and Association of Fish and Wildlife Agencies. This work is licensed under a Creative Commons Attribution 4.0 International License (CC BY 4.0), which permits unrestricted use, distribution, and reproduction in any medium, provided the original author(s) and source are credited.
Data Availability Statement
Data generated or analyzed during this study are available in the Borealis repository: https://borealisdata.ca/dataset.xhtml?persistentId=doi:10.5683/SP3/LHQABU.
Key Words
Sections
Subjects
Plain Language Summary
One-third of Canadians willing to donate to waterfowl and wetland conservation
Authors
Author Contributions
Conceptualization: KAS, HWH, PWS, DS
Data curation: KAS, HWH
Formal analysis: KAS, PWS
Funding acquisition: KAS, HWH
Investigation: KAS, HWH, PWS
Methodology: KAS, HWH, PWS
Project administration: HWH
Resources: HWH
Software: HWH
Supervision: HWH, PWS
Validation: KAS, HWH, PWS
Visualization: KAS, HWH, PWS
Writing – original draft: KAS, HWH, PWS
Writing – review & editing: KAS, HWH, PWS, DS
Competing Interests
The authors have no relevant financial or non-financial interests to disclose.
Funding Information
Canadian Wildlife Service
Mitacs: IT18049
Alberta-NAWMP Partnership
Metrics & Citations
Metrics
Other Metrics
Citations
Cite As
K.A. Sainsbury, H.W. Harshaw, P.W. Schuhmann, and D. Smith. 2025. What are Canadians willing to pay for bird habitat conservation? A contingent valuation approach. FACETS.
10: 1-15.
https://doi.org/10.1139/facets-2024-0164
Export Citations
If you have the appropriate software installed, you can download article citation data to the citation manager of your choice. Simply select your manager software from the list below and click Download.
There are no citations for this item