Data
Our study population is all Canadian university faculty members who received at least one NSERC Discovery grant through the Evolution and Ecology evaluation committee from 1991 to 2019 (
N = 1244). NSERC Discovery Grants are the main source of research funding for ecology and evolution researchers in Canadian universities, providing a useful means of identifying active researchers in this area. We realize that some researchers who consider themselves ecologists or evolutionary biologists hold Discovery Grants through other committees. It is also possible to have a successful research career while never holding a Discovery Grant. Nonetheless, this is a simple and unambiguous criterion for defining our study population. We focus on this group of scientists for three reasons: (1) ecology and evolution researchers are strong users of the WG method. The first synthesis science center in ecology and evolution, NCEAS (National Center for Ecological Analysis and Synthesis) was established in the U.S. in 1995 (
Hampton and Parker 2011) and the number of similar synthesis centers worldwide has now grown to 16; (2) Canadian researchers have been active in synthesis science WGs from the beginning, with WG publications appearing soon after the first synthesis center was established. Canadian researchers have participated in WGs in Canada and internationally. Canada’s own synthesis center, CIEE (Canadian Institute of Ecology and Evolution), started in 2008 and since then more than 500 researchers have taken part in WGs organized by CIEE; (3) women comprise 23% of this study population; i.e., there is a gender imbalance to examine, but still enough women for meaningful statistical analysis.
We collected information on researchers’ assumed gender, year of PhD and all affiliated institutions (to aid in the matching of researcher names and outputs) through their careers from publicly available sources (Supplemental Information: Appendix 1). We coded gender (man, woman) from first names (where strongly associated with gender) and from pronouns and photographs on current websites. We acknowledge that such assumptions necessarily have a small degree of error: we may have mis-assigned gender in some cases or failed to capture non-binary or dynamic gender identities. The online sources for biographic information, from the most preferred to the least preferred, included curriculum vitae, websites of the researcher’s current institution, personally-maintained website of the researcher, websites of the researcher’s former institution(s), LinkedIn, Research Gate, Google Scholar, and other sources such as obituaries. Missing data are unavoidable since some information is not available from open sources. We initially identified 1405 researchers from the NSERC Discovery Grants database. However, 161 entries were excluded due to missing data, resulting in a final sample of 1244 individuals.
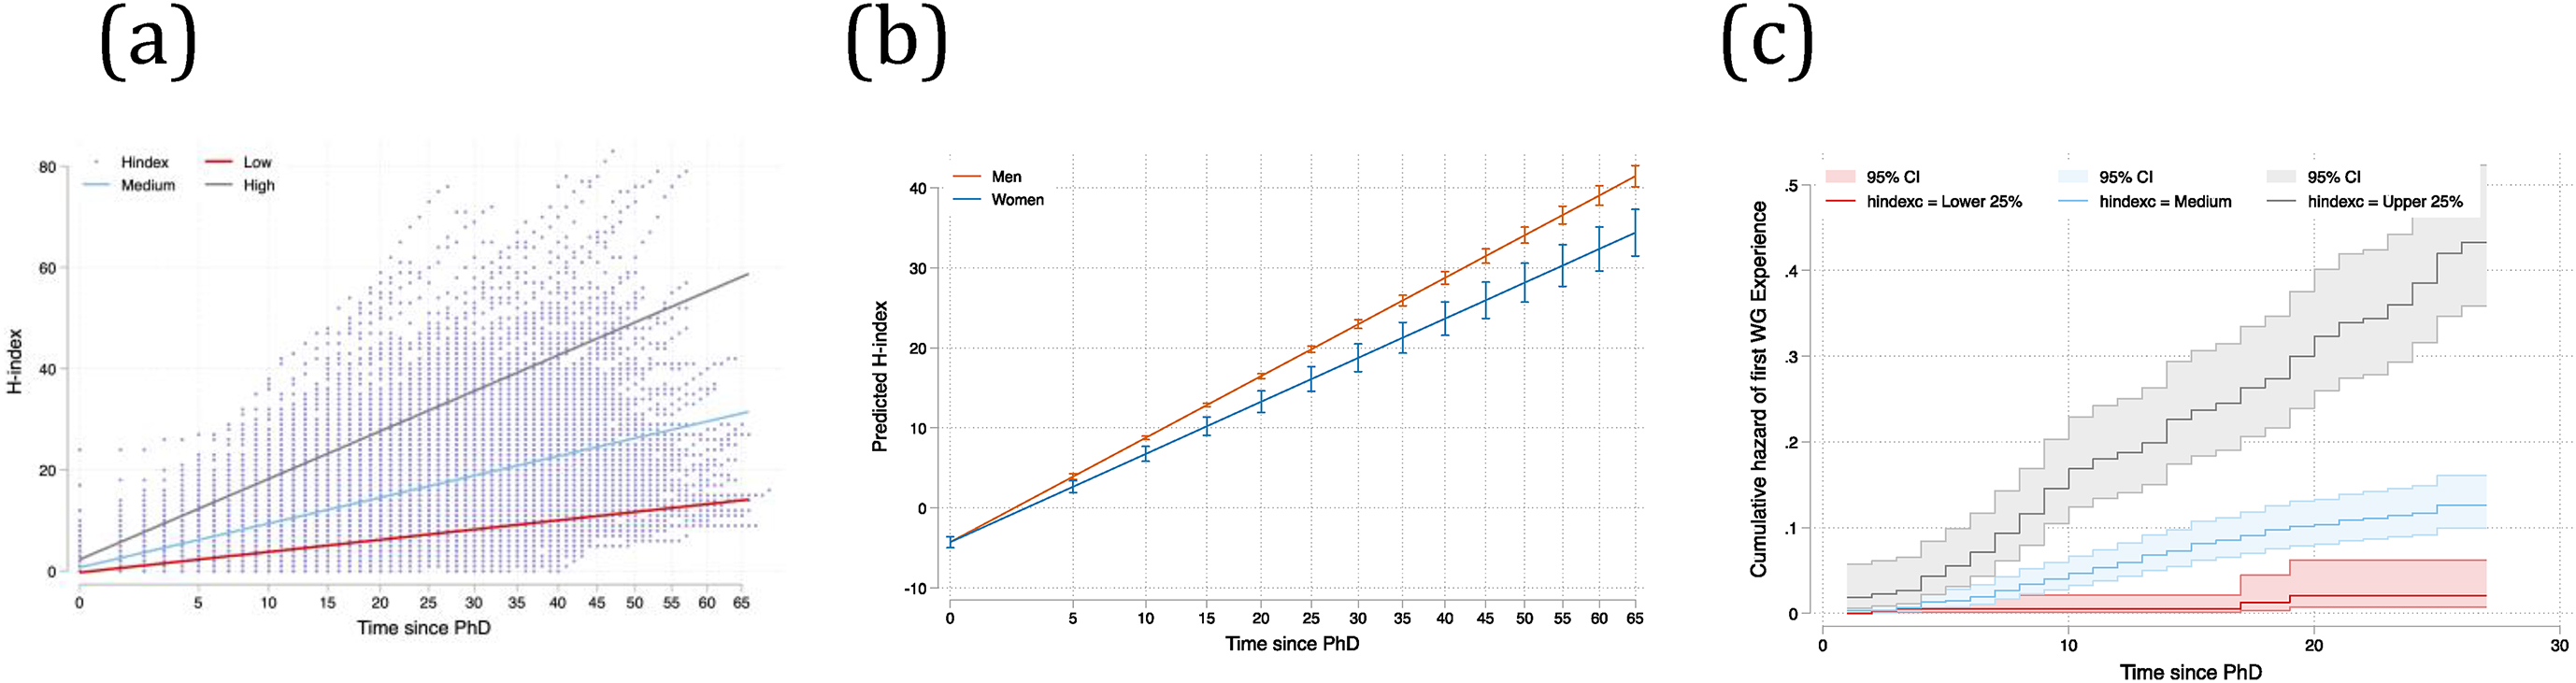
For each researcher, we quantified the trajectory of their publication impact using the H-index. A researcher has an H-index of
H when they have published at least
H publications, each of which is cited at least
H times. The rate at which a researcher’s H-index increases through time describes the growth of their career publication impact. Please note that our focus on H-index as a response variable in our analyses should not be taken as advocacy for this index as a reliable indicator of scientific impact. Instead, we use this index simply because it is so widely used—or misused—as an indicator of impact (
Koltun and Hafner 2021). Indeed, our analyses add to previous work that shows systemic gender bias in this index.
We constructed each researcher’s longitudinal H-index using (1) a retrospective publication record of their peer-reviewed articles and (2) the yearly distribution of citation counts for each publication. To our knowledge, there is no free, publicly available, and readily formatted data source that captures the H-index over time at the individual-researcher level.
To reconstruct a retrospective publication record of each researcher, we started with the Web of Science Core Collection (hereafter, WOS) as 36% of researchers, especially older researchers (modal PhD year = 1972), had no other online publication record. There are several challenges in developing this publication record. First, because WOS uses initials of all names but the surname, there is a possibility of erroneously including publications by other scholars with similar names (e.g., Jane Doe vs. John Doe), a type of false positive. Second, researchers with middle names can vary in which initials they include in their name across publications (e.g., a WOS search on JM Doe would not include publications under J Doe), a type of false negative. Finally, researchers may change their names during their publication career (e.g., with marriage). We developed a Python-based workflow (described in full in Supplemental Information: Appendix 2), to reduce both the false positives and false negatives within the constraints of WOS. In brief, this workflow uses the researcher’s full last name and first initial of their first name (based on all name variations in our database) to download from WOS all publications starting from 5 years prior to their PhD until 2019. This creates a large pool of potential publications (mean of 504 publications per researcher), which is subsequently filtered to a clean subset by cross-referencing with known variants in authorship names for the researcher (from online curriculum vitae or Google Scholar profile) as well as their institutional affiliations, fuzzy matching of publication titles from curriculum vitae or Google Scholar profile where possible, and recursive identification of previously unidentified affiliations to fine-tune the cross-referencing procedure. Once we had cleaned the publication record, we then calculated cumulative citations over years for each publication from WOS yearly citation counts as a precursor to calculating the H-index.
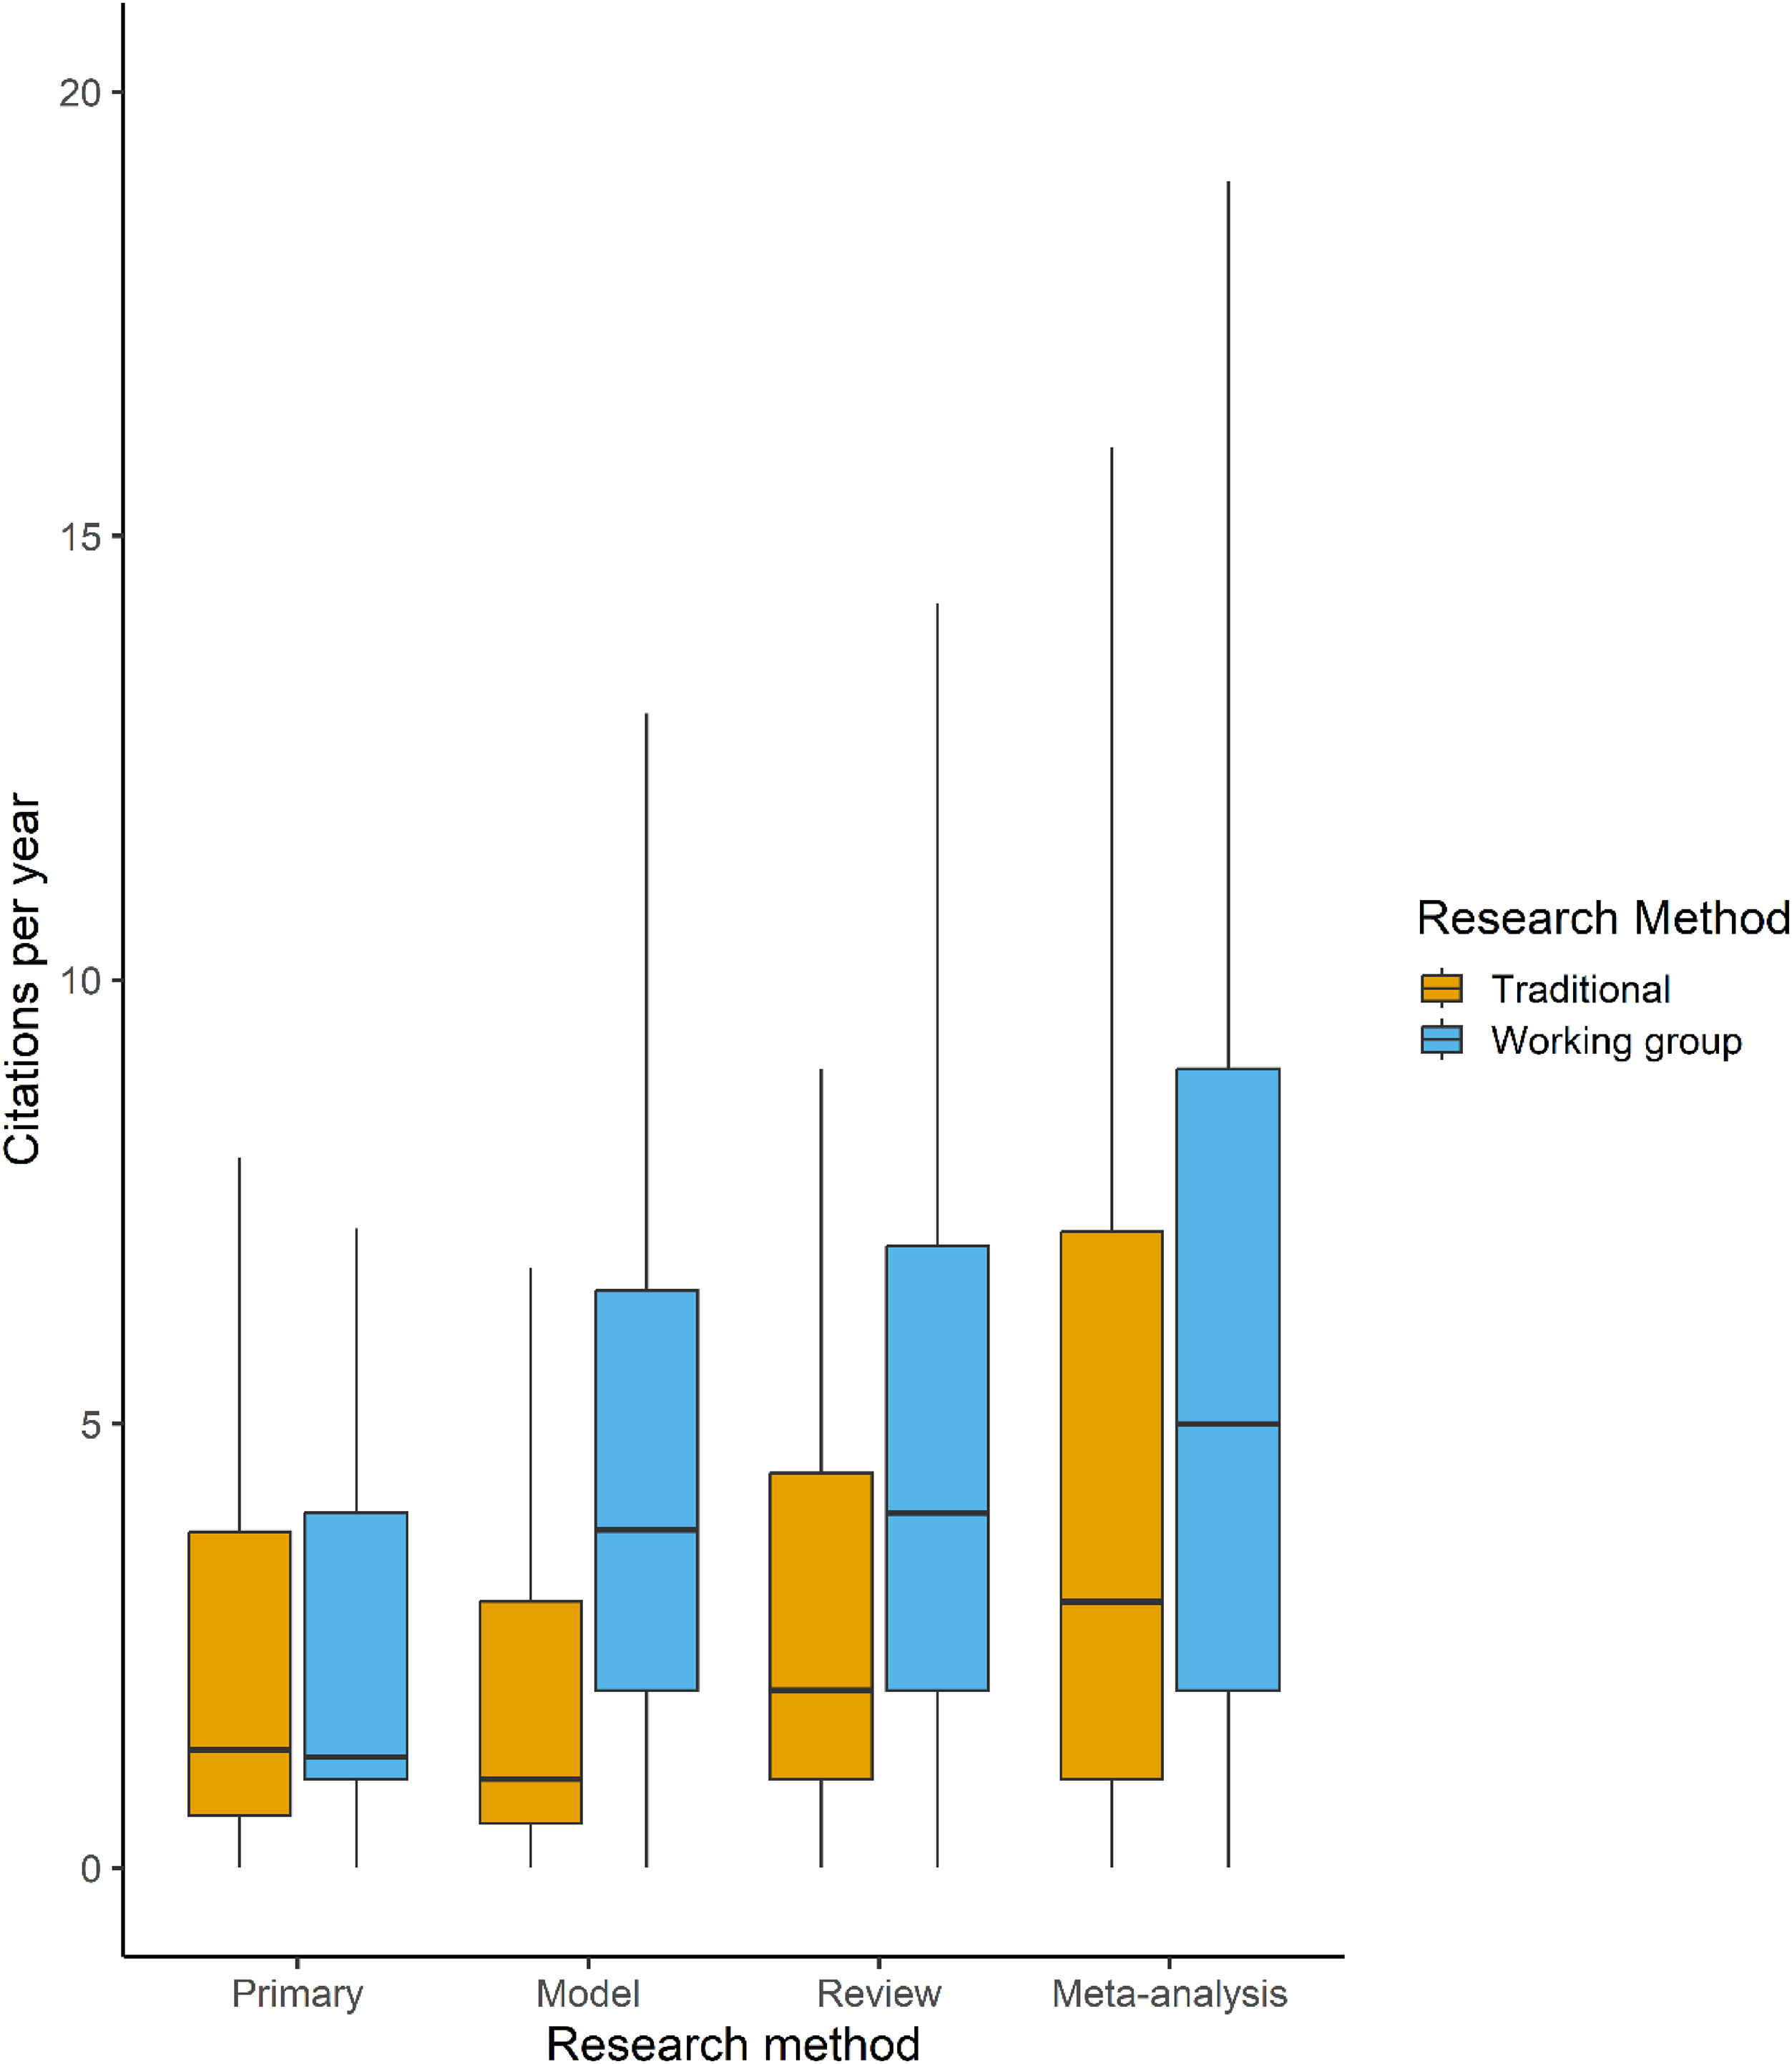
Our analysis also required us to identify which publications are products of WGs. To achieve this, we matched WOS titles with known WG publications funded by the 15 synthesis centers that comprise the International Synthesis Consortium (publication lists from synthesis center websites or obtained directly from centers), or by searching the funding and acknowledgement sections of publications for synthesis center names or acronyms (Supplemental Information: Appendix 3, Table A1). We captured WGs funded through other organizations or mechanisms by searching for keywords commonly used to describe WGs (“WG”, “synthesis group”, “synthesis WG”, “synthesis committee”, “synthesis workshop”, “catalysis group”). All publications were then manually validated by two researchers experienced in biology and synthesis research, and coded as primary research versus synthesis research, and as WG method versus non-WG method. We further categorized synthesis research publications into the following types: statistical synthesis (statistical analysis of previously published or archived data collected by multiple different researchers and/or studies), conceptual synthesis (qualitative review of the literature or proposal of new frameworks for scientific concepts or investigation), or mathematical synthesis (theoretical mathematical models or specific application of general models for the purpose of prediction).
We scored non-WG publications using similar criteria. However, given the large number of publications involved, we changed methods to allow for programmatic approaches to identify publications based on keywords indicative of the three types of synthesis science (Supplemental Information: Table A2). This process yields 2541 new WOS titles that were then manually validated.
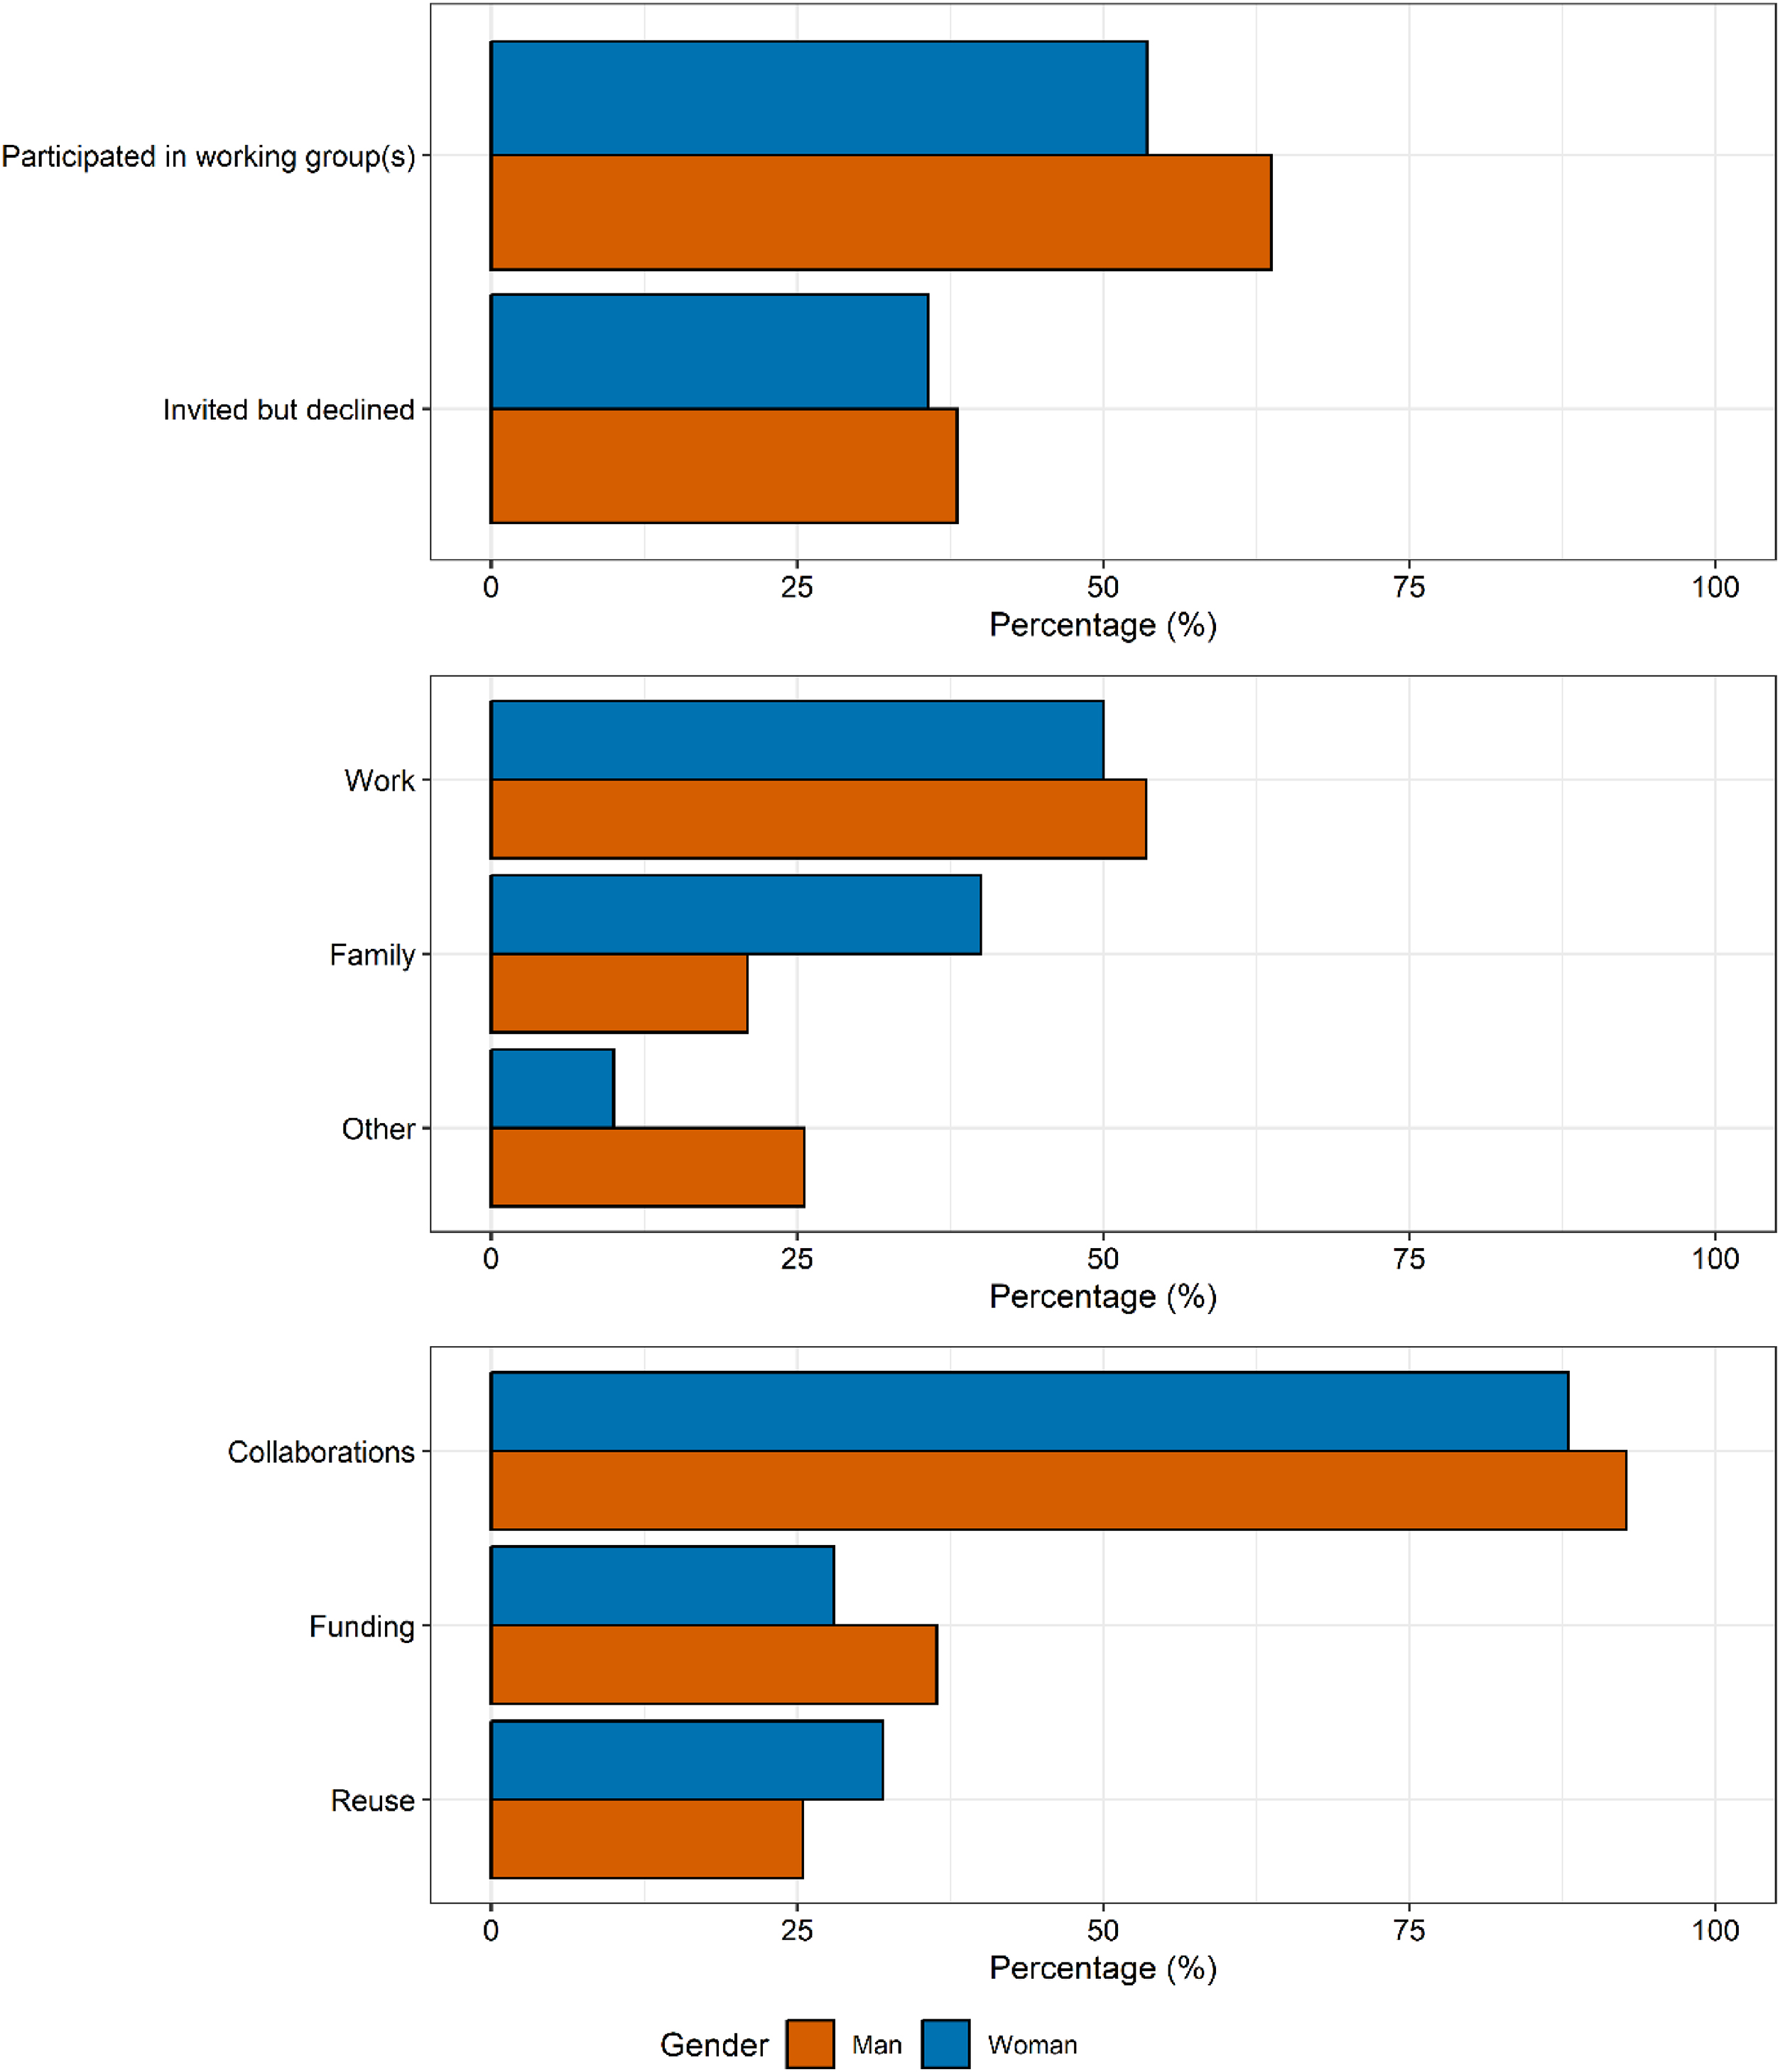
To provide additional contextual information on gender and WGs we conducted an online survey (Supplemental Information: Appendix 4) of ecology and evolution faculty in Canada using our researcher database as the sample frame. Of the 1244 ecology and evolution faculty members in our researcher database, we were able to find 1151 researchers’ email addresses. An email invitation was sent to these researchers containing a link to an online questionnaire with a consent cover letter. The survey was carried out from July to September 2019. Two rounds of reminders were sent to improve the response rate as well as in-person recruitment at the Canadian Society of Ecology and Evolution annual conference (Fredericton NB Canada, 18–21 August 2019). After clearing invalid questionnaires with too much missing data or no identification information, we had 169 valid responses, for an effective questionnaire response rate of 14.7%. The questionnaire (Supplemental Information: Appendix 4) asked for information designed to confirm or complete the researcher database (e.g., academic history, gender) as well as information about why researchers participated or not in WGs, and the perceived costs and benefits of participation.
Survival analysis
Our first research question is whether gender or prior H-index predict which researchers participate in WGs. Of the 1244 researchers in our database, 183 (15%) had participated in at least one WG and obtained at least one identifiable publication from that WG. We used survival analysis to test if gender or pace of career progression (H-index adjusted for time since PhD) predicts the hazard rate of participation in WGs. Survival analysis is a statistical technique used to examine the expected time until an event of interest occurs, such as death, failure, recovery, or other specified events. In our study, the event is the scholar’s first WG participation experience, with the rate representing how fast this participation occurs at a specific time. We included an interaction between gender and H-index to assess whether potential selection effects tied to research records captured by the H-index are the same for women and men. In our sample, the first WG publication was in 1993, so researchers enter the risk set either in the year 1993, or in the year of their PhD graduation for those who finished their PhD after 1993.
We estimated hazard ratios for attending WGs using Cox proportional hazards models. This model takes the form: log [h(t)] = a(t) + B'X, where a(t) is a function of time; hazard rate (h(t)) is the rate of participating in a WG, given that the researcher has not yet participated; X is a vector of covariates and B the vector of related coefficients. Since the left-hand side of the equation takes the logarithm of the hazard rate, we use hazard ratios (exp(B)) as opposed to coefficients (B) to make our interpretation more intuitive. Specifically, hazard ratios represent the relative change in the rate associated with a one-unit change in a covariate, holding all other variables constant: a hazard ratio above one represents an increased rate, while a hazard ratio below one suggests a decreased rate.
Fixed effects regression with linear spline
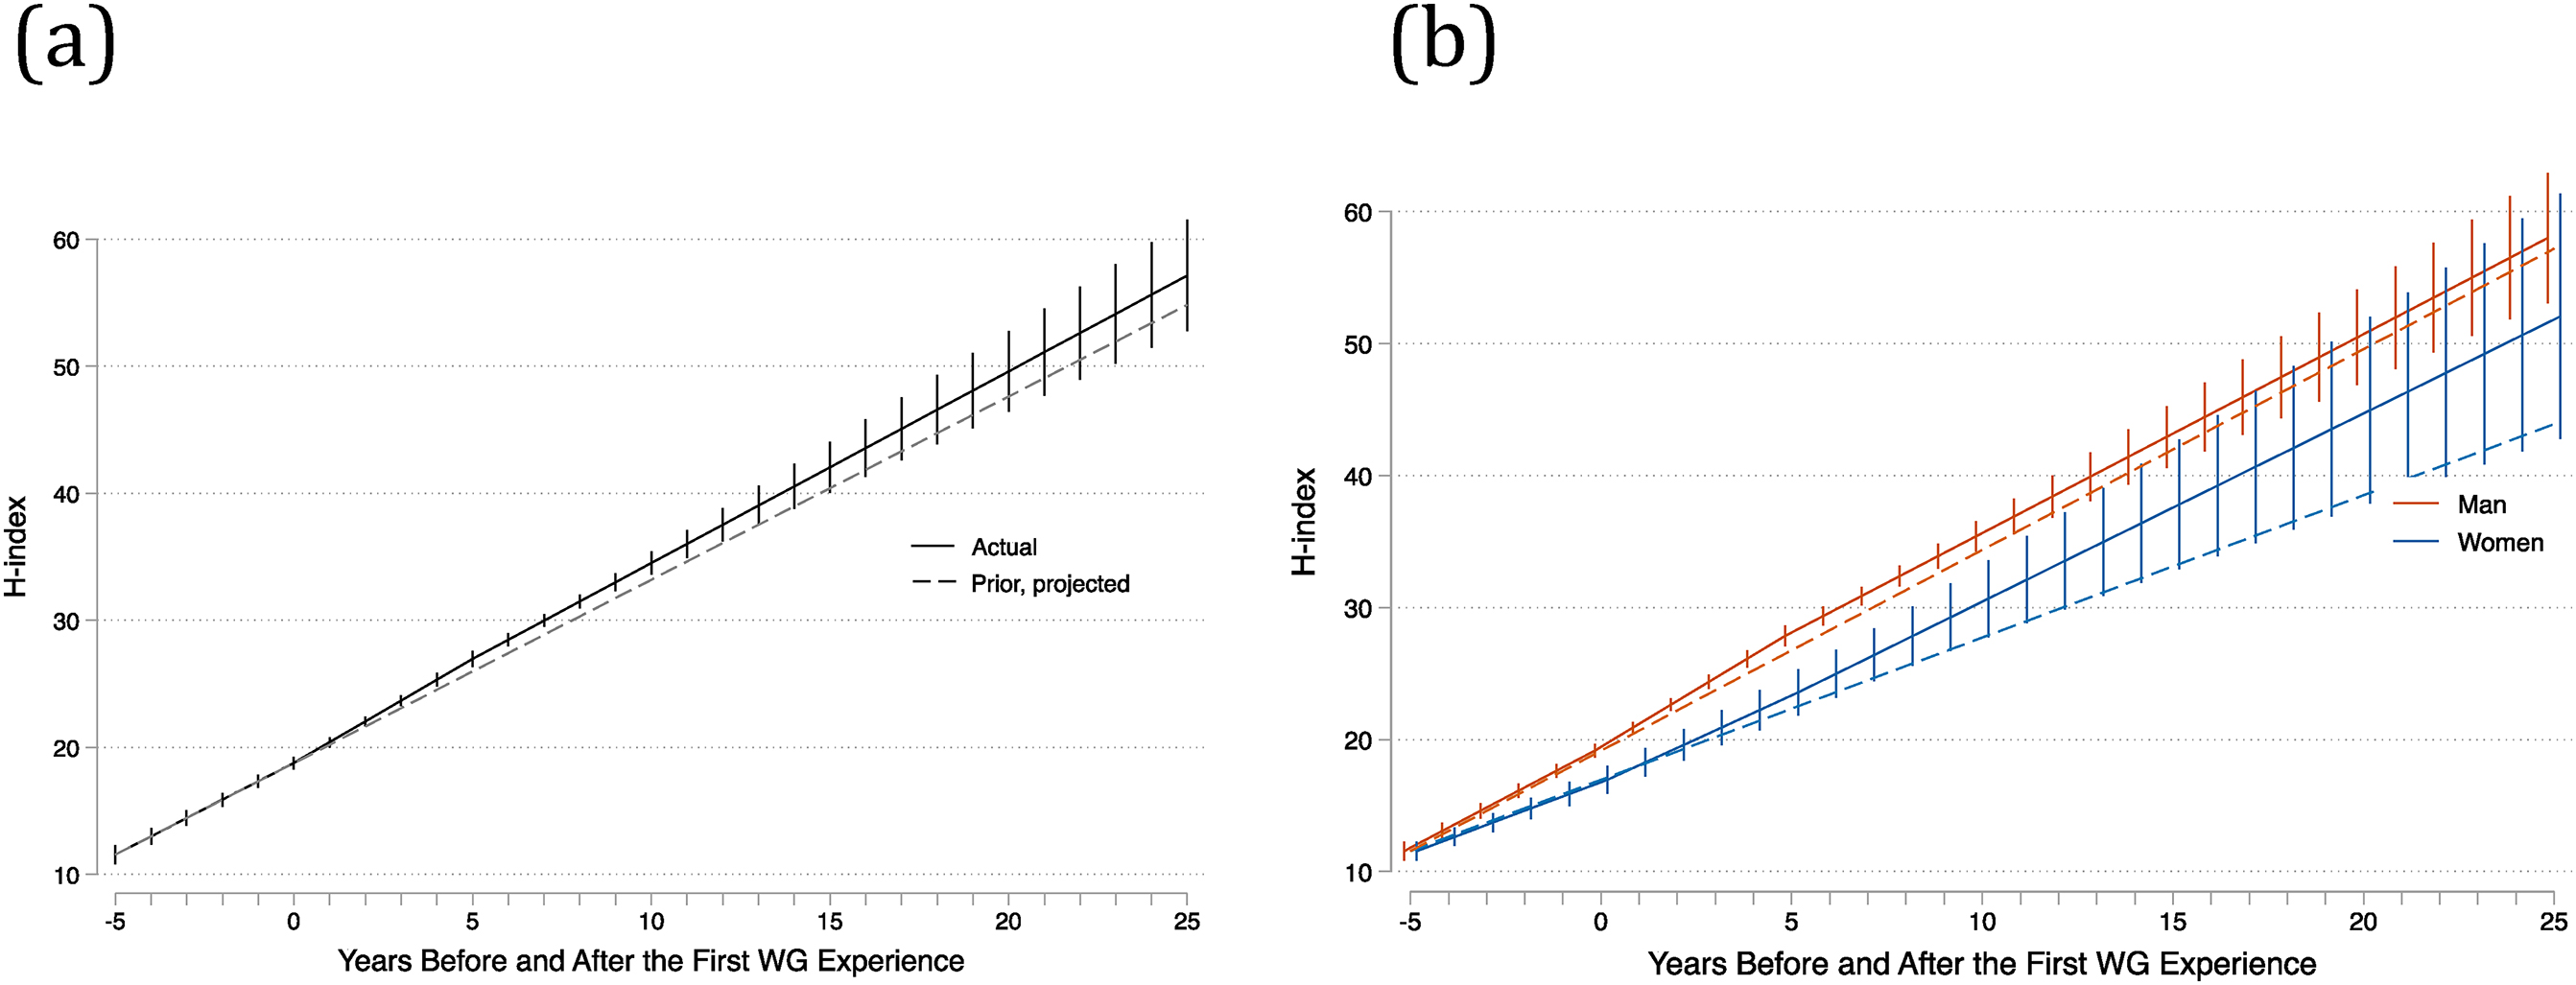
Our second analysis focuses on the subset of researchers who participated in WGs. We employed a fixed effects model with a linear spline to investigate the effects of WG participation and gender on researchers’ trajectory of H-indices over time. We chose a fixed-effects model since this technique nets out all unobserved time-invariant heterogeneity of individuals. In other words, each individual is treated as their own control in a longitudinal analysis (
Allison 2009). In our case, this meant comparing the trajectory of researchers’ H-indices in years before and after participating in WGs, and then averaging those differences across researchers. This approach ensures that we do not confound the effect of WG participation on researcher H-index with the effect of H-index on researcher selection for WG participation. To account for autocorrelation within individuals and heteroscedasticity across individuals, we clustered on individuals as suggested by
Wooldridge (2016) to obtain robust standard errors. Although for most researchers, the increase in their H-indices over time appears almost linear, overall citation rates have increased dramatically in recent decades. If we factor out the effects of calendar year, H-index trajectories actually grow more slowly as time since PhD increases. We therefore implemented a 0.67 power transformation on the “time” variable to linearize the relationship (the 0.67 exponent was estimated from a log H-index versus log time model incorporating calendar year effects).
To model the temporal structure of H-index growth, we use a linear spline with three knots to allow for differing H-index growth trajectories in the years prior to and following researchers’ first WG experience. Unlike a simple linear regression that assumes a constant slope over the entire period, a linear spline is a piecewise linear function that allows the slope to change at predefined time points, i.e., knots. In this context, the knots divide the time trajectory into three segments, enabling us to model differing growth rates of H-index before and after the first WG experience. Specifically, the first segment of time is 0–5 years before the first WG; the second segment is 1–5 years after the first WG; and the third interval is 6 and more years after the first WG. We code the spline specification in marginal form, which makes interpretation simple: coefficients of the second and third interval capture changes in H-index growth rates from their prior intervals.