Open access

Dynamic shifts and a drastic decline in reported landings for southern Gulf of St. Lawrence commercial clam fisheries over the past two decades

Publication: FACETS
24 April 2025

Abstract

Clams constitute an important socioeconomic and Indigenous resource in the southern Gulf of St. Lawrence (sGSL); however, detailed analyses of commercial clam fisheries are outdated. I provide a synthesis of sGSL clam landings from 2003 to 2022. Three species comprised >99% of landings: Mya arenaria, Mercenaria mercenaria, and Spisula solidissima. Annual landings mostly came from Prince Edward Island (75 ± 7%; mean ± standard deviation), followed by New Brunswick (23 ± 6%) and Nova Scotia (2 ± 2%). For the sGSL as a whole, the three species contributed equally to landings from 2003 to 2020, but Mya arenaria dominated landings from 2021 to 2022. This trend was not consistent for individual provinces: province-specific fluctuations in species composition and a contemporary shift from multi-species to single-species harvests were evident. Overall, landings and their associated value sharply declined by 80% and 74%, respectively, over the time series. The number of catch records (i.e., active licenses and Supplement B records) also declined by 80%, suggesting progressively fewer people entering clam fisheries. Annual catch records were a strong predictor of annual landings, and declines in landings per catch record (proxy of CPUE) were apparent. This analysis ultimately suggests a dwindling Canadian fishery. Understanding the proximate causes of fishery declines, how to address them, and determining whether such declines reflect population trends, should be prioritized.

Introduction

Small-scale fisheries, sometimes termed “artisanal” fisheries, play a crucial role in the livelihood, employment, and nutrition of coastal communities around the globe (FAO 2018). Defined as “fishing carried out by fishing vessels of an overall length of less than 12 m and not using towed fishing gear” (Lloret et al. 2018; including non-vessel fishing from shore), small-scale fisheries account for ≈25% of catch volume (Watson and Tidd 2018), ≈50% of fishing effort (Rousseau et al. 2019a), and ≈90% of employment (FAO 2015) for capture fisheries globally. Despite their importance, many small-scale fisheries have experienced declines (e.g., Silas et al. 2020; Vianna et al. 2020; Danquah et al. 2021; Warren and Steenbergen 2021; Castello et al. 2023; Treer 2023), with climate and environmental changes being consistently reported as drivers of declines (Silas et al. 2020; Tidd et al. 2023). Quantifying trends in regional small-scale fisheries is thus important for understanding how the sociocultural and economic fabric of coastal communities are changing.
Small-scale fisheries can be comprised of many different taxa, including both fish and shellfish (among others). With respect to shellfish, bivalve molluscs such as clams are of particular ecological and socioeconomic importance. Clams are consumed as food in coastal regions across the globe and comprise >35% of global bivalve fisheries and aquaculture production globally (Wisjman et al. 2019). Many nearshore communities rely on small-scale clam fisheries for regional income and subsistence (Gianelli et al. 2015, 2021; de Mattos et al. 2017; Pittman et al. 2019; Roa-Ureta et al. 2020). Clams also play important religious and cultural roles in many regions around the world (Blanton 2023; Lee 2023). Ecologically, clams reside in both marine and freshwater systems and provide key ecological services (Vaughn 2018). For example, through their feeding and burrowing activity, clams couple benthic sedimentary habitats to the overlying water, oxygenating sediments, and cycling nutrients (Vaughn and Hakenkamp 2008; Lopes et al. 2018; Carss et al. 2020). Furthermore, filter-feeding clams contribute to localized water quality through their feeding activity (Cranford 2019).
The importance of clam fisheries certainly rings true in Atlantic Canada, where clam fishing is of historic economic and sociocultural importance. Both commercial and recreational fisheries for clams have existed in this region for centuries, with formal catch records of some species dating back to the 1800s (Freeman 1997). Furthermore, clams are known to have been a key dietary resource for Indigenous communities in Atlantic Canada for thousands of years (Prins 1996; Freeman 1997; Sullivan 2007; Pictou 2015; Googoo 2017) and were used by the Algonquians to make currency (i.e., “shell money”) and sacred jewelry (wampum; 
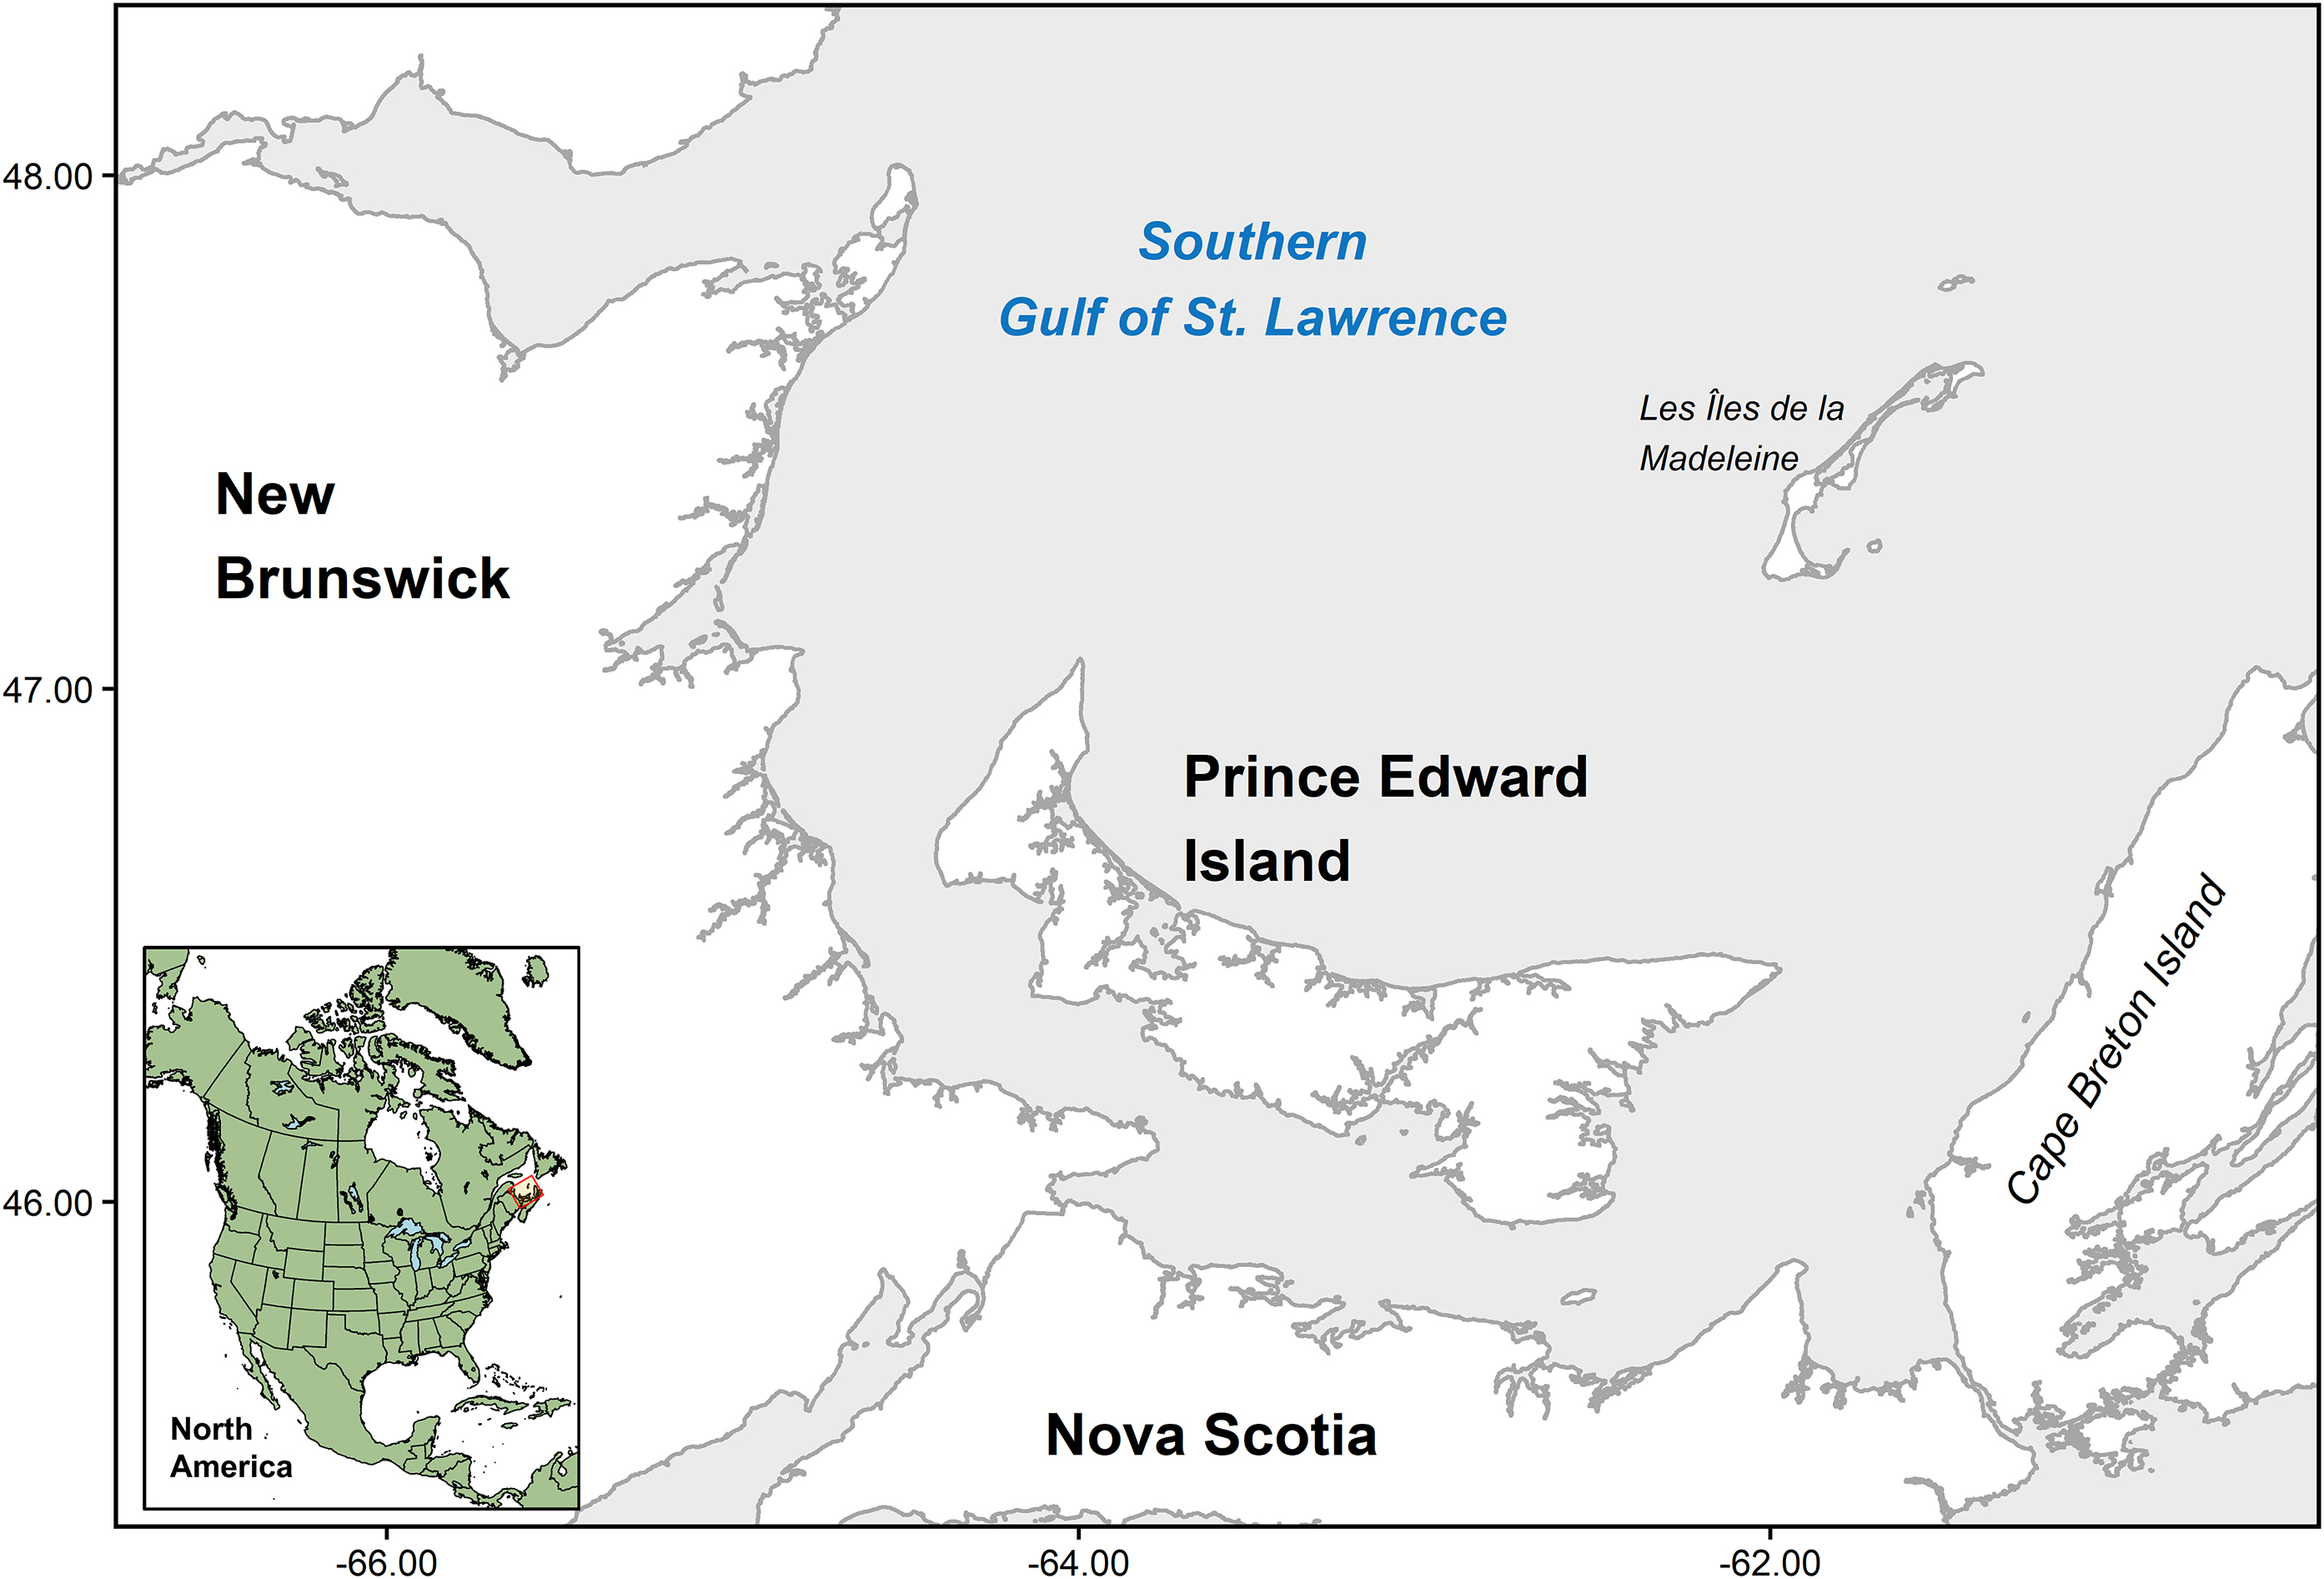
Kurlansky 2006). An important management region for Atlantic Canada clam fisheries is the southern Gulf of St. Lawrence (sGSL; NAFO Division 4T), which is comprised of commercial fisheries in three provinces: New Brunswick (NB), Nova Scotia (NS), and Prince Edward Island (PEI) (Fig. 1).
Fig. 1.
Fig. 1. Map of the southern Gulf of St. Lawrence (sGSL) showing the relevant coastlines of the three Maritime provinces contributing to sGSL clam fisheries. Maps were generated in R using shapefiles sourced from the Global Administrative Areas (GADM) database, which are freely usable for journal publications (https://gadm.org/license.html).
Contemporary commercial and recreational clam fisheries in the sGSL focus primarily on three species: soft-shell clams (Mya arenaria), hard clams (or quahogs; Mercenaria mercenaria), and surfclams (or bar clams; Spisula solidissima). Historically, soft-shell clams have been the most economically important of these species, followed in sequence by surfclams, and hard clams (DFO 2001). Fishing methods can vary but generally occur with the use of hands and/or hand-held tools, rakes, and hydraulic or mechanical dredging (DFO 2022a); commercial diving for clams is not permitted for any species. Together with razor clams (or Atlantic jackknife clams; Ensis leei), commercial fisheries for these four species are generally regulated and enforced by the Department of Fisheries and Oceans (DFO) under the Maritime Provinces Fishery Regulations (hereafter MPFR), enacted by the Fisheries Act (DFO 2022a); however, exceptions exist, and clam fisheries management in this region is complex. Herein, commercial wild (public beds) clam fisheries are managed by species and province via restrictions on harvesting methods (i.e., no diving), designated fishing seasons, daily catch limits, and minimum size limits (DFO 2022a; Table 1).
Table 1.
Table 1. Overview of management measures for commercial clam fisheries in the southern Gulf of St. Lawrence as of October 2024.
Common name(s)Species nameProvinceSeasonDaily catch limitMin. size
Soft-shell clamMya arenariaPEIP: 1 May to 31 OctoberNo limit50 mm
   R: 1 May to 31 October  
  NBP: 1 April to 31 DecemberNo limit*50 mm
   R: 30 June to 15 September  
  NSP: 1 April to 15 August; 15 September to 30 NovemberNo limit50 mm
Hard clam, quahogMercenaria mercenariaPEIP: 18 July to 30 NovemberNo limit50 mm
   R: (Relay: 1 May to 15 July)  
  NBP: 1 April to 31 DecemberNo limit50 mm
  NSP: 1 June to 14 OctoberNo limit50 mm
   R: 1 May to 31 May; 15 October to 30 November)  
Atlantic surfclam, bar clamSpisula solidissimaPEIP: 1 April to 31 DecemberNo limit76 mm
  NBP: 1 April to 30 June; 1 September to 31 December300 clams102 mm
  NSP: 1 April to 15 August; 15 September to 30 NovemberNo limit102 mm
Razor clam, Atlantic jackknifeEnsis leeiPEIP: 1 April to 31 DecemberNo limitn/a
  NBP: 1 April to 31 DecemberNo limitn/a
  NSP: 1 April to 15 August; 15 September to 30 NovemberNo limitn/a

Note: Management measure details were provided and validated by DFO Resource Management. For the “Season” column: P = commercial public bed fishery, R = commercial relay fishery. PEI, Prince Edward Island; NB, New Brunswick; NS, Nova Scotia.

*
Except a single location–Heron Island–where the limit is 500 soft-shell clams.
While management measures are specified in the MPFR, regional management plans can further restrict these regulations through “variation orders” which allow for amending, for example, open and close times, quotas, and/or size limits for a fishery. For example, in NB, management measures are varied from the MPFR and are detailed in the “2022–2024—Clam Management Plan for Eastern New Brunswick” (DFO 2022b). Specific area closures can also be enacted on the bed scale and involve collaborative efforts between multiple federal departments including the Canadian Food Inspection Agency (CFIA), Environment and Climate Change Canada (ECCC), and DFO via the Canadian Shellfish Sanitation Program (CFIA 2023). Herein, areas can be closed due to contamination based on the presence of bacteria, toxins, chemicals, or other potentially-harmful substances (DFO 2022c, 2024; CFIA 2023); real-time area closures for the public fisheries can be accessed through DFO’s Shellfish Harvesting Extent Longitude, Latitude, Information (“SHELLI”) map (DFO 2018). For some of these closed areas (depending on the type and degree of contamination), “relay fisheries” can exist, where clam fishers harvest from public beds or aquaculture leases and “relay” that catch to processors who subsequently depurate the clams and sell them to market. In the sGSL, these fisheries exist for soft-shell clams in NB, soft-shell clams and quahogs in PEI, and quahogs in NS. For relay fisheries, the MCFR applies (DFO 2024), and the fishing season is based on an approved decontamination plan which ensures that the product will be decontaminated and safe for human consumption. It is also important to note here that while this paper details trends in commercial clam fisheries, sizeable recreational clam fisheries exist in the sGSL as well. Management measures for recreational fisheries are detailed in the “Conservation Measures for clams in eastern New Brunswick, Gulf Nova Scotia and Prince Edward Island” (DFO 2022c).
While regular stock assessments are conducted for some clam species in other DFO Management Regions (e.g., DFO 2022d; Brulotte 2023), assessments of clam populations and fisheries are few and far between for the Gulf Region. For example, the last published population assessment conducted by the DFO occurred between 2010 and 2013 at a single clam bed, focusing on a single species (Mya arenaria; Leblanc 2015), as part of monitoring a specific habitat restoration project. Likewise, the last known report documenting clam landings trends in the sGSL was published more than a decade ago, also focusing solely on soft-shell clams in three specific areas of eastern New Brunswick (Hicks and Ouellette 2011). Formal stock status reports for clam species in this region are also lacking, with the most recent stock status reports dating back to 1996–1997 (Landry 1996; Landry and Sephton 1996; Sephton 1996). A contemporary analysis of landings trends is thus warranted.
To address this knowledge gap, I provide a synthesis of reported landings trends for commercial clam fisheries in the sGSL over the past two decades (2003–2022). While reported landings data come with some issues (e.g., de Mutsert et al. 2008; Branch et al. 2010), they can be useful for understanding fishery-specific trends over time and, in some cases, may be reflective of species populations (when effort is measurable and consistent; see debate in Pauly et al. 2013). Notwithstanding, the goal of this exercise was to analyze and document reported landings trends and their associated value for sGSL clam fisheries. I discuss observed landings trends in the context of sGSL clam populations; however, general conclusions regarding the status of clam populations and stock dynamics require more direct population assessments and should not be inferred from these data.

Methods

Clam landings data

Landings data for sGSL commercial clam fisheries were obtained from the DFO Gulf Statistics Branch in March 2024. These data included both public clam bed landings (i.e., “wild” fisheries), as well as landings from leased areas (i.e., aquaculture leases) and relay fisheries. It is important to note here that landings data only encompass commercial clam fisheries and do not capture catch data from recreational fisheries. The data spanned from 2003–2022 and contained detailed information on total landings (kg), value (CA$), and the number of “catch records” by species, year, province, and landing place (i.e., docks where products were landed). “Catch records” were defined as the number of active licenses (i.e., licenses reporting a catch; omits issued licenses that did not report a catch), as well as reported catches that were not associated with a specific license (termed “Supplement B”). As such, catch records provide a coarse proxy of fishing effort for a given year. Because data for many landing places came from a single catch record (i.e., single fisher), details of landing places (names and coordinates) are redacted from any analyses including specific landing places. Species reported from catch records included soft-shell clams (Mya arenaria), hard clams (or quahogs, Mercenaria mercenaria), bar clams (Spisula solidissima), razor clams (or Atlantic jackknife clams, Ensis leei), and “unspecified” clams (i.e., unidentified species). To account for shifting buying power of the Canadian dollar, value data for all years were adjusted to 2022 dollars using historical Consumer Price Index data from Statistics Canada (see supplementary data files for conversion values).

Data analysis

All statistical analyses were conducted using RStudio (RStudio Team 2020) equipped with R version 4.2.2 (R Core Team 2022). Data and annotated R code used in the analyses are provided as Supplementary Material alongside the article; however, some specific values within the datasets needed to be redacted for data privacy rules (see Tomasic 2023) and are denoted by the letter “R” in the supplementary datasets.
I first computed and plotted the percentage of landings and value for each of the three provinces across years to determine the relative contribution of each province to sGSL totals, and to assess whether there were any temporal changes in provincial contributions. The data were also examined for temporal shifts in the species composition of fisheries in each of the three provinces by computing and plotting the percentage of landings and value comprised by each of the three primary fished species for each province, combined and individually, across years. Temporal shifts in provincial contributions and species composition were interpreted visually.
Preliminary discussions with clam diggers and a cursory initial look at the data suggested that clam landings were steadily declining over time. I therefore used linear regression to test for significant declines in clam landings and value for the overall dataset (i.e., all provinces and species pooled), for each of the three primary fished species (pooled across provinces), each of the three provinces (pooled across species), and each of the three species within each province. Linear models were constructed using the lm() function and model results were obtained using the summary() function. Assumptions of residual homoscedasticity for each model were tested with Breusch–Pagan tests using the bmtest() function from the “lmtest” package (Zeilis and Hothorn 2002), with heteroscedasticity being defined at p < 0.05. Where heteroscedasticity was detected, a weighted least squares model was used to obtain model estimates and significance. The assumption of residual normality was ignored herein, as violations of normality do not impact model results for sample sizes >10, while data transformations tend to introduce bias in point estimates (Schmidt and Finan 2018). Significant declines were concluded when the relationship between year and landings and value was significantly negative (i.e., the global model had a p < 0.05 and the slope value was negative). Similarly, linear regression was used to test for declines in catch records (i.e., active licenses and Supplement B) for each of the three provinces, combined and individually. Finally, linear regression was used to test for the presence of an overall relationship between catch records and total landings (i.e., all provinces and species combined). Prior to running the linear regressions that included year as the predictor variable, the actual years (i.e., 2003–2022) were converted to corresponding values ranging from 0 to 19 to properly estimate regression intercepts for the year 2003. I also visually assessed trends in relative market value for each clam species (combined and individually) by plotting the price per kg (computed as dollars generated divided by kgs landed, or simply value ÷ landings) across the 20 years in the dataset.
Finally, I isolated data for landing places that had reported landings for each year of the time series (i.e., at least one catch record per year from 2003 to 2022; n = 15). I then computed the average landings per catch record for each of those places, which provided a coarse measure of “catch per unit effort” (CPUE), and then plotted this over time for each landing place. Each plot was visually assessed to determine if CPUE increased, decreased, or remained stable across the time series. It is important to note here that catch records are a coarse measure of fishing effort and the data should thus be interpreted with caution.

Results

Provincial contributions to sGSL clam fisheries

The vast majority of clam landings and value for sGSL fisheries came from PEI followed in sequence by NB and NS (Figs. 2A and 2B). Herein, PEI accounted for 75 ± 7% (mean ± SD across years) and 75 ± 6% of landings and value, respectively, from 2003 to 2022. The remainder was mostly comprised of landings from NB, which contributed 22 ± 6% of the landings and 23 ± 6% of the value. Landings and value from NS were negligible compared to NB and PEI (2 ± 2% for both landings and value). Temporal variability in provincial contributions was generally low, aside from a slight uptick in PEI landings contributions (85 ± 3%) for 2017–2020, with a corresponding uptick in value contributions for 2017 and 2018 (Fig. 2).
Fig. 2.
Fig. 2. Temporal trends in the relative contributions of each of the three Maritime Canadian provinces to the total landings (1000 kg; A) and value (CA$1000; B) of sGSL clam fisheries from 2003 to 2022 (all species combined).

Species composition of sGSL clam fisheries

As suspected, over the entirety of the time series, three species comprised the majority (>99%) of total landings for the sGSL as a whole: Mya arenaria, Mercenaria mercenaria, and S. solidissima. Collectively, razor clams (E. leei) an unspecified species comprised <1% and were thus not analyzed statistically. For the sGSL as a whole (i.e., all provinces), each of the three primary species contributed approximately equally to annual landings and value until 2018, when there was a marked drop in hard clam (Mercenaria mercenaria) landings and an equitable uptick in both Mya arenaria and S. soilidissima landings; however, value during this period only increased for Mya arenaria (Figs. 3A and 3E). Subsequently, in 2020, there was a marked decline in S. solidissima landings accompanied by a drastic increase in Mya arenaria landings, which led to landings and value being dominated (>70%) by Mya arenaria since 2021 (Figs. 3A and 3E).
Fig. 3.
Fig. 3. Temporal trends in the percentage of total landings (A–D) and value (E–H) comprised by each of the three primary fished species for the three Maritime Canadian provinces (combined and individually). Note that total percentages (i.e., all species combined) for a given year do not always reach 100%, as there were reported landings for minority species (Ensis leei) and/or unspecified species for some years and provinces (data not included).
For NB, landings and value for Mercenaria mercenaria were generally low (<20%) throughout the time series, with a slight increasing trend since 2014 (Figs. 3B and 3F). From 2003 to 2006, landings and value for NB fisheries were mostly comprised by Mya arenaria (≈60%), with S. solidissima comprising ≈30% (Figs. 3B and F). In 2007, the relative contributions of Mya arenaria and S. solidissima converged with each species equally contributing ≈45% of NB landings and value. In 2014, landings for S. solidissima plummeted such that this species contributed ≈0% to NB fisheries landings and value (Figs. 3B and 3F). Alongside the crash of S. solidissima in 2014, there was a drastic increase in Mya arenaria contributions in NB, with Mya arenaria comprising >90% of clam landings and value in 2014; there was also a slight increase in Mercenaria mercenaria contributions in 2014 (Figs. 3B and 3F). Since 2014, S. solidissima contributions to NB fisheries have remained ≈0%, with Mya arenaria contributing ≈70%–90% to landings and value, and Mercenaria mercenaria contributing ≈10%–30%, depending on year; annual increases and decreases in Mya arenaria and Mercenaria mercenaria contributions since 2014 mirror one another (Figs. 3B and 3F).
In stark contrast, contributions of Mya arenaria to NS fisheries have been low for virtually the entire time series, with the exception of 2013 when Mya arenaria landings comprised ≈40% of NS clam fisheries (Figs. 3C and 3G ). The relative contributions of Mercenaria mercenaria and S. solidissima to NS landings varied widely until 2017, after which NS landings have been almost exclusively comprised of Mercenaria mercenaria (Figs. 3C and 3G).
The overall trend in species composition for the sGSL as a whole was largely driven by species composition of PEI fisheries, which showed the same general temporal trend in species composition (not surprising given that PEI makes up the vast majority of sGSL landings; Figs. 3D and 3H). Species compositions of NB and NS fisheries, however, were not comparable.

Temporal trends in landings and value

Overall, sGSL clam landings and value have sharply declined since 2003. Total landings across the sGSL have declined by 80% from 2 552 715 kg in 2003 to 509 915 kg in 2022 with a concomitant 74% decline in landings value from CA$7 290 985 in 2003 to $1 867 602 in 2022 (CPI adjusted values; Fig. 4A). Linear regression revealed that the sGSL-wide declines were highly significant for both landings and value, with an average annual decrease of 105 950 kg in landings and $203 400 in value (Table 2). Statistically significant landings and value declines were evident for all three primary species (provinces pooled; Figs. 4A4D) and all three provinces (species pooled; Figs. 5A and 5E), with varying degrees of significance and slope (Table 2). Among the provinces, pooled species declines have been most pronounced for PEI (Figs. 5A and 5E).
Fig. 4.
Fig. 4. Temporal trends in landings (measured in thousands of kilograms; blue circles in A–D), value (measured in thousands of Canadian dollars; orange diamonds in A–D), and price per kilogram (green circles in E–H) for the three primary fished species, combined and individually, for the entire southern Gulf of St. Lawrence (i.e., all provinces combined).)
Fig. 5.
Fig. 5. Temporal trends in landings (measured in thousands of kilograms; A–D) and value (measured in thousands of Canadian dollars; E–H) for the three primary fished species (combined and individually) in each of the three Maritime Canadian provinces (NB, blue circles; NS, orange squares; PEI, green diamonds).
Table 2.
Table 2. Results of linear regression models for the relationships between year and landings (1000 kg), and year and value (CA$1000), for each of the three primary fished species and the three Maritime Canadian provinces.
ProvinceSpeciesSlopeInterceptdfF-valuep-valueAdj. R2% change
Landings:
All provincesAll species−105.952376.201,18120.8<0.00010.86−80.0%
 Mya arenaria−34.06818.861,1842.0<0.00010.68−49.7%
 Mercenaria mercenaria−37.38748.391,1849.9<0.00010.72−92.8%
 Spisula solidissima−34.70807.591,1884.3<0.00010.81−88.9%
NBAll species−32.66637.361,18161.4<0.00010.89−80.8%
 Mya arenaria−17.45360.301,18135.2<0.00010.88−75.7%
 Mercenaria mercenaria−1.9748.821,1811.90.00290.36−32.5%
 Spisula solidissima−13.24228.191,1834.2<0.00010.64−100.0%
NSAll species−5.0383.951,1819.20.00040.49−94.1%
 Mya arenaria−0.213.271,1818.60.00040.48−100.0%
 Mercenaria mercenaria−1.4430.861,185.10.03740.18−87.8%
 Spisula solidissima−3.3149.001,1833.7<0.00010.63−99.7%
PEIAll species−68.271654.881,1870.1<0.00010.78−78.9%
 Mya arenaria*−16.40455.291,1813.00.00200.39−12.4%
 Mercenaria mercenaria−33.97668.711,1845.0<0.00010.70−95.3%
 Spisula solidissima−18.14530.411,1827.7<0.00010.58−85.2%
Value (CPI adjusted):
All provincesAll species*−203.45038.91,1837.8<0.00010.66−74.4%
 Mya arenaria−89.462324.661,1814.50.00130.42−28.0%
 Mercenaria mercenaria*−90.461911.561,1833.70.00020.63−94.1%
 Spisula solidissima*−56.81131.631,18150.8<0.00010.89−93.7%
NBAll species−66.721366.791,18104.7<0.00010.85−69.6%
 Mya arenaria−36.71823.711,1837.1<0.00010.66−62.0%
 Mercenaria mercenaria−4.85131.901,188.20.01040.27−16.9%
 Spisula solidissima−25.17411.081,1861.6<0.00010.76−100.0%
NSAll species−13.16210.821,1812.40.00240.38−94.6%
 Mya arenaria−0.7711.821,1821.10.00020.51−100.0%
 Mercenaria mercenaria*−1.5354.571,181.20.28930.01−88.8%
 Spisula solidissima−7.80111.771,1819.50.00030.49−99.9%
PEIAll species*−136.743594.971,1826.6<0.00010.57−74.4%
 Mya arenaria−51.981489.131,187.60.01290.260.5%
 Mercenaria mercenaria−98.141870.041,1824.10.00010.55−96.4%
 Spisula solidissima−26.13632.821,1845.0<0.00010.70−89.7%

Note: Results are presented for all species and provinces combined, as well as for each of the three species (pooled across provinces), each of the three provinces (pooled across species), and each of the three species within each of the three provinces. Bolded p-values signify significant relationships between year and landings/value (p < 0.05). Note that the intercept for each model represents the value at which the regression line would cross the y-axis for the year 2003. Visual representations of each individual relationship can be found in Fig. 4 (left panels) and 5. Asterisks denote estimates generated from weighted least square models (initial model was heteroscedastic). The percentage change between 2003 and 2022–computed as the difference between the 2022 and 2003 landings/value divided by the 2003 landings/value (and them multiplied by 100%)–is depicted in the ‘% change’ column. PEI, Prince Edward Island; NS, Nova Scotia; NB, New Brunswick.

Within provinces, significant declines in landings were evident for each of the three primary species (Table 2; Figs. 5A5D). Province-specific declines in landed value, however, were partially offset by increasing prices for certain species. Herein, across the sGSL, prices for both Mya arenaria and Mercenaria mercenaria have been increasing since 2013, while prices for S. solidissima have remained low (<$1.00 kg−1) and stagnant (Figs. 4E4H). Current prices for Mya arenaria and Mercenaria mercenaria hovering around $4.50 kg−1 and $3.00 kg−1, respectively (Figs. 4E4H). As a result, declines in landed value for Mya arenaria in PEI, and Mercenaria mercenaria in NB and NS, were marginally non-significant (0.05 < p < 0.10), while the landed value of S. solidissima significantly declined in all provinces (Table 2, Figs. 5E5H). In fact, the increasing price for Mya arenaria has led to an increase in landed value for this species in recent years (2021–2022), particularly in PEI, which is comparable to landed values for this species in earlier years of the time series (Figs. 4 and 5). Regardless of statistical significance, it is important to note here that the slopes for all of the relationships highlighted above had a negative value (Table 2).

Temporal trends in catch records and relationship with landings

Similar to landings trends, the number of active licenses and Supplemental B reports (i.e., catch records) has steadily decreased since 2003. This decline in catch records was consistent and statistically significant for all three provinces, although it was most pronounced for PEI (Table 3; Figs. 6A and 6B). There was a strong, positive linear relationship between annual catch records and annual landings (Fig. 6C).
Fig. 6.
Fig. 6. Temporal trends in the number of catch records (active licenses and Supplement B records) for the three Maritime Canadian provinces (A, B), and the relationship between catch records and total landings for the sGSL as a whole (C). Equation and statistical results in C are weighted least squares regression model results (initial model was heteroscedastic). Panel B shows catch records for all three provinces, while Panel A zooms in on catch records for NB and NS to better visualize trends. Panels A and B were generated using the facet_zoom() function from the “ggforce” package in R (Pedersen 2024).
Table 3.
Table 3. Results of linear regression models for the relationships between year and catch records for each of the three Maritime Canadian provinces (combined and individually).
ProvinceSlopeInterceptdfF statisticp-valueAdj. R2
All provinces−68.931537.091,1877.7<0.00010.80
New Brunswick−8.41181.811,1858.4<0.00010.75
Nova Scotia−1.2032.761,1810.60.00430.34
Prince Edward Island−59.311322.511,1867.0<0.00010.78

Note: Bolded p-values signify significant relationships between year and catch records (p < 0.05). Note that the intercept for each model represents the value at which the regression line would cross the y-axis for the year 2003.

Temporal trends in landings per catch record

A total of 15 landing places (i.e., docks where products were landed) contained landings data for each year of the time series (2003–2022). Among these 15 landing places, eight had reasonably high landings per catch record (>25 000 kg) for multiple years in the time series (Figs. 7A7H). The remaining seven places had low landings per catch record (<2000 kg) for the vast majority of the time series (Figs. 7G7O); two exceptions where landings per catch record showed a slight increase in a single year were evident (Figs. 7I and 7J). Of the places that had reasonably high landings per catch record as above, all displayed a decline in reported landings per catch record over time, particularly in recent years (Figs. 7A7H). Most of these places showed an initial increase in landings per catch record from 2003 to the early 2010s followed by a decline to lower values in 2014–2015 (Figs. 7A, 7B, and 7D7H), with the exception of one place (Fig. 7C), which showed a consistent declining trend in landings per catch record over the time series (Fig. 7C). Trends for places with low landings per catch record (Figs. 7I7O) were more variable; however, most showed declining trends, particularly in recent years (Figs. 7I7K, 7M, and 7N), while two others showed a trend toward increased landings per catch record in recent years (Figs. 7L and 7O).
Fig. 7.
Fig. 7. Temporal trends in landings per catch record (coarse measure of catch per unit effort) for each of the 15 landing places (A–O) that contained data for each of the 20 years in the time series (2003–2022). Each panel represents a single landing place; landing place names and locations are redacted for data privacy reasons. Places are ordered from the highest to lowest single-year landings per catch record; note that y-axes vary across figure panels.

Discussion

This study ultimately documents dynamic shifts in the makeup of regional clam fisheries during a time of declining landings. Whether the landings declines reported here are due to declining fishing effort, declining clam populations, or a combination of both awaits more direct research. Furthermore, if populations are indeed declining in the region, the underlying reasons for this should be explored. Contemporary studies comparing these results to other clam fisheries across the globe, and other small-scale fisheries more broadly, are warranted.
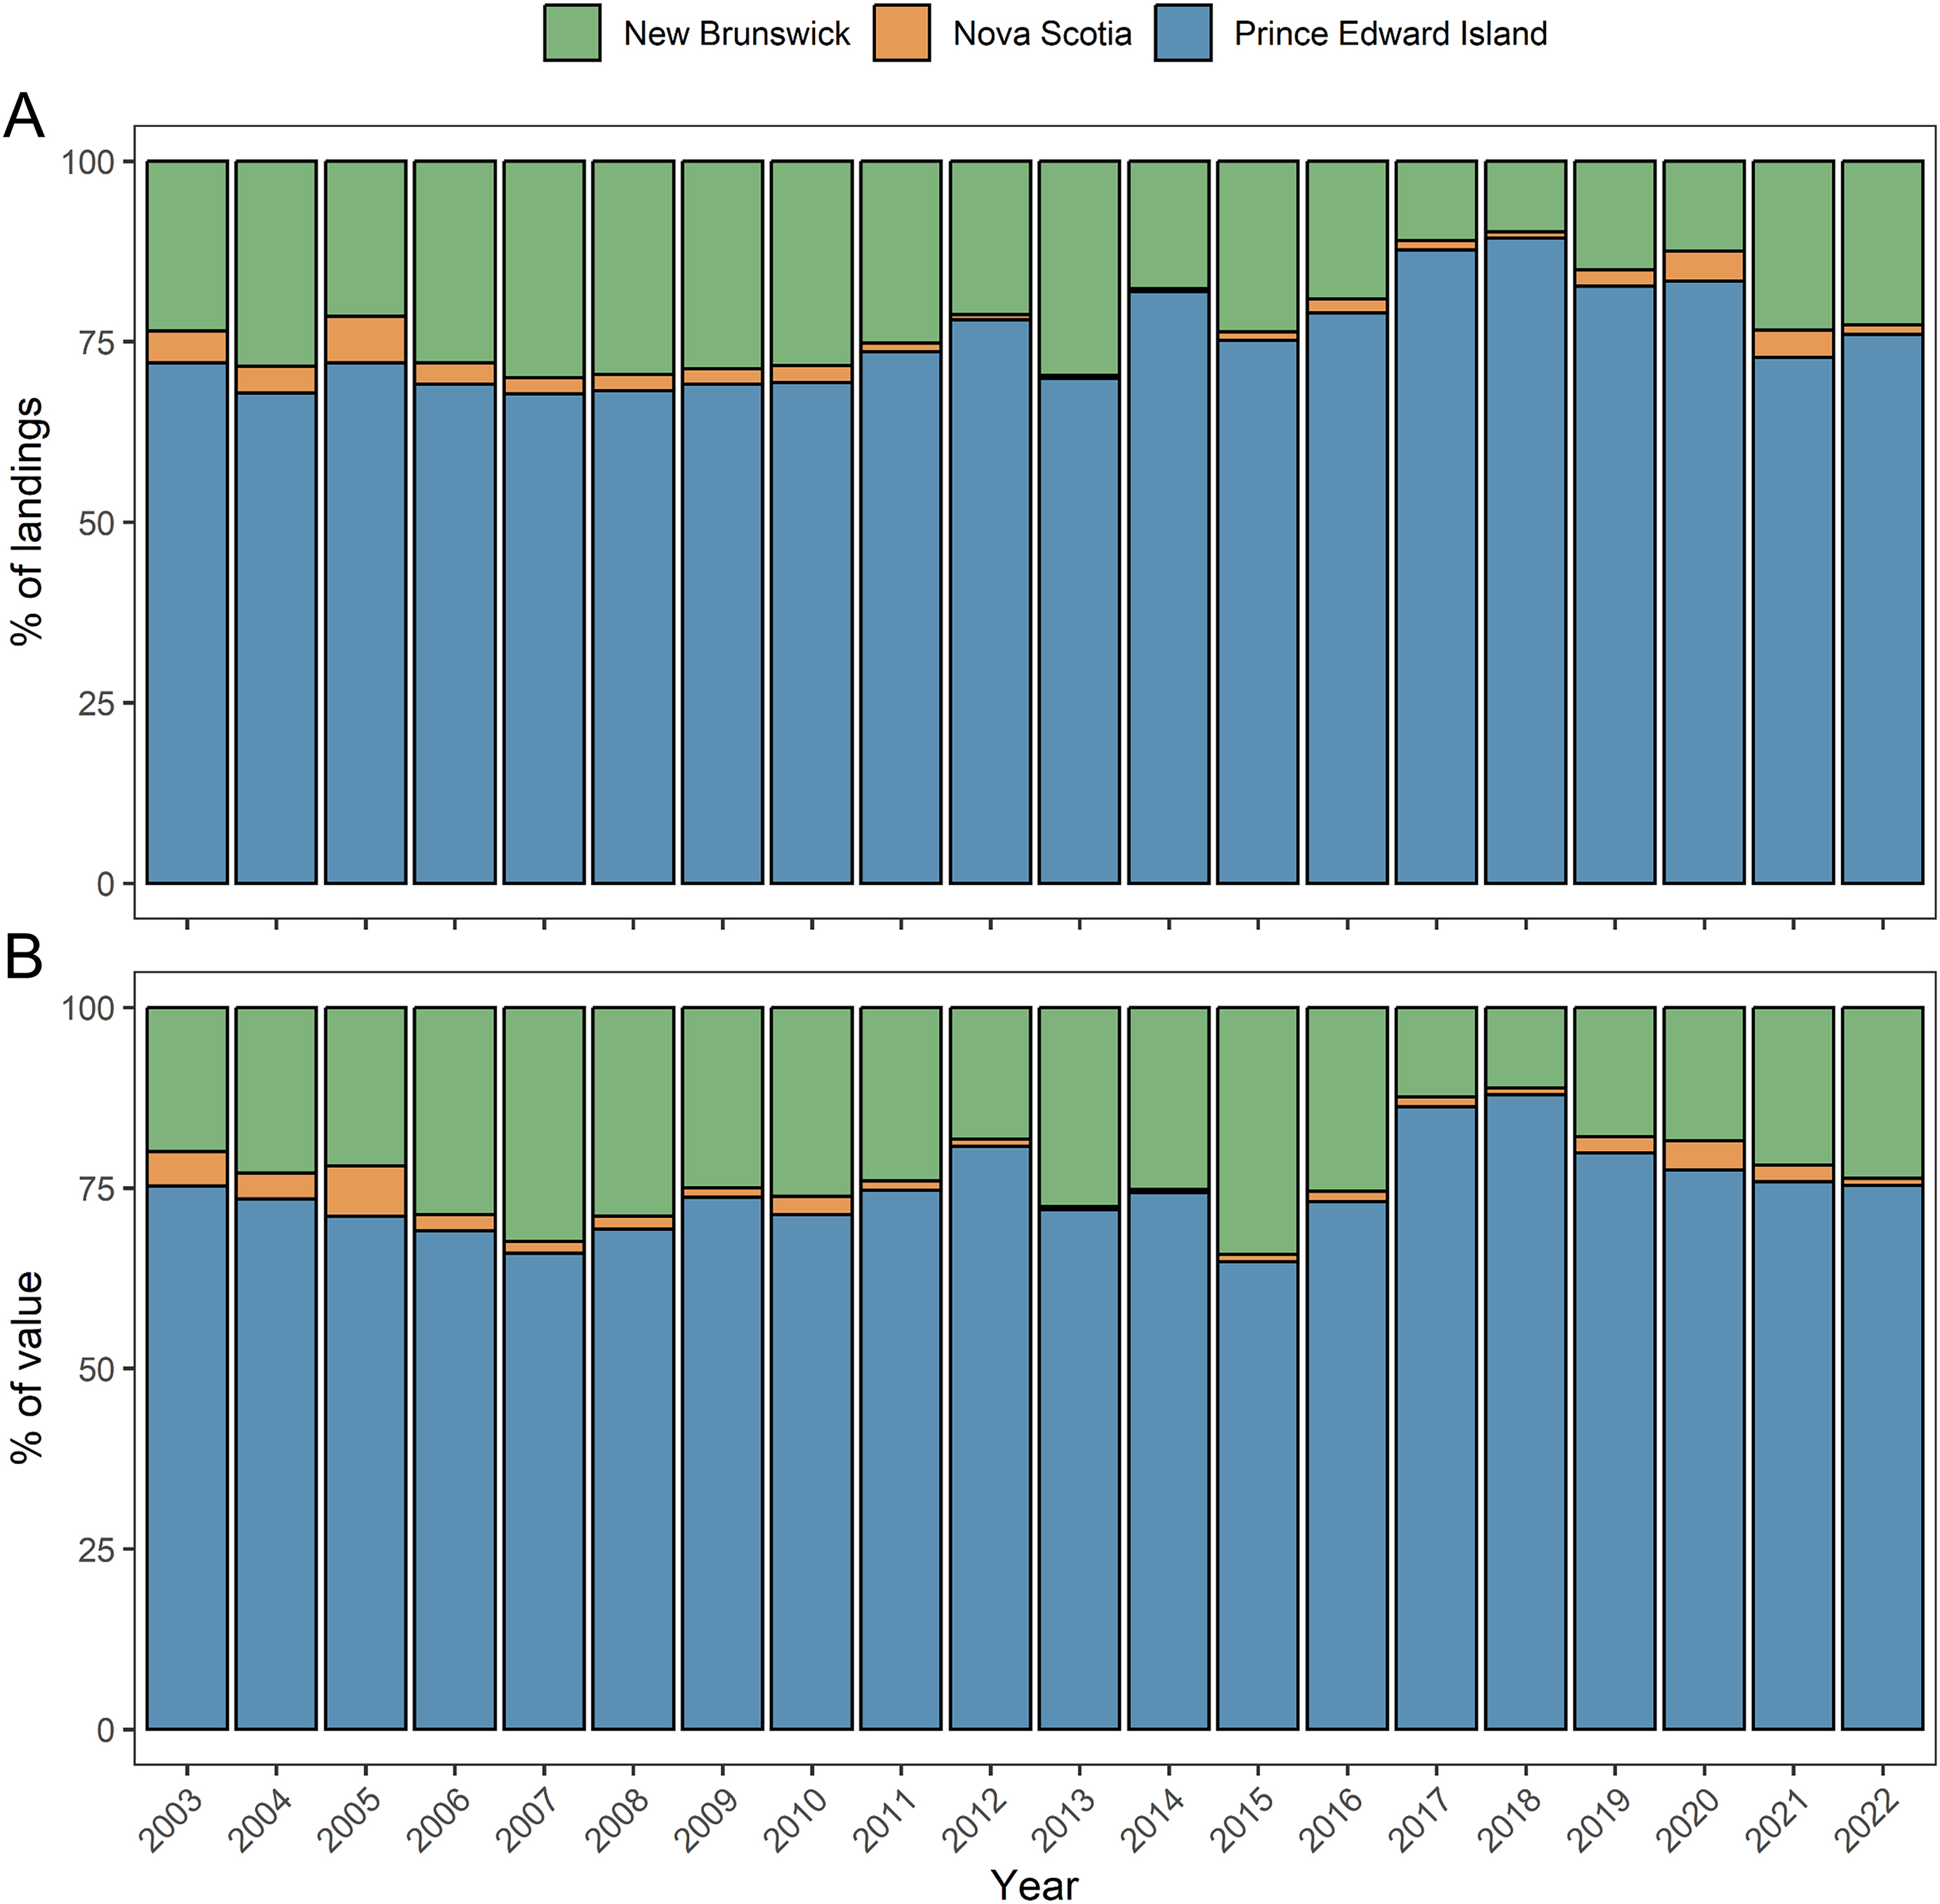
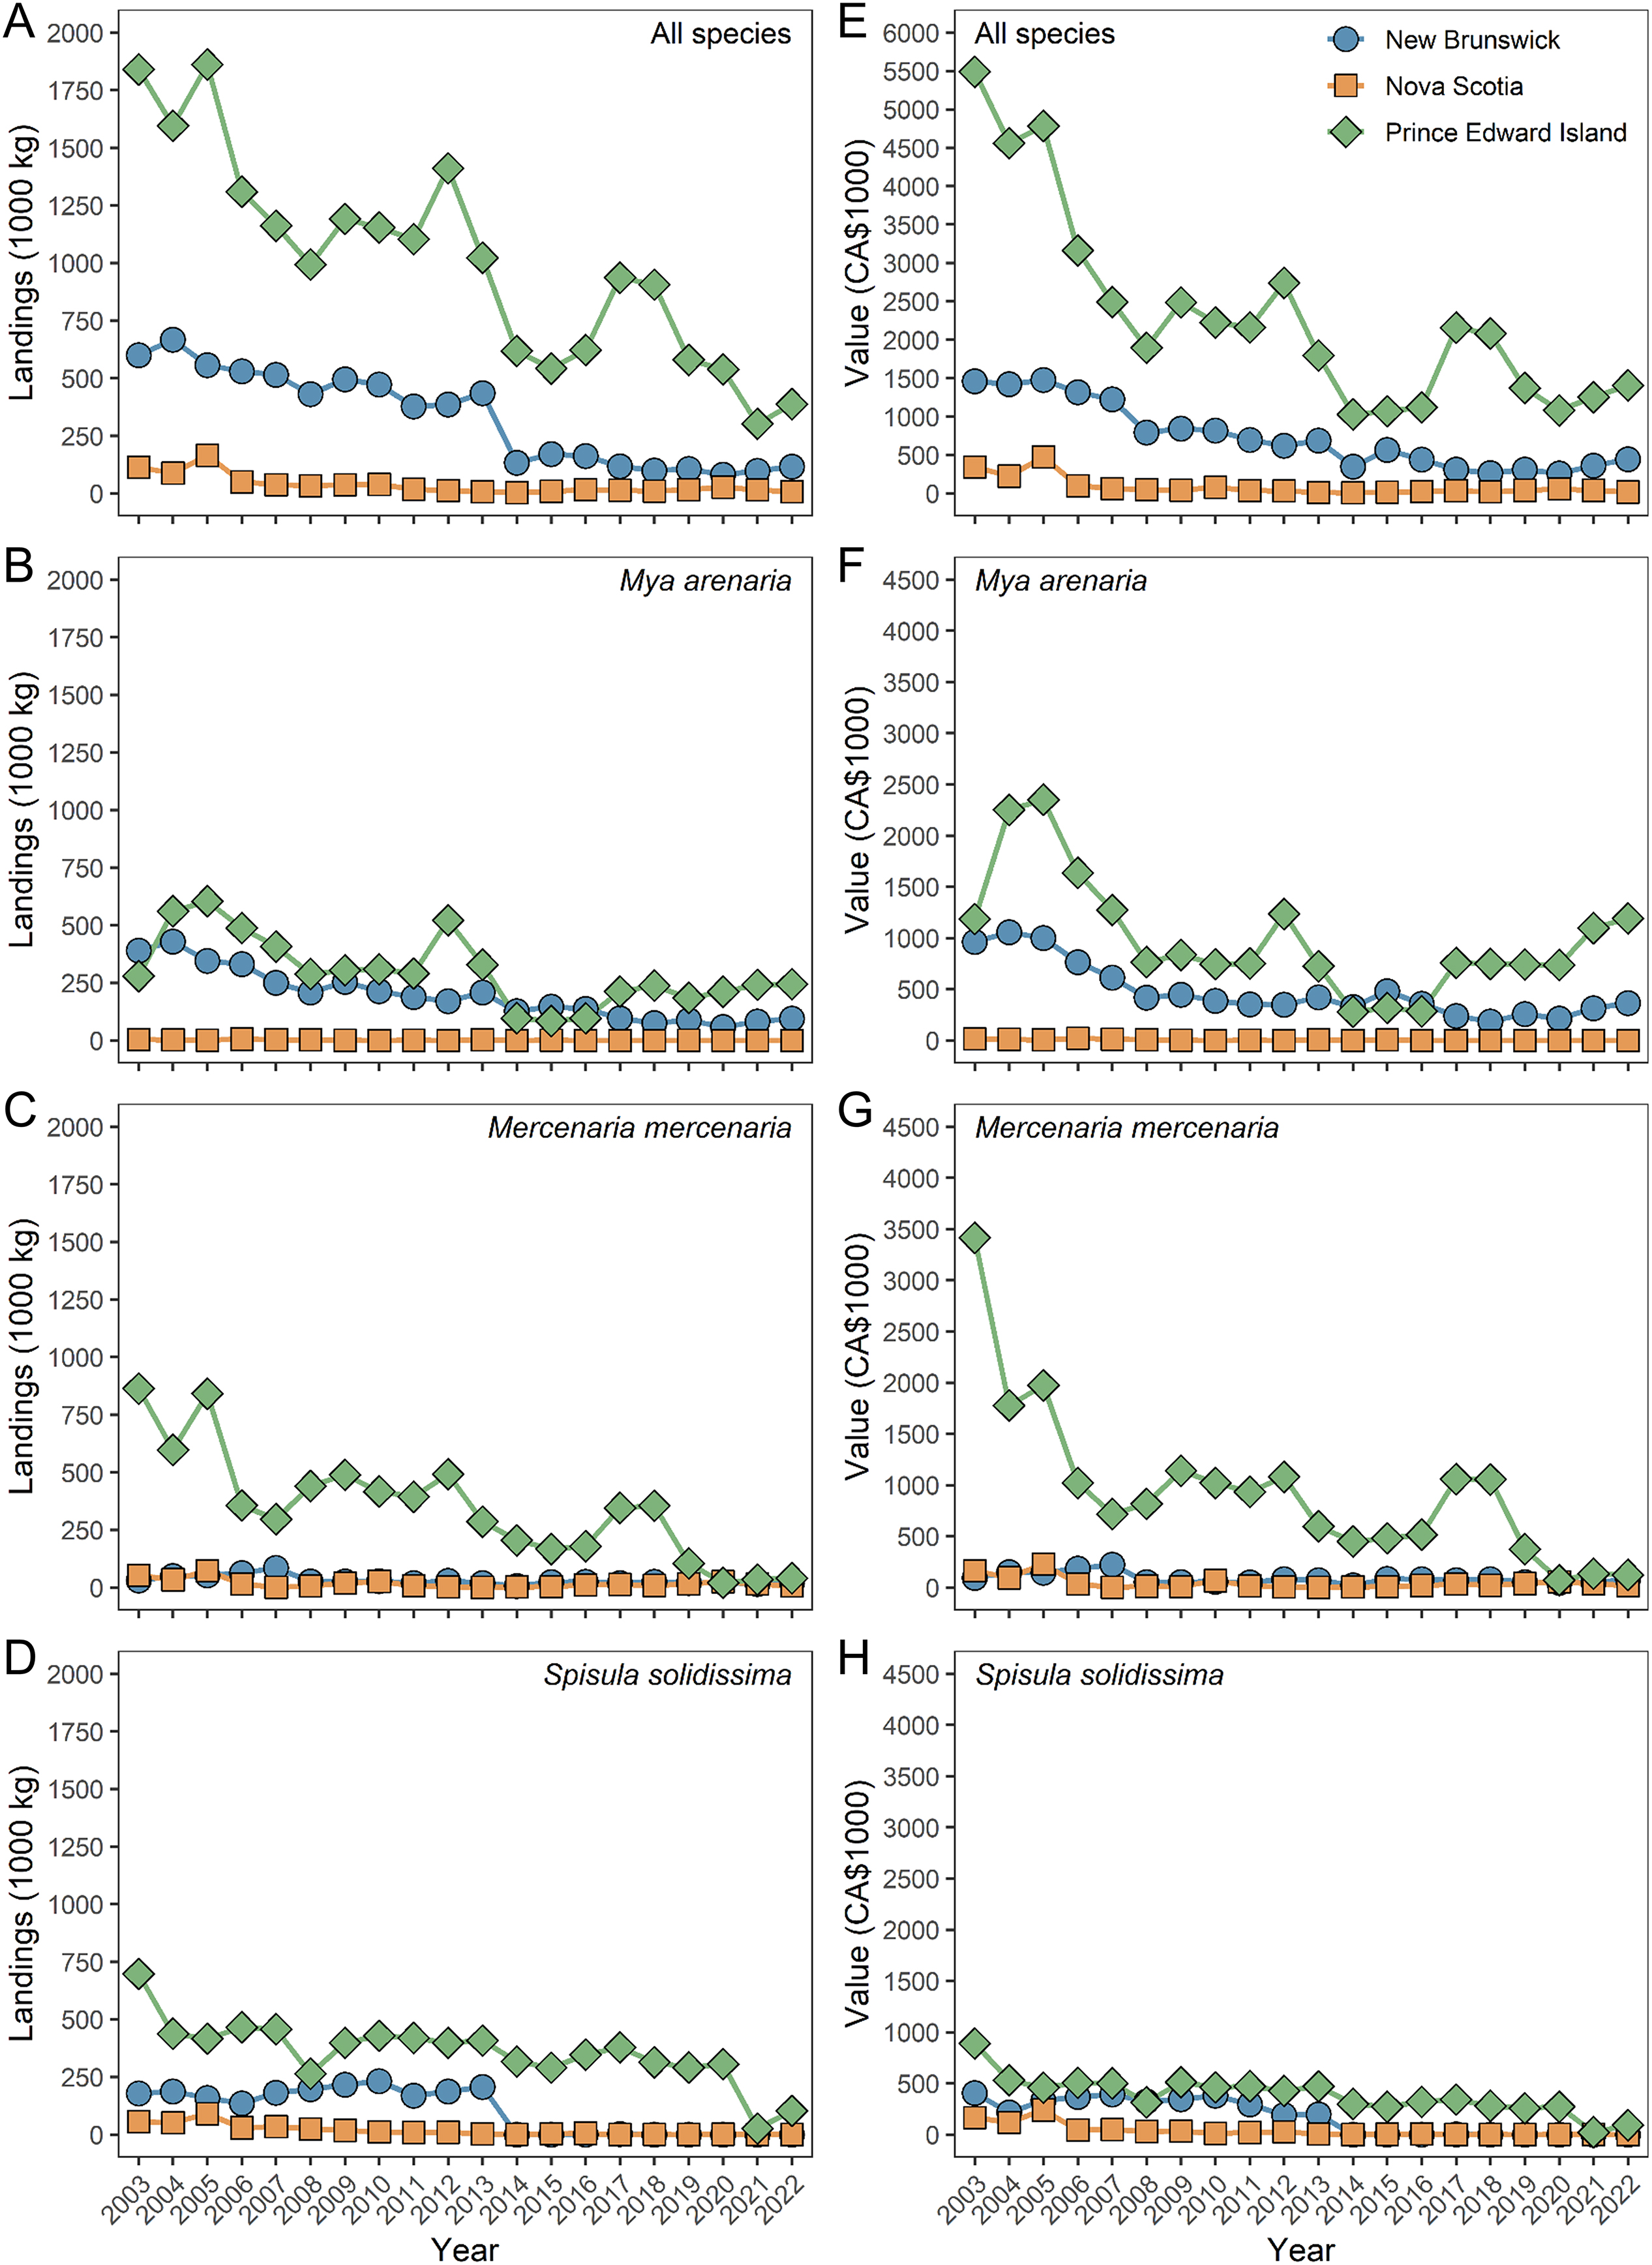
The relative contributions of the three provinces to sGSL commercial clam landings have been unwavering over the past 20 years. Herein, PEI is the most significant contributor of clam landings and value in the sGSL, followed by NB and NS; however, NS contributions have been negligible compared to NB and PEI. The reasons for such stable and disproportionate provincial contributions are not clear at this time; however, it is interesting that declining landings have not resulted in any detectable changes in relative provincial contributions.
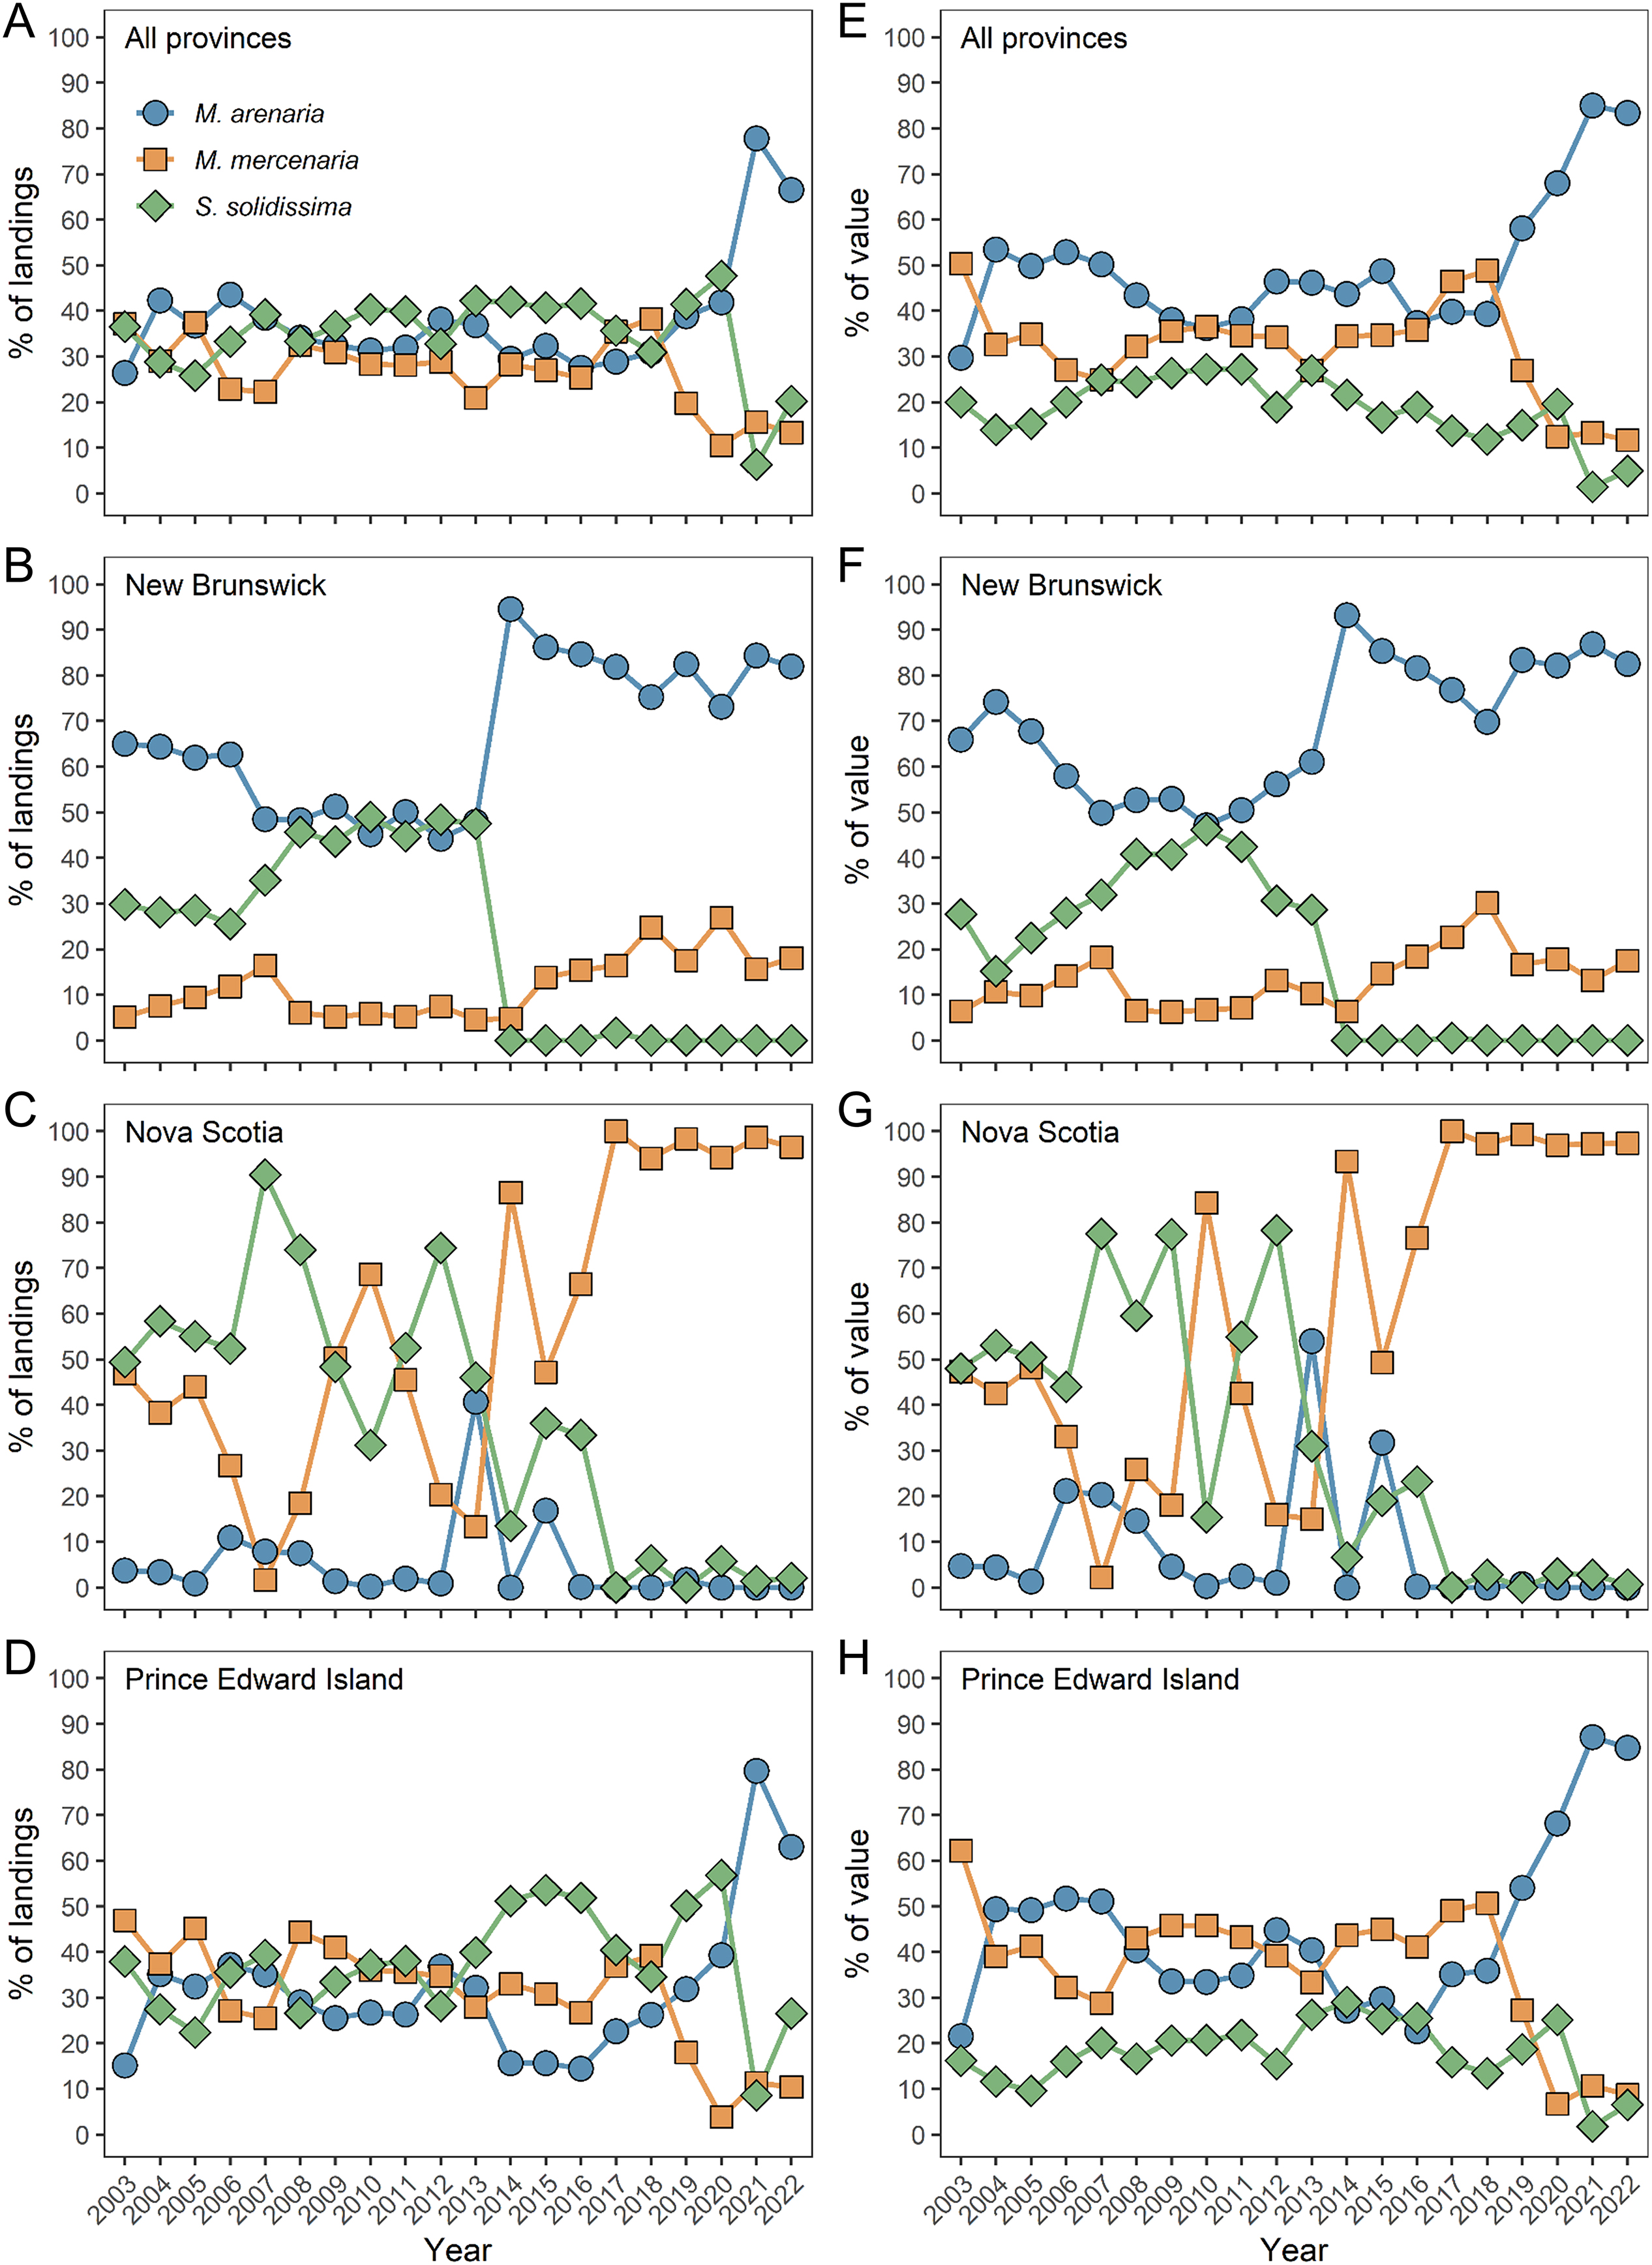
In contrast to relatively stable provincial contributions, species contributions to landings and value in the sGSL have shown dramatic changes over the past 20 years. Most notably, considering the region as a whole, sGSL clam fisheries appear to have shifted from a tri-species makeup with equitable contributions from Mya arenaria, Mercenaria mercenaria, and Spisula solidissima to a largely singe-species makeup dominated by 
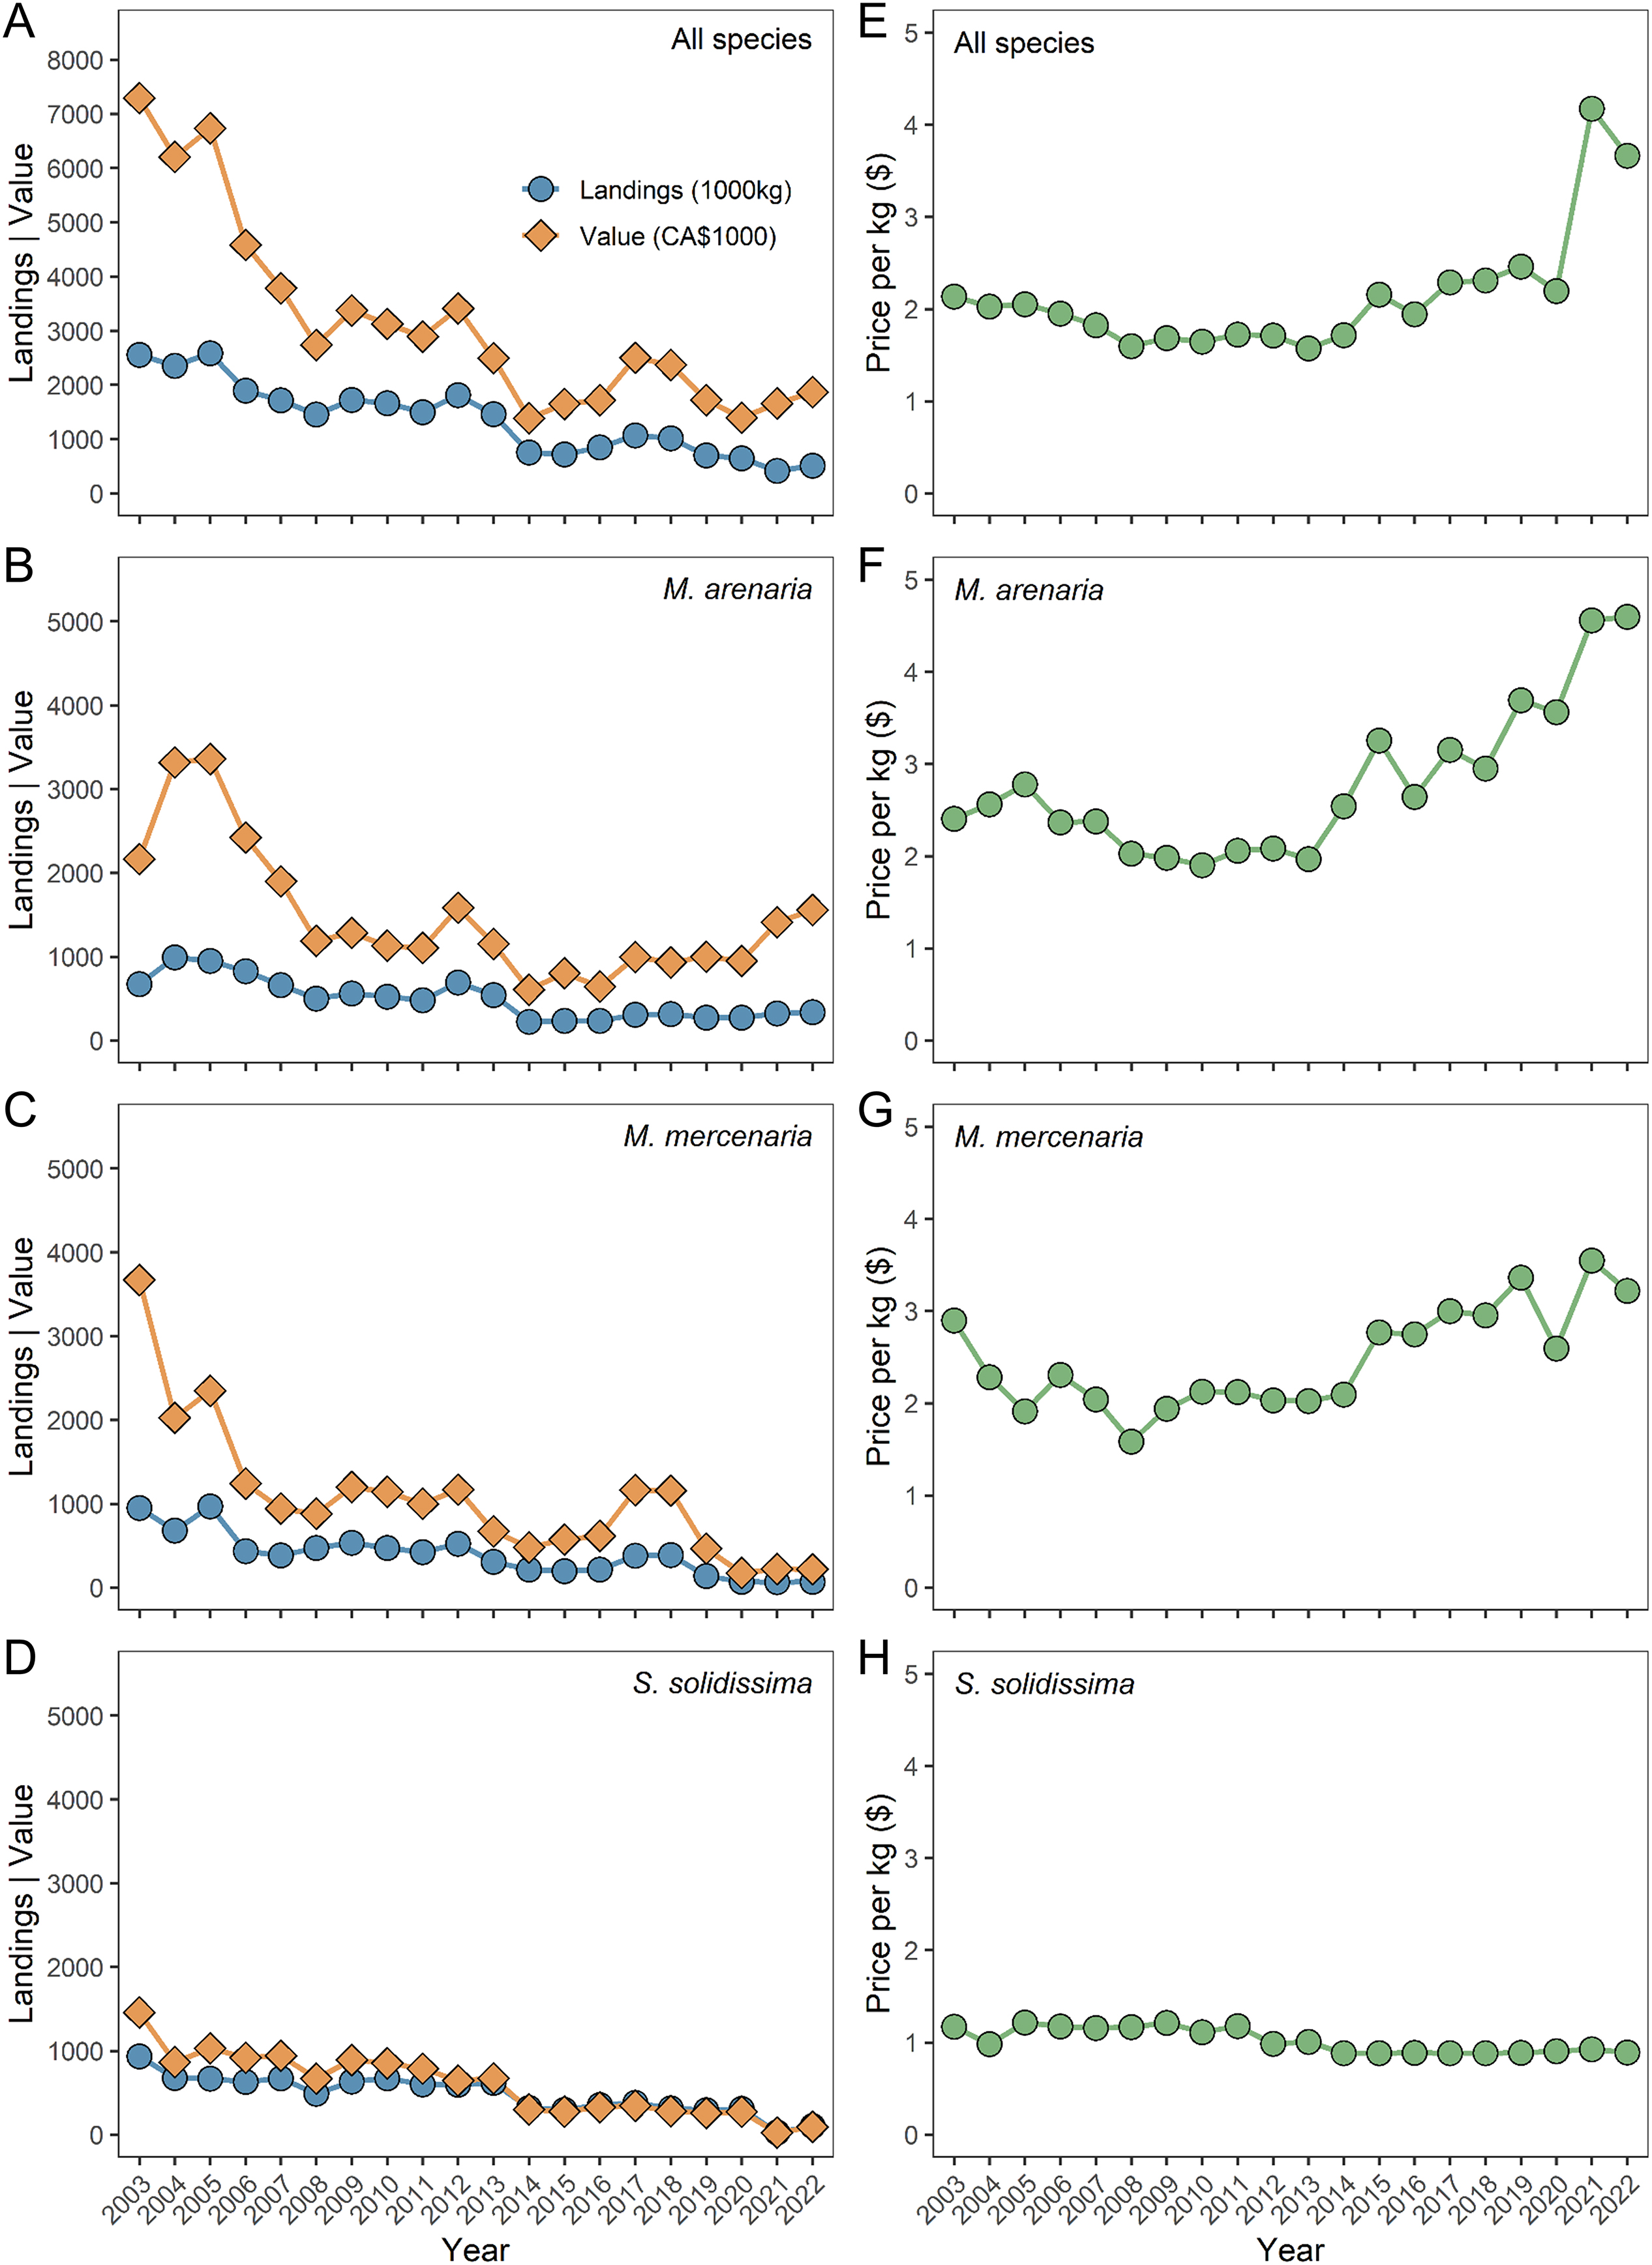
Mya arenaria since 2020. While reasons for this shift in species contributions are not conclusively documented, the rising market value (price per kg) of Mya arenaria may be influencing such a shift. Indeed, the increased price of Mya arenaria was enough to offset the decline in landed value of Mya arenaria in PEI in recent years (i.e., increased landed value of Mya arenaria in 2021–2022; Figs. 4 and 5). While the price of Mercenaria mercenaria has also increased in recent years, it has not done so to the degree that Mya arenaria has, and this smaller increase for Mercenaria mercenaria was not enough to offset declining landed value. Further, the price per kg of S. solidissima has remained fairly steady over time, displaying a very slight decrease over the time series, which may explain the sharp crash in landings for this species. Alongside market changes, it is also possible that an aging demographic of clam diggers (as highlighted in recent clam resource management meetings; formal reference unavailable) may partly influence shifts in species. For example, differences in the cost and physical difficulty to fish various clam species may drive older clam diggers to focus on species that are easier to access and less physically demanding to harvest. Furthermore, the drastic shift toward a single species harvest in PEI also coincides with the timing of the COVID-19 pandemic, which has had drastic impacts on small-scale fisheries and coastal fishing communities worldwide (Bennett et al. 2020). Herein, Mya arenaria and Mercenaria mercenaria beds are easy to access from shore and are primarily fished by hand (PEI Shellfish Association 2023). In contrast, the vast majority of commercial S. solidissima catch has historically come from draggers (i.e., fishing vessels with drag gear; Annands 2021), which are likely cost prohibitive, especially given the stagnant market value of S. solidissima and the rise of economic inflation. It is thus possible that the economic impacts of the COVID-19 pandemic (i.e., drastic increases in the price of goods and materials; Bilyk et al. 2024) may have facilitated the observed shift toward less cost-prohibitive species such as soft-shell clams and quahogs. It is important to note, however, that the observed shifts in species contributions to the sGSL as a whole did not hold true for each of the individual provinces, as NB shifted to predominantly Mya arenaria much earlier than PEI, while NS was completely dominated by Mercenaria mercenaria. Thus, localized sociocultural and socioeconomic dynamics likely influence the makeup of clam fisheries within each province, with the sGSL-wide shift being predominantly driven by PEI. Ultimately, shifting dynamics between the socioeconomic costs and benefits of harvesting different clam species, as well as an aging fisher demographic, have likely influenced the observed shifts in species composition of sGSL clam fisheries.
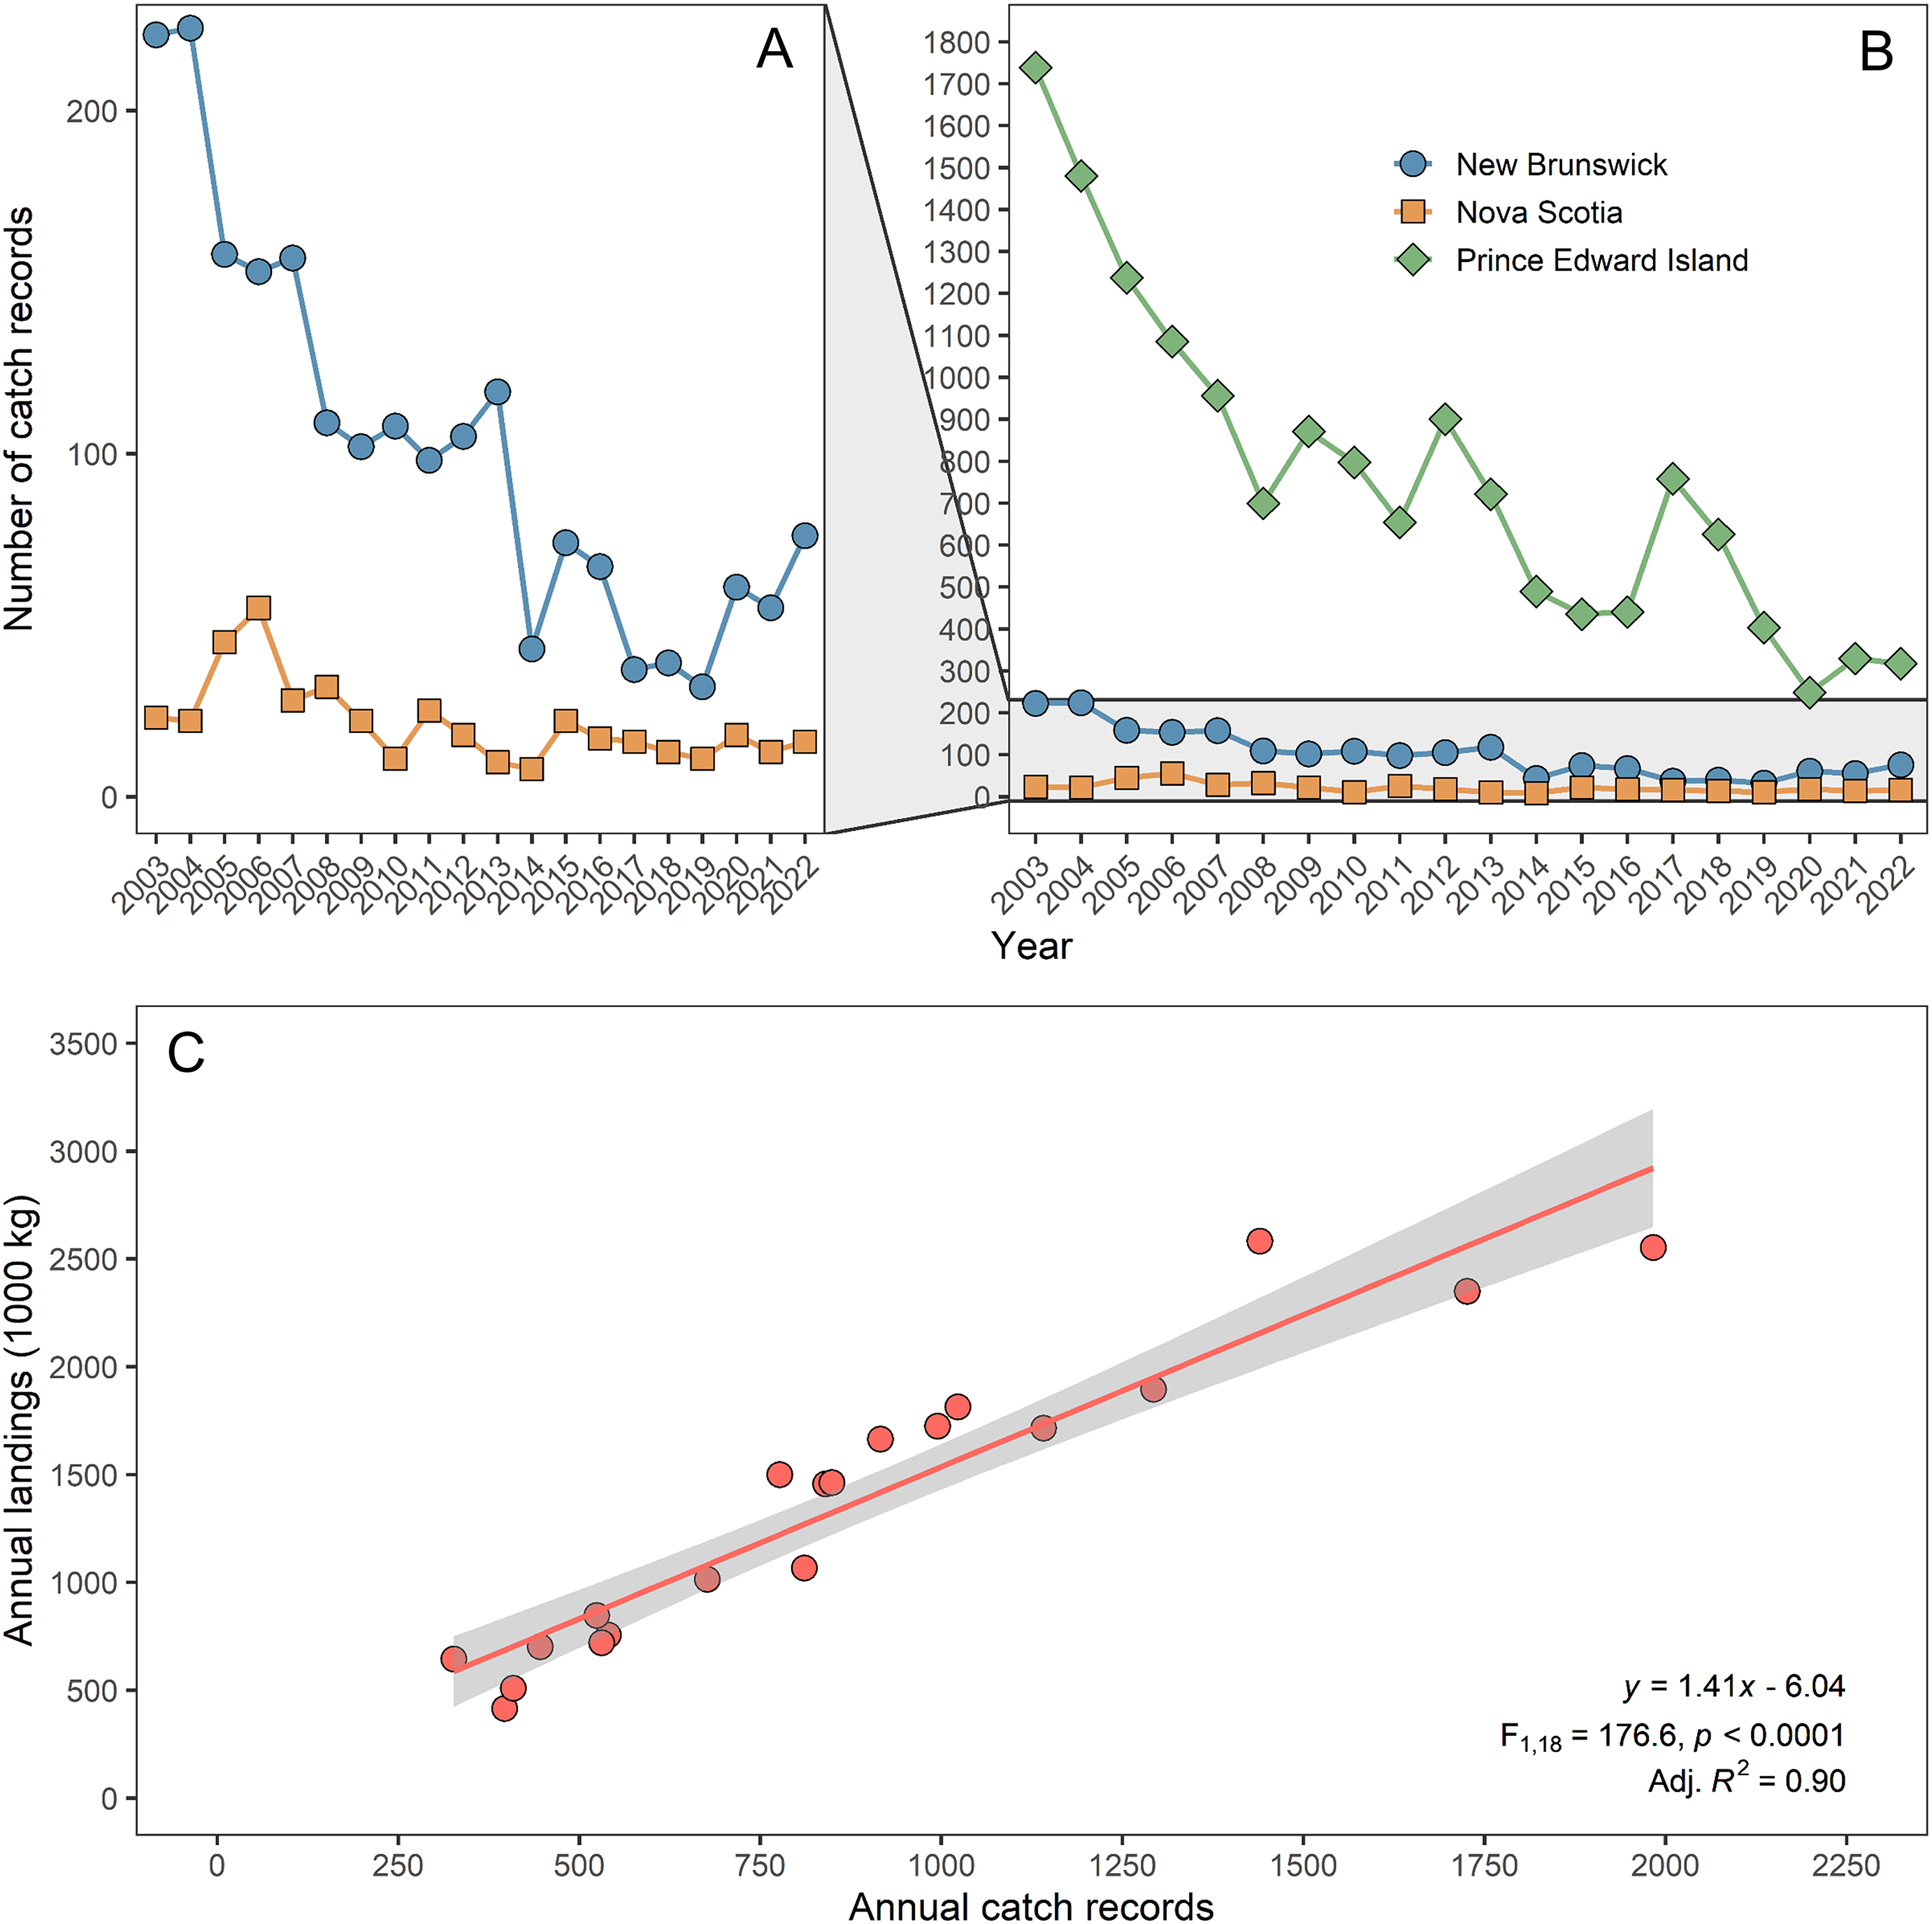
The results of this analysis ultimately underscore a declining fishery in Atlantic Canada. Over the past 20 years, reported landings have declined by >80% for the sGSL as a whole, with declines occurring for each individual province and each of the three primary fished species in the region. Likewise, catch records (i.e., active licenses + Supplement B reports; proxy of fishing effort) have also declined over this time period, and there was a strong relationship between annual catch records and annual landings. Declines in small-scale fisheries landings are not unique and there are many recent reports of such trends for such fisheries around the world (e.g., Vianna et al. 2020; Danquah et al. 2021; Warren and Steenbergen 2021; Castello et al. 2023; Treer 2023).
While definitive reasons for the decline of sGSL commercial clam fisheries cannot be obtained from the data herein, the drastic decline in catch records certainly suggests a lack of fishing activity in this region. Similar trends have recently been highlighted for other small-scale fisheries as well. For example, Treer (2023) reported declines in landings and CPUE for a Croatian small-scale fishery (multi-species), citing a lack of activity—driven by low harvest potential—as one of the likely reasons for catches. What is unclear, however, is what may be driving the lack of activity in sGSL clam fisheries. Low activity in commercial sGSL clam fisheries may be driven by a desire to fish more lucrative species; however, the price per kg, particularly for soft-shell clams, is currently fairly high compared to previous years and has been steadily increasing. On the other hand, declining activity in clam fisheries may be due to increasing costs to enter them. An aging population of clam diggers may also drive lower activity, as older diggers exiting the fisheries are not replenished by new, younger diggers pursuing more viable careers. The lack of fishing activity could also be due to declining clam populations in the region (see paragraph below for discussion), making it more difficult for clam diggers to adequately harvest financially-viable catches. Conversely, a lack of activity in commercial fisheries may be offset by increasing activity in recreational clam fisheries. Unfortunately, data on recreational fisheries in this region are non-existent, and it is not possible to determine what role recreational fisheries may have on the observed changes in commercial fisheries documented in this study. Finally, while shifts in species composition coincided with the COVID-19 pandemic, there was no evidence of the pandemic influencing fishery landings or catch record declines outside the margin of error of other years. Indeed, the largest single-year decline in landings (all species and all provinces combined) occurred between 2005 and 2006, and the largest single-year decline in catch records occurred between 2014 and 2015. In fact, the number of catch records actually increased by 70 between 2019 and 2020. Whatever the reason, declining activity in clam fishing is concerning for the future of commercial clam fisheries—a sociocultural staple for this region. While temporary breaks in fishing may be good for the conservation of these species, studies suggest that clam digging may actually benefit clam populations by facilitating and enhancing sediment quality (Clements et al. 2021). The inclusion of clam fisheries in programs which are aimed at helping new fishers enter the industry, such as the Future Fisher Program on PEI (Spencer 2023; Government of Prince Edward Island 2024), could potentially facilitate new interest in sGSL clam fisheries.
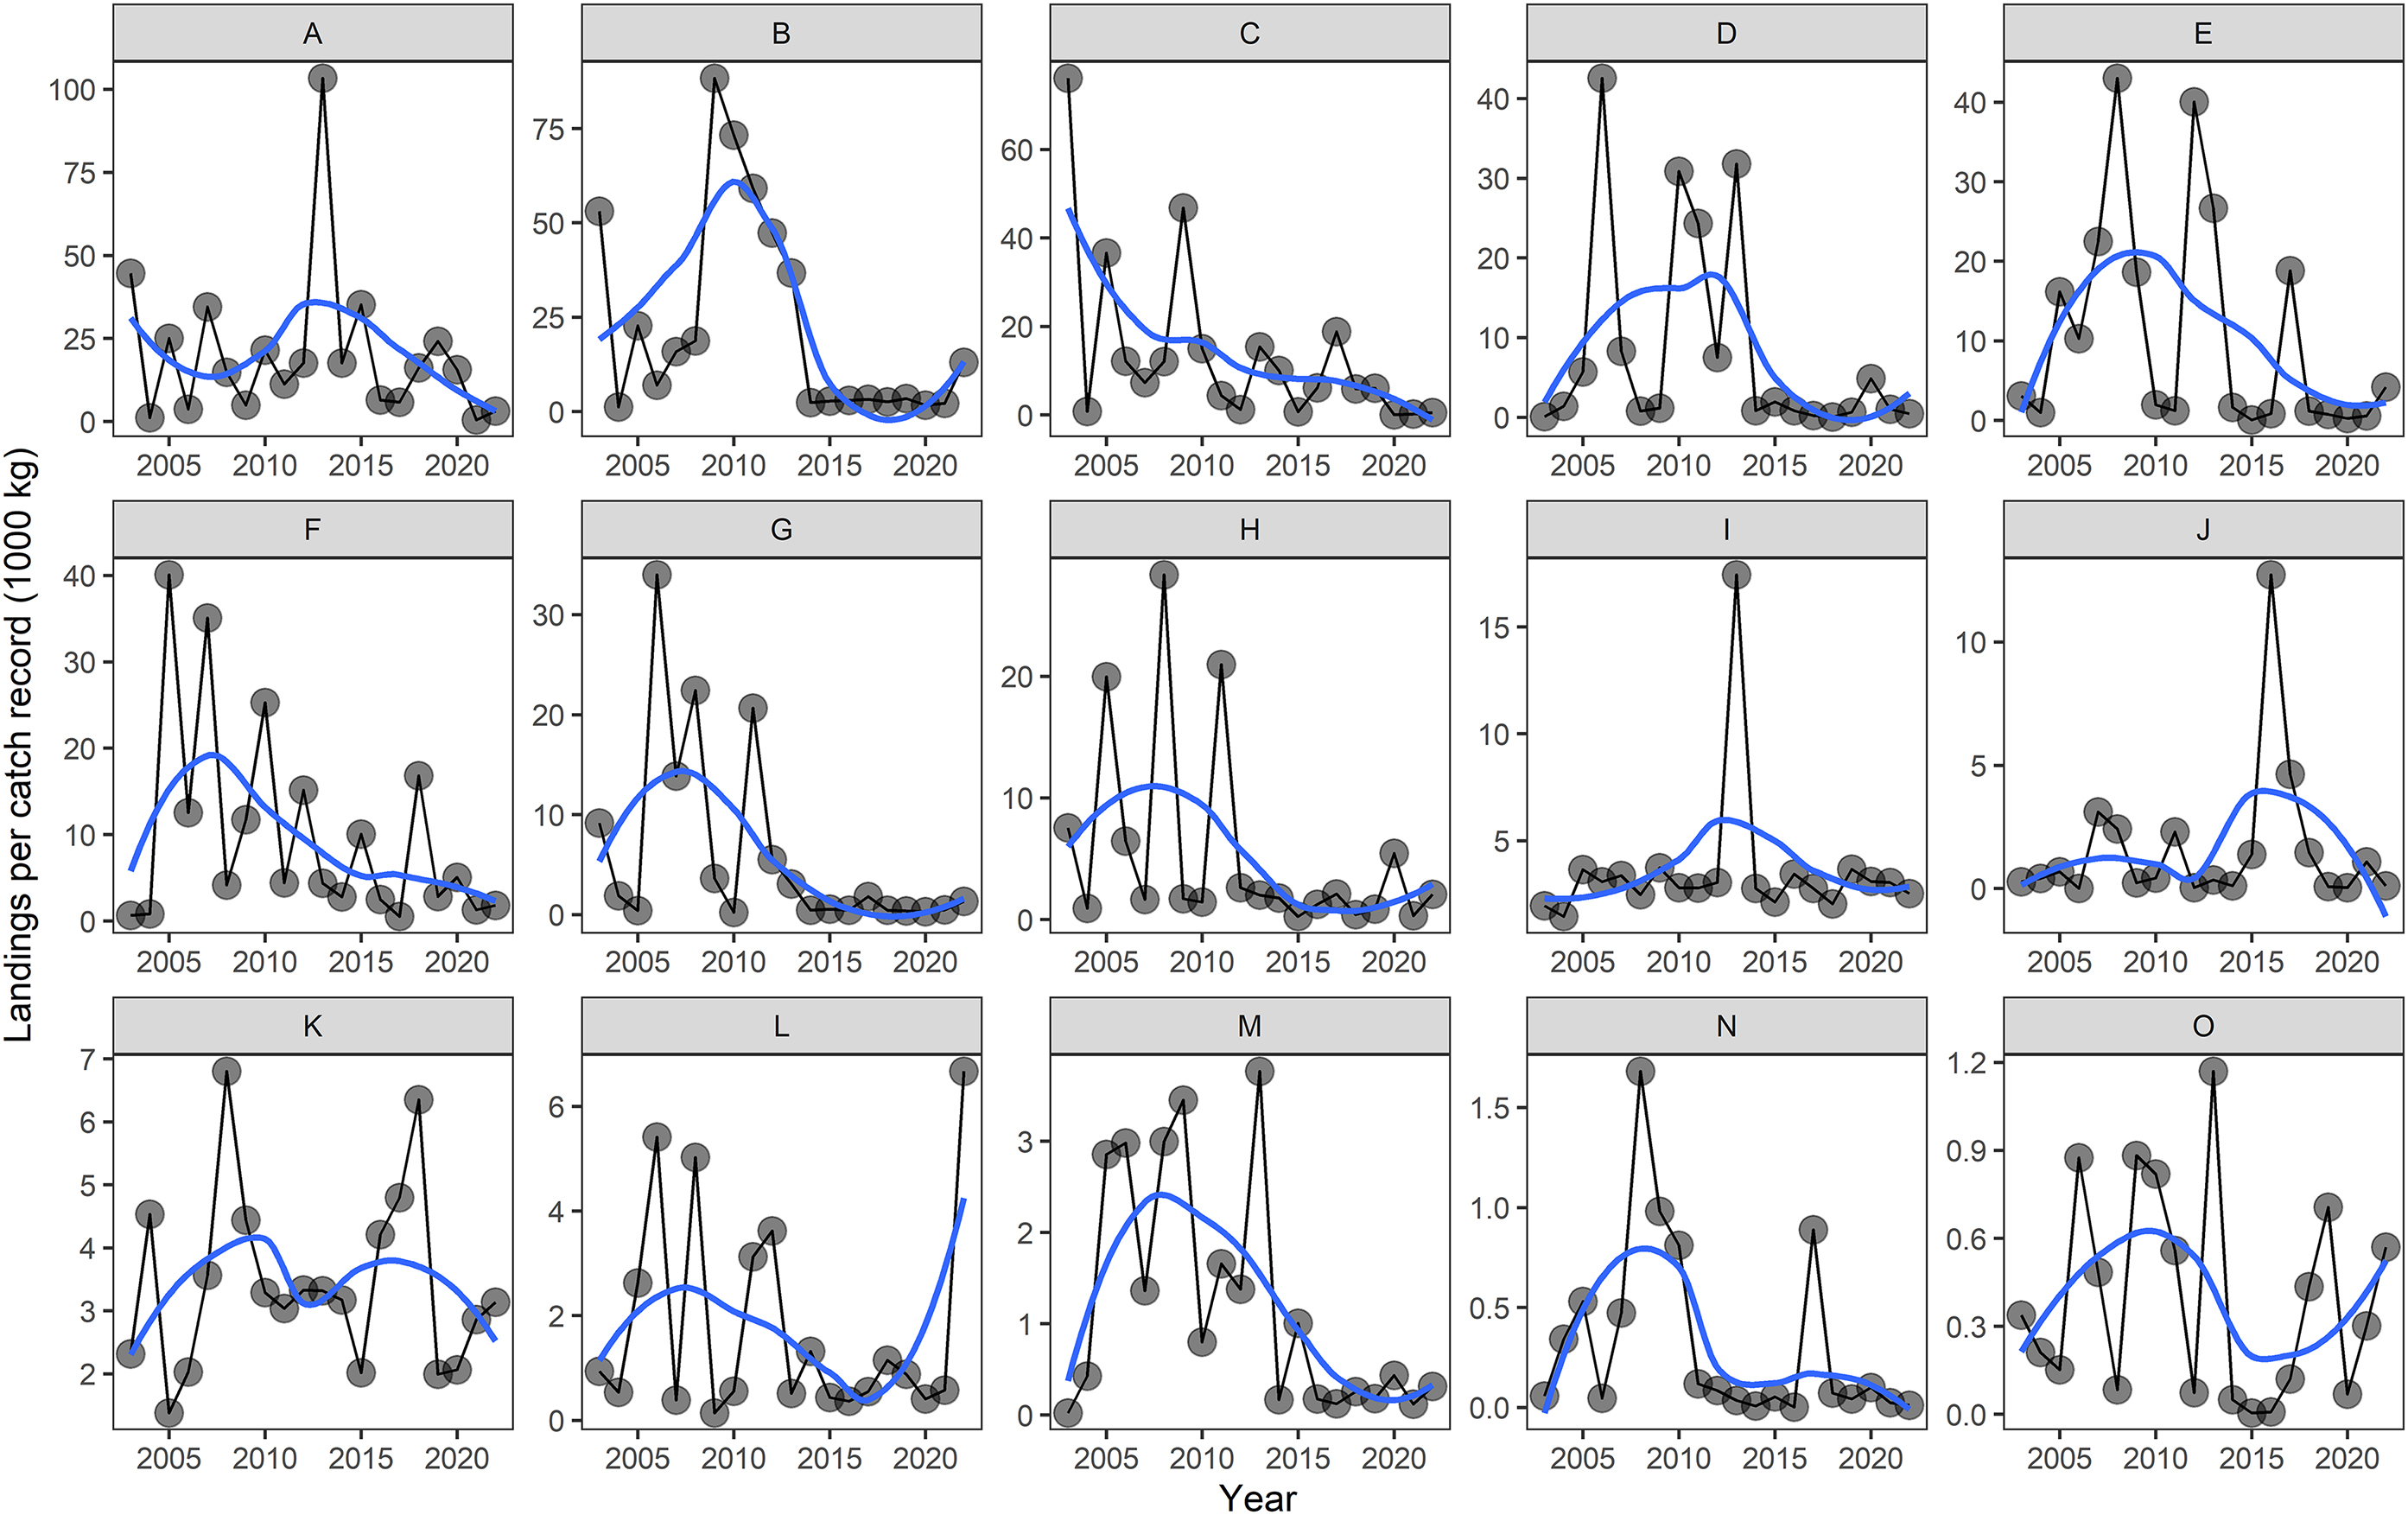
Although causative relationships between landings and population abundances cannot be strictly made from the data herein, there is some evidence to suggest that clam populations may be declining in the sGSL. Firstly, the consistent declining trends in landings per catch record (proxy of CPUE) across multiple landing places in the sGSL suggest that it is becoming increasingly difficult to fish clams in this region. This idea is further supported by anecdotal conversations with local clam diggers, who have voiced concerns about difficulties in finding clams in recent years (both publicly and directly to me in personal conversations). Furthermore, annual survey data from Kouchibouguac National Park in NB, where clam digging is stringently controlled, suggest that population abundances of soft-shell clams (Mya arenaria) have indeed declined for the past 20 years (Parks Canada, unpublished data). Thus, while population status cannot be directly inferred from landings data, there is evidence to support the idea that clam populations in this region may be declining.
If populations in the region are declining, it is critical to understand why. There are many factors that can affect clam populations, and it is difficult to pinpoint a single cause for a decline. In reality, declines often happen due to a multitude of reasons and there are multiple issues in the sGSL that can contribute to declining clam populations. Overexploitation is always a concern, but without a lack of historical data or dta on recreational fisheries, I cannot confidently attribute the patterns herein to overexploitation. Nonetheless, concerns about overexploitation of some clam stocks in the sGSL have been raised in the past (Landry 1996). Indirect fishing mortality of sub-legal sized clams could also contribute to population declines as reproductive stock could be negatively affected; however, such mortality is reported to be low (<20%; Robinson and Rowell 1990; Landry and Ouellette 1993). In the scientific literature, climate change is also a primary factor of consideration in declining fishery landings. For example, rising temperatures due to climate change may play a role in clam declines, as increasing air and seawater temperatures can negatively affect the physiology of bivalves in the sGSL and make them less robust to other environmental impacts (e.g., Clements et al. 2018a, 2018b; Clements and Hunt 2023; Talevi et al. 2023). Warming is particularly relevant for clams in the sGSL, as it is well documented that waters in the sGSL are warming rapidly (Galbraith et al. 2022, 2023, 2024). Furthermore, most clam beds are found in intertidal and shallow subtidal (<1 m) waters, which would amplify temperature effects (i.e., shallow waters warm quickly, and extreme air temperatures pose a significant threat in the intertidal zone). Eutrophication, a driver of increasing concern in the sGSL (McIver et al. 2015; Coffin et al. 2021), could also contribute to clam declines in this region, as low oxygen conditions and increasing abundances of algal species such as sea lettuce are known to negatively affect clam recruitment and burrowing behaviour (Auffrey et al. 2004; Robinson et al. 2005). Sea level rise, coupled with an increasing frequency and severity of storms, can pose a threat to clam beds via physical damage and habitat destruction (Zhang et al. 2021). Finally, biologically-mediated ecological changes such as invasive species may contribute to population declines. Herein, the establishment and rapid rise of invasive European green crabs (Carcinus maenas) in the region (Poirier et al. 2017) could certainly contribute to clam population declines. This is particularly apparent for soft-shell clams, as C. maenas predation is generally considered the most important factor in soft-shell clam declines in the northeastern United States (Beal et al. 2018). It is important to note, however, that all of these potential causes remain speculative, and understanding the direct causes of clam declines in the sGSL, should they actually be occurring, require further in-depth research.
A stated previously, landings data do not necessarily indicate population or stock status (de Mutsert et al. 2008; Branch et al. 2010; Pauly et al. 2013). Indeed, landings data come with many uncertainties, owing to inaccuracies and mistakes in reported catches and/or sales, a lack of detail on fishing methods and effort, and the influence of various external factors such as regulatory changes, market shifts, and environmental variability. More detailed information related to fishing effort, including fishing hours and the location and area coverage of fishing activities, could provide the necessary data to measure population status. Furthermore, requiring such information for recreational fisheries could provide more robust information regarding the true impact of clam digging in this region, as commercial landings alone underestimate the true impact of fishing. While it may not be feasible to require such information from commercial and recreational clam diggers, building respectful and fruitful collaborations with individual diggers who may be willing to share such information can provide a first step in this process. Additionally, supplementing landings data with fishery-independent population assessments is reported to increase the accuracy of population assessments (Vecchio et al. 2023). While bed-scale assessments of sGSL clams have been conducted in the past (Hicks and Ouellette 2011; LeBlanc 2015), fishery-independent clam surveys have largely been absent over the past decade, most probably due to limited resources and the labour-intensive nature of sampling clam beds. Collaborative efforts between various government, non-government, industry, academic, and/or community groups are necessary to increase the scope and frequency of surveys. Resources for such collaborative surveys are limited, however, and require investment from a broad suite of stakeholders. The development of efficient and cost-effective assessment methods, such as using visible siphon holes to estimate clam density (Clements et al. 2024), can help reduce costs and facilitate fishery-independent assessments moving forward.
While the results presented here are regional in focus, they provide a cautionary tale for small-scale clam fisheries elsewhere across the globe. Given their ecology, clam fisheries worldwide–particularly those in shallow, intertidal waters–may be vulnerable to the impacts described here. It is thus important to document such fishery declines in a standardized manner to better understand the impacts of declining clam fisheries on global small-scale fisheries production (Rousseau et al. 2019b).

Acknowledgements

I wish to extend a sincere thank you to Gerald Hamilton, Lindsay Lafleche, and the entire team in the Statistics Division at DFO Gulf for data consultation. I also want to thank Dr. Remi Sonier (DFO Gulf), Marc Ouellette (DFO Gulf), Dr. Jacob Burbank (DFO Gulf), and Dr. Bruno Gianasi (DFO Quebec) for constructive feedback on an earlier draft of this manuscript. Thanks also to DFO Resource Management, particularly Nicholas Levangie, Danielle Goff-Beaton, Rachel Friolet, Melanie Daigle, Benjamin Moore, and Sandra Comeau for their valuable input on an earlier version of the manuscript in regards to clam fishery management details. Finally, I want to thank three anonymous reviewers for their constructive comments which helped improve the manuscript.

References

Annands. 2021. Bar clams [online]. Available from https://annands.com/bar-clams/ [accessed 9 April 2025].
Auffrey L.M., Robinson S.M.C., Barbeau M.A. 2004. Effect of green macroalgal mats on burial depth of soft-shelled clams Mya arenaria. Marine Ecology Progress Series, 278: 193–203.
Beal B.F., Coffin C.R., Randall S.F., Goodenow C.A. Jr., Pepperman K.E., Ellis B.W., et al. 2018. Spatial variability in recruitment of an infaunal bivalve: experimental effects of predator exclusion on the softshell clam (Mya arenaria L.) along three tidal estuaries in southern Maine, USA. Journal of Shellfish Research, 37: 1–27.
Bennett N.J., Finkbeiner E.M., Ban N.C., Belhabib D., Jupiter S.D., Kittinger J.N., et al. 2020. The COVID-19 pandemic, small-scale fisheries and coastal fishing communities. Coastal Management, 48: 336–347.
Bilyk O., Khan M., Kostyshyna O. 2024. Pricing behaviour and inflation during the COVID-19 pandemic: Insights from consumer prices microdata. Bank of Canada Staff Analytical Note 2024-6. Available from  https://www.bankofcanada.ca/2024/04/staff-analytical-note-2024-6/ [accessed 9 April 2025].
Blanton R. 2023. Giant clam symbolism and meaning [online]. Available from https://truespiritanimal.com/giant-clam-symbolism-and-meaning/ [accessed 9 April 2025].
Branch T.A., Watson R., Fulton E.A., Jennings S., McGillard C.R., Pablico G.T., et al. 2010. The trophic fingerprint of marine fisheries. Nature, 468: 431–435.
Brulotte S. 2023. Results of soft-shell clam (Mya arenaria) surveys from 2016 to 2020 on the Upper North Shore and update of surveys from 2001 to 2014 in Quebec. Canadian Science Advisory Secretariat Research Document, 2023/035. p. xvi + 170.
Carss D.N., Brito A.C., Chainho P., Ciutat A., de Montaudouin X., Fernández Otero R.M., et al. 2020. Ecosystem services provided by a non-cultured shellfish species: the common cockle Cerastoderma edule. Marine Environmental Research, 158: 104931.
Castello L., Carvalho F., Onana Ateba N.O., Busange A.K., Ockowitz A., Frimpong E. 2023. An approach to assess data-less small-scale fisheries: examples from Congo rivers. Reviews in Fish Biology and Fisheries, 33: 593–610.
CFIA. 2023. Canadian Shellfish Sanitation Program manual [online]. Available from https://inspection.canada.ca/en/food-guidance-commodity/fish/canadian-shellfish-sanitation-program#c2 [accessed 9 April 2025].
Clements J.C., Hunt H.L. 2023. Effects of ocean warming and acidification on soft-shell clams. In The soft-shell clam Mya arenaria: biology, fisheries, and mariculture. Edited by V Kennedy, B Beal. American Fisheries Society, Bethesda, Maryland. pp. 365–382.
Clements J.C., Davidson J.D.P., Gunn McQuillan J., Comeau L.A. 2018a. Increased mortality of harvested eastern oysters (Crassostrea virginica) is associated with air exposure and temperature during a spring fishery in Atlantic Canada. Fisheries Research, 206: 27–34.
Clements J.C., Harrison S., Hunt J., Brennan I., Hunt H.L., Sonier R. 2024. Can siphon hole morphometrics be used for population assessments of intertidal soft-shell clams, Mya arenaria? Estuaries and Coasts, 47: 2423–2438.
Clements J.C., Hicks C., Tremblay R., Comeau L.A. 2018b. Elevated seawater temperature, not pCO2, negatively affects post-spawning adult mussels (Mytilus edulis) under food limitation. Conservation Physiology, 6: cox078.
Clements J.C., Leblanc A., Coomber C., Comeau L.A. 2021. Comparative evidence for harvesting-driven enhancement of clam beds in northeastern New Brunswick, Canada. Regional Studies in Marine Science, 43: 101690.
Coffin M.R.S., Poirier L.A., Clements J.C., Dickson E., Guyondet T., Crane C.J., van den Heuvel M.R. 2021. Dissolved oxygen as a Marine Environmental Quality (MEQ) measure in upper estuaries of the southern Gulf of St. Lawrence: implications for nutrient management and eelgrass (Zostera marina) coverage. Canadian Science Advisory Secretariat Research Document, 2021/056. p. iv + 29.
Cranford P.J. 2019. Chapter 8: magnitude and extent of water clarification services provided by bivalve suspension feeding. In Goods and services of marine bivalves. Edited by A.C. Smaal, J.G. Ferreira, J. Grant, J.K. Petersen, Ø. Strand. Springer Nature, Cham, Switzerland. pp. 119–141.
Danquah J.A., Roberts C.O., Appiah M. 2021. Effects of decline in fish landings on the livelihoods of coastal communities in central region of Ghana. Coastal Management, 49: 617–635.
de Mattos S.M.G., Wojciechowski M.J., Macnaughton A.E., da Silva G.H.G., Maia A., Carolsfeld J. 2017. Implementing the small-scale fisheries guidelines: lessons from Brazilian clam fisheries. In The small-scale fisheries guidelines. Edited by S. Jentoft, R. Chuenpagdee, M. Barragán-Paladines, N.N. Franz. Springer Nature, Cham, Switzerland. pp 473–494.
de Mustert K., Cowan J.H. Jr., Essington T.E., Hilborn R. 2008. Reanalyses of Gulf of Mexico fisheries data: landings can be misleading in assessments of fisheries and fisheries ecosystems. Proceedings of the National Academy of Sciences, 105: 2740–2744.
DFO. 2001. Integrated Management Plan clam fishery: Eastern New Brunswick Area 2001-2006 [online]. Available from https://waves-vagues.dfo-mpo.gc.ca/library-bibliotheque/258964.pdf [accessed 9 April 2025].
DFO. 2018. New online map makes shellfish harvesting safer [online]. Available from https://www.canada.ca/en/fisheries-oceans/news/2018/03/new-online-map-makes-shellfish-harvesting-safer.html [accessed 9 April 2025].
DFO. 2022a. Maritime Provinces Fishery Regulations: SOR/93-55 [online]. Available from https://laws-lois.justice.gc.ca/eng/regulations/sor-93-55/page-1.html [accessed 9 April 2025].
DFO. 2022b. 2022-2024 - Clam Management Plan for Eastern New Brunswick [online]. Available from https://www.glf.dfo-mpo.gc.ca/en/node/12670 [accessed 9 April 2025].
DFO. 2022c. Recreational Fisheries Notice: Conservation Measures for clams in eastern New Brunswick, Gulf Nova Scotia and Prince Edward Island [online]. Available from https://www.glf.dfo-mpo.gc.ca/glf/en/conservation-measures-clams-eastern-new-brunswick-gulf-nova-scotia-and-prince-edward-island [accessed 9 April 2025].
DFO. 2022d. Stock status update of the Arctic surfclam (Mactromeris polynyma) on Banquereau and Grand Bank to the end of the 2020 fishing season. Canadian Science Advisory Secretariat Science Response, 2022/034.21p.
DFO. 2024. Management of Contaminated Fisheries Regulations: SOR/90-351 [online]. Available from https://laws-lois.justice.gc.ca/eng/regulations/SOR-90-351/FullText.html [accessed 9 April 2025].
FAO. 2015. Voluntary guidelines for securing sustainable small-scale fisheries in the context of food security and poverty eradication. Food and Agriculture Organization of the United Nations, Rome, Italy.18p.
FAO. 2018. The state of world fisheries and aquaculture 2018 (SOFIA). Food and Agriculture Organization of the United Nations, Rome, Italy. 210p.
Freeman K. 1997. Atlantic Nova Scotia softshell clam (Mya arenaria). DFO Atlantic Fisheries Stock Status Report 96/128E.
Galbraith P.S., Chassé J., Dumas J., Shaw J.-L., Caverhill C., Lefaivre D., Lafleur C. 2022. Physical oceanographic conditions in the Gulf of St. Lawrence during 2021. Canadian Science Advisory Secretariat Research Document 2022/034. iv + 85p.
Galbraith P.S., Chassé J., Shaw J.-L., Dumas J., Bourassa M-N. 2024. Physical oceanographic conditions in the Gulf of St. Lawrence during 2023. Canadian Technical Report of Hydrography and Ocean Sciences 378, v + 91p.
Galbraith P.S., Chassé J., Shaw J.-L., Dumas J., Lefaivre D., Bourassa M-N. 2023. Physical oceanographic conditions in the Gulf of St. Lawrence during 2022. Canadian Technical Report of Hydrography and Ocean Sciences 354, v + 88p.
Gianelli I., Martínez G., Defeo O. 2015. An ecosystem approach to small-scale co-managed fisheries: the yellow clam fishery in Uruguay. Marine Policy, 62: 196–202.
Gianelli I., Ortega L., Pittman J., Vasconcellos M., Defeo O. 2021. Harnessing scientific and local knowledge to face climate change in small-scale fisheries. Global Environmental Change, 68: 102253.
Googoo M. 2017. Archaeologist researching French/Mi'kmaw trade in 1600s at Fort St. Louis. Ku'ku'kwes News: Independent Indigenous News [online]. Available from http://kukukwes.com/2017/08/21/archeologist-researching-frenchmikmaw-trade-in-1600s-at-fort-st-louis/ [accessed 9 April 2025].
Government of Prince Edward Island. 2024. Apply for the Future Fisher Program [online]. Available from https://www.princeedwardisland.ca/en/service/apply-for-the-future-fisher-program [accessed 9 April 2025].
Hicks C., Ouellette M. 2011. The state of soft-shell clam (Mya arenaria) populations in three regions of eastern New Brunswick. Canadian Industry Report of Fisheries and Aquatic Sciences, 286, viii + 31.
Kurlansky M. 2006. The big oyster: history on the half shell. Random House Trade Paperbacks, New York, New York. 336p.
Landry T. 1996. Southern gulf soft shell clam. DFO Atlantic Fisheries Stock Status Report 96/101E.
Landry T., Ouellette M. 1993. Suivi de la peche au rateau hydraulique sur des stocks de myes dans la baie de Miramichi, Nouveau-Brunswick - 1992. Rapport Technique Canadien des Sciences Halieutiques et Aquatiques, 1921: 14.
Landry T., Sephton T.W. 1996. Southern Gulf Northern Quahog. DFO Atlantic Fisheries Stock Status Report 96/102E.
LeBlanc A.R. 2015. Population assessments of soft-shell clams (Mya arenaria) in the Eel River Bar, New Brunswick, from 2010 to 2013. Canadian Manuscript Report of Fisheries and Aquatic Sciences, 3063, vii + 13p.
Lee H-K. 2023. A study on the symbolism of seashells. School Counselling and Sandplay, 5: 18–33.
Lloret J., Cowx I.G., Cabral H., Castro M., Font T., Gonçalves J.M.S., et al. 2018. Small-scale coastal fisheries in European Seas are not what they were: ecological, social and economic changes. Marine Policy, 98: 176–186.
Lopes M.L., Rodrigues J.P., Crespo D., Dolbeth M., Calado R., Lillebø I. 2018. Functional traits of a native and an invasive clam of the genus Ruditapes occurring in sympatry in a coastal lagoon. Scientific Reports, 8: 16901.
McIver R., Milewski I., Lotze H.K. 2015. Land use and nitrogen loading in seven estuaries along the southern Gulf of St. Lawrence, Canada. Estuarine, Coastal and Shelf Science, 165: 137–148.
Pauly D., Hilborn R., Branch T. 2013. Fisheries: does catch reflect abundance? Nature, 494: 303–306.
Pedersen T. 2024. ggforce: Accelerating 'ggplot2'. R package version 0.4.2.Available from https://CRAN.R-project.org/package=ggforce [accessed 9 April 2025].
PEI Shellfish Association. 2023. Wild by choice [online]. Available from https://www.peishellfishassociation.com/about [accessed 17 February 2024].
Pictou S.M. 2015. Small ‘t’ treaty relationships without borders: Bear River First Nation, clam harvesters, the Bay of Fundy Resource Centre and the World Forum of Fisher Peoples. Anthropologica, 57: 457–467.
Pittman J., Gianelli I., Trinchín R., Gutiérrez N., de la Rosa A., Martínez G., et al. 2019. Securing sustainable small-scale fisheries through comanagement: the yellow clam fishery in Uruguay. In Securing sustainable small-scale fisheries: sharing good practices from around the world. Edited by L. Westlund, J. Zelasney. Food and Agriculture Organization of the United Nations, Rome, Italy. pp. 9–37.
Poirier L.A., Ramsay A.P., St-Hilaire S., Quijón P.A. 2017. Revisiting recent history: records of occurrence and expansion of the European green crab across Prince Edward Island, Atlantic Canada. Marine Biodiversity Records, 10: 30.
Prins H.E.L. 1996. The Mi'kmaq: resistance, accommodation, and cultural survival. Harcourt Brace College Publishers, Boston, Massachusetts. 250p.
R Core Team. 2022. R: a language and environment for statistical computing. R Foundation for Statistical Computing, Vienna. Available from https://www.R-project.org/.
Roa-Ureta R.H., Henríquez J., Molinet C. 2020. Achieving sustainable exploitation through co-management in three Chilean small-scale fisheries. Fisheries Research, 230: 105674.
Robinson S.M.C., Rowell T.W. 1990. A reexamination of the incidental fishing mortality of the traditional clam hack on the soft shell clam, Mya arenaria, Linnaeus 1758. Journal of Shellfish Research, 9: 283–289.
Robinson S.M.C., Auffrey L.M., Barbeau M.A. 2005. Far-field impacts of eutrophication on the intertidal zone in the Bay of Fundy, Canada with emphasis on the soft-shell clam, Mya arenaria. In Environmental effects of marine finfish aquaculture. Edited by B.T. Hargrave. Springer, Berlin, Germany. pp. 253–274.
Rousseau Y., Watson R.A., Blanchard J.L., Fulton E.A. 2019a. Evolution of global marine fishing fleets and the response of fished resources. Proceedings of the National Academy of Sciences, 116: 12238–12243.
Rousseau Y., Watson R.A., Blanchard J.L., Fulton E.A. 2019b. Defining global artisanal fisheries. Marine Policy, 108:103634.
RStudio Team. 2020. RStudio: integrated development for R. RStudio, PBC, Boston. Available from https://posit.co/products/open-source/rstudio/ [accessed 9 April 2025].
Schmidt A.F., Finan C. 2018. Linear regression and the normality assumption. Journal of Clinical Epidemiology 98: 146–151.
Sephton T.W. 1996. Southern bar clam. DFO Atlantic Fisheries Stock Status Report 96/100E.
Silas M.O., Mgeleka S.S., Polte P., Sköld M., Lindberg R., de la Torre-Castro M., Gullström M. 2020. Adaptive capacity and coping strategies of small-scale coastal fisheries to declining fish catches: insights from Tanzanian communities. Environmental Science & Policy, 108: 67–76.
Spencer B. 2023. P.E.I. fisheries minister looking to expand program supporting new lobster fishers. CBC News [online]. Available from https://www.cbc.ca/news/canada/prince-edward-island/pei-legislature-new-fishers-support-program-expansion-1.6870382 [accessed 9 April 2025].
Sullivan D. 2007. Digging into the past: clam harvesting in the Annapolis Basin. Report for the Bay of Fundy Marine Resource Centre. 35 p. Available from http://www.coastalcura.ca/documents/historic_review_final_report.pdf [accessed 9 April 2025].
Talevi J., Steeves L., Coffin M., Guyondet T., Sakamaki T., Comeau L., Filgueira R. 2023. The physiological state of four commercially important bivalve species during a naturally occurring heatwave. Canadian Journal of Zoology, 101: 913–929.
Tidd A.N., Caballero V., Ojea E., Watson R.A., Molinos J.G. 2023. Estimating global artisanal fishing fleet responses in an era of rapid climate and economic change. Frontiers in Marine Science, 10: 997014.
Tomasic N. 2023. Balancing privacy with access to information for commercial fisheries data: a critical review of Fisheries and Oceans Canada’s ‘rule of five’ policy. FACETS, 8: 1–11.
Treer T. 2023. Decline of artisanal fisheries in the Croatian section of the Sava River. Croatian Journal of Fisheries, 81: 45–48.
Vaughn C.C. 2018. Ecosystem services provided by freshwater mussels. Hydrobiologia, 810: 15–27.
Vaughn C.C., Hakenkamp C.C. 2008. The functional role of burrowing bivalves in freshwater ecosystems. Freshwater Biology, 46: 1431–1446.
Vecchio J.L., Bubley W.J., Smart T.I. 2023. Increased fishery-independent sampling effort results in improved population estimates for multiple target species. Frontiers in Marine Science, 10: 1192739.
Vianna G.M.S., Hehre E.J., White R., Hood L., Derrick B., Zeller D. 2020. Long-term fishing catch and effort trends in the Republic of the Marshall Islands, with emphasis on the small-scale sectors. Frontiers in Marine Science, 6: 828.
Warren C., Steenbergen D.J. 2021. Fisheries decline, local livelihoods and conflicted governance: an Indonesian case. Ocean & Coastal Management, 202: 105498.
Watson R.A., Tidd A. 2018. Mapping nearly a century and a half of global marine fishing: 1869–2015, Marine Policy, 93: 171–177.
Wisjman J.W.M., Troost K., Fang J., Roncarati A. 2019. Chapter 2 : global production of marine bivalves. Trends and challenges. In Goods and services of marine bivalves. Edited by A.C. Smaal, J.G. Ferreira, J. Grant, J.K. Petersen, Ø. Strand. Springer Nature, Cham, Switzerland. pp. 7–26.
Zeilis A., Hothorn T. 2002. Diagnostic checking in regression relationships. R News, 2: 7–10.
Zhang Y., Wang G., Li Q., Huang W., Liu X., Chen C., et al. 2021. Vulnerability assessment of nearshore clam habitat subject to storm waves and surge. Scientific Reports, 11: 569.

Supplementary material

Supplementary Material 1 (PDF / 147 KB).
Supplementary Material 2 (R / 50 KB).
Supplementary Material 3 (CSV / 3 KB).
Supplementary Material 4 (CSV / 6 KB).
Supplementary Material 5 (CSV / 4 KB).
Supplementary Material 6 (CSV / 2 KB).
Supplementary Material 7 (CSV / 9 KB).
Supplementary Material 8 (CSV / 1 KB).
Supplementary Material 9 (CSV / 1 KB).
Supplementary Material 10 (CSV / 7 KB).
Supplementary Material 11 (CSV / 11 KB).

Information & Authors

Information

Published In

cover image FACETS
FACETS
Volume 102025
Pages: 1 - 16
Editors: Andrea Olive and Jacob Brownscombe

History

Received: 10 October 2024
Accepted: 6 February 2025
Version of record online: 24 April 2025

Data Availability Statement

Data and annotated R code used in the analyses are provided as Supplementary Material alongside the article; however, some specific values within the datasets needed to be redacted for data privacy rules. These values are denoted by the letter “R” within individual cells of the datasets.

Key Words

  1. artisanal fisheries
  2. bivalves
  3. coastal fisheries
  4. fishery dynamics
  5. shellfisheries

Sections

Subjects

Authors

Affiliations

Fisheries and Oceans Canada, 343 Université Ave., Moncton, NB E1C 9B6, Canada
Author Contributions: Conceptualization, Data curation, Formal analysis, Investigation, Methodology, Writing – original draft, and Writing – review & editing.
Jeff C. Clements served as Subject Editor at the time of manuscript review and acceptance; peer review and editorial decisions regarding this manuscript were handled by Andrea Olive and Jacob Brownscombe.

Author Contributions

Conceptualization: JCC
Data curation: JCC
Formal analysis: JCC
Investigation: JCC
Methodology: JCC
Writing – original draft: JCC
Writing – review & editing: JCC

Metrics & Citations

Metrics

Other Metrics

Citations

Cite As

Export Citations

If you have the appropriate software installed, you can download article citation data to the citation manager of your choice. Simply select your manager software from the list below and click Download.

There are no citations for this item

View Options

View options

PDF

View PDF

Figures

Tables

Media

Share Options

Share

Share the article link

Share on social media