3.1. Mercury concentrations in whole blood
Across all sturgeon sampled, whole blood [THg] ranged from 108 to 5464 ng/g dw and averaged 761 ± 1121 ng/g dw. These concentrations are 2-3 times higher than [MeHg] in whole blood sampled from 35 Atlantic sturgeon (
Acipenser oxyrhynchus), which ranged from 30 to 250 ng/g dw (
Mallory et al. 2018). Conversely, our [THg] range was 2-3 times lower than [THg] from blood spots collected from Arctic char (
Salvelinus alpinus, ∼200–16 900 ng/g dw, assuming a percent moisture of 80%), another long-lived and cold-water fish (
Barst et al. 2020). Overall, the blood [THg] measured herein fell below the estimated lowest-observed-adverse-effect level in birds, noted by
Scheuhammer et al. (2015), of 3 μg/g ww (or roughly 15 000 ng/g dw), suggesting that concentrations in namew are not causing significant harm to fish health. We recognize that a fish benchmark would be more applicable; we were unable to find one based on fish blood specifically and thus chose to include the bird metric for reference. If one exists, we suggest it is more clearly discussed where applicable. Overall, the lack of Hg data in fish blood available in relevant literature is notable. For example,
Webb et al. (2006) report collecting blood, but do not report any data or results therein.
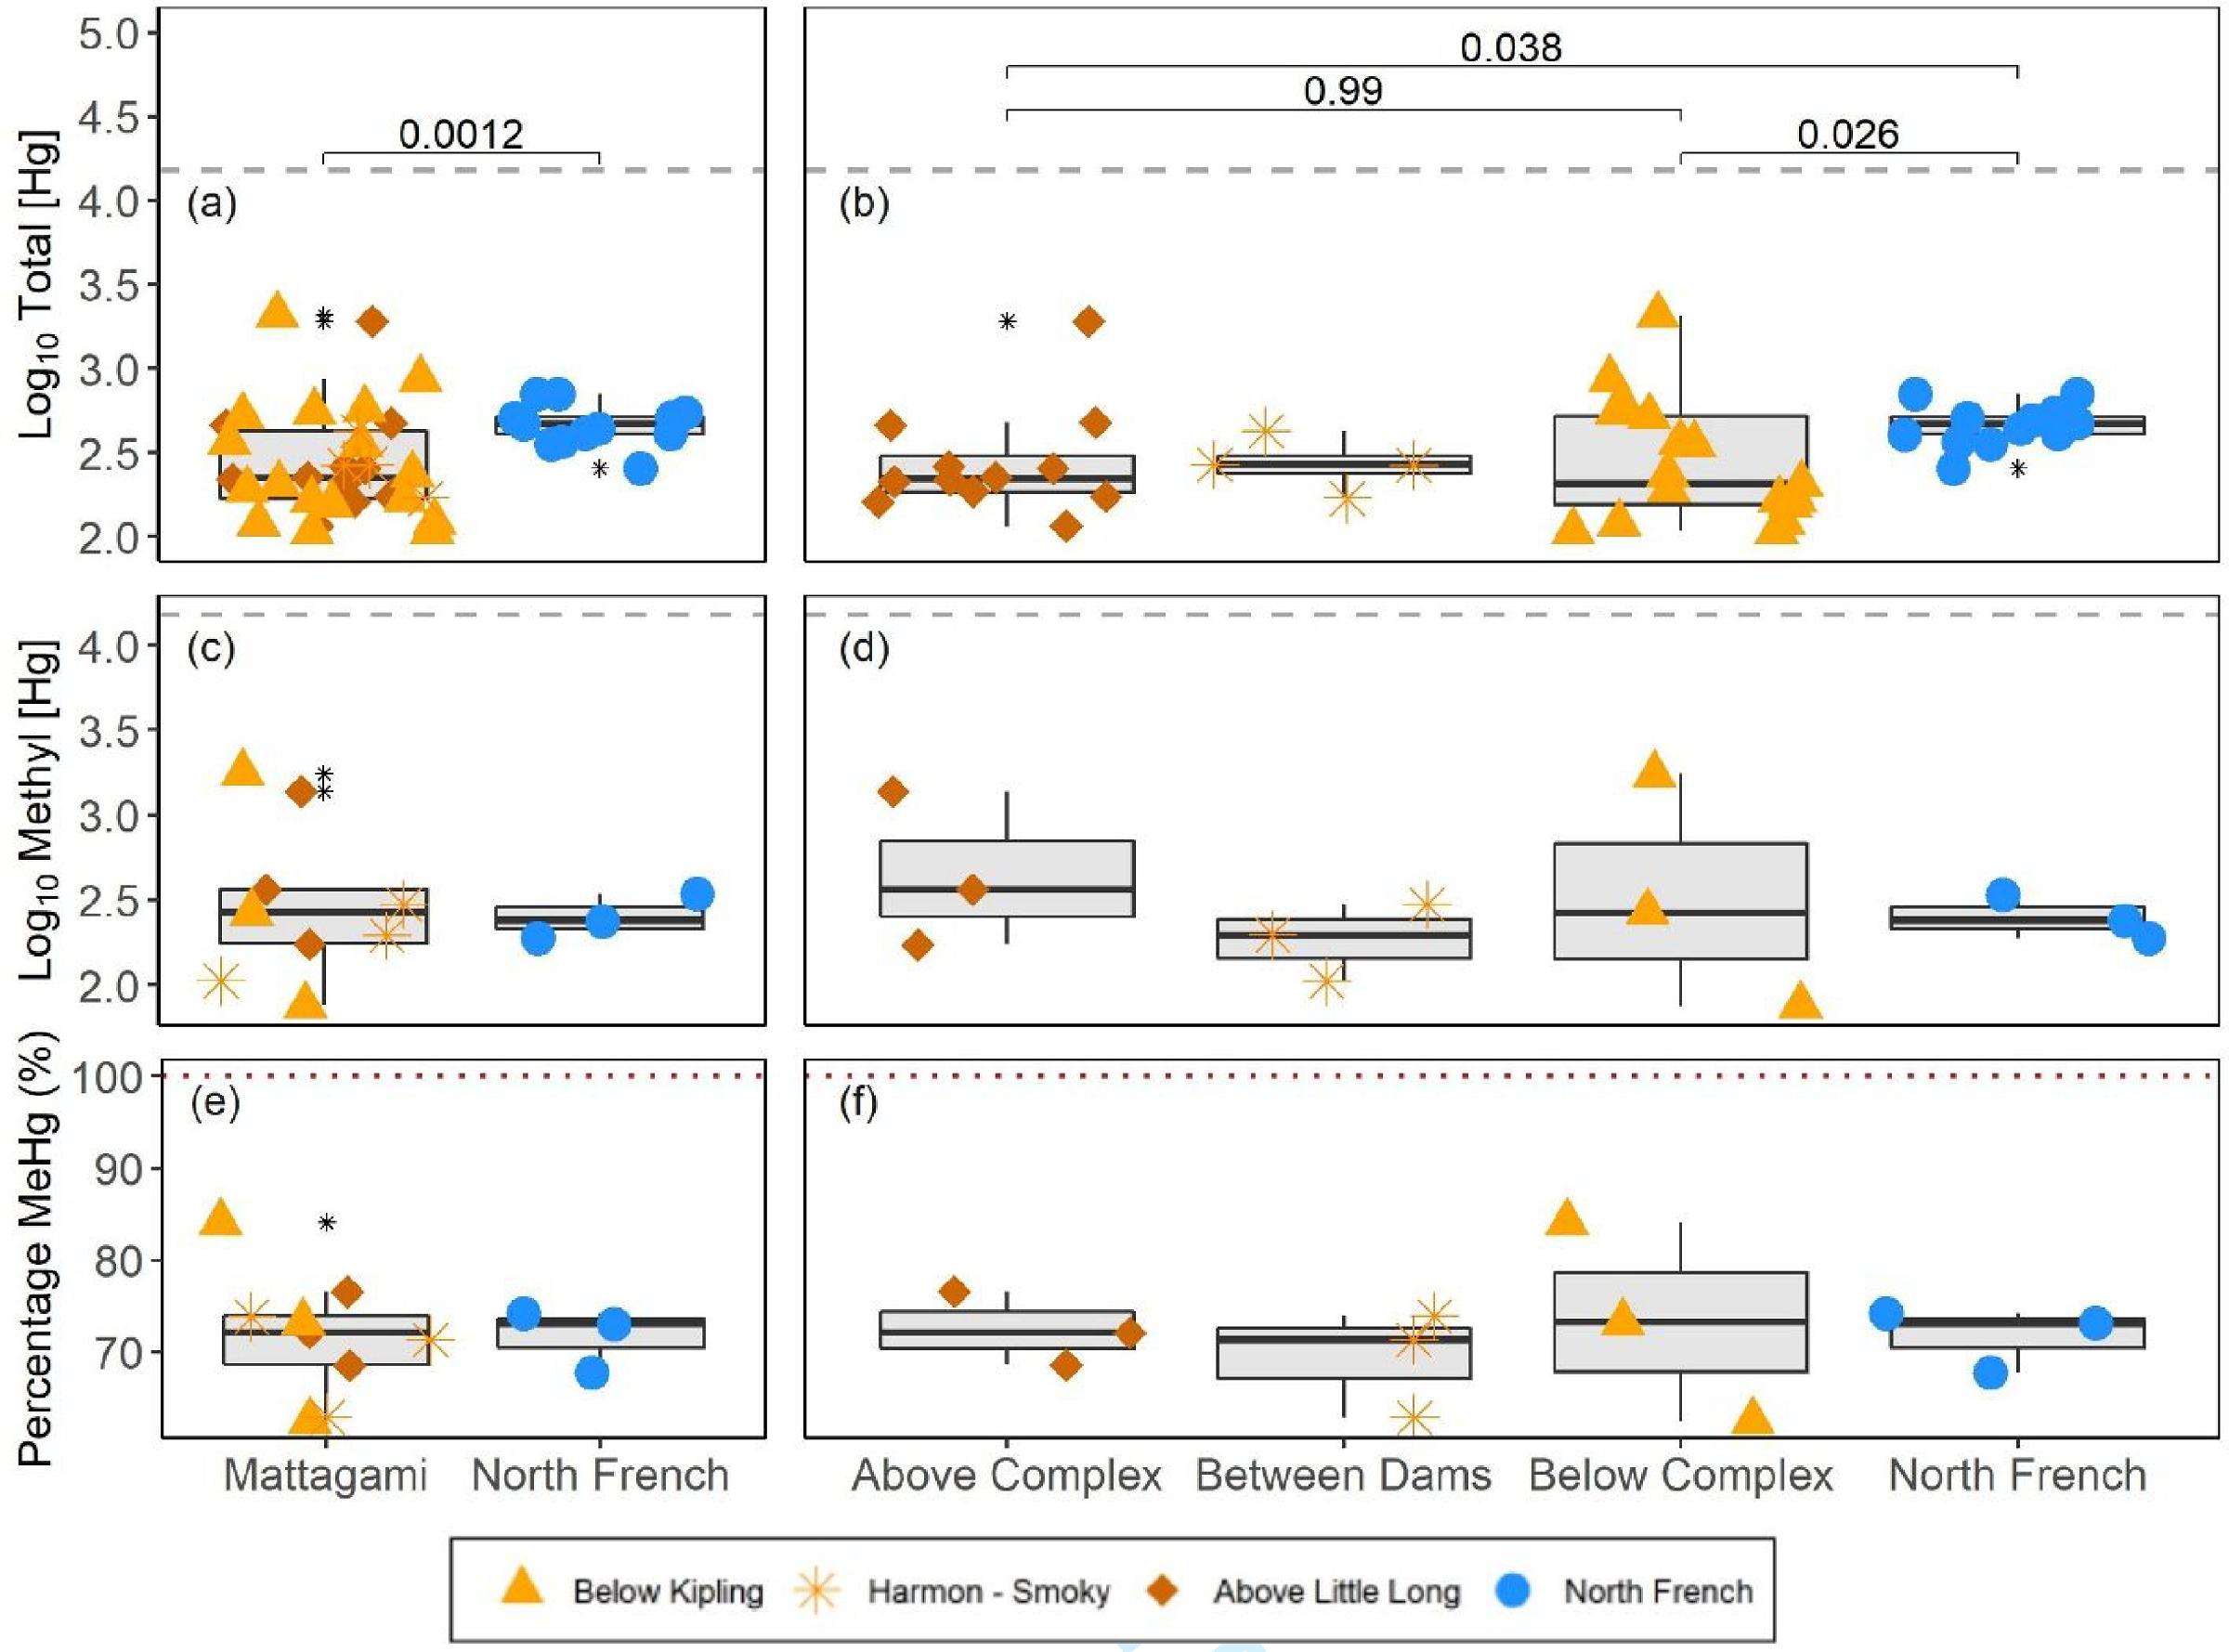
Blood [THg] levels differed in namew across the various sites sampled herein. Namew from the unimpacted North French River had significantly higher [THg] in their blood than Lower Mattagami River fish (
Fig. 2a;
p = 0.0012). When the specific dam sites were considered, North French namew had significantly higher [THg] compared to fish caught below and above the hydroelectric complex (
Fig. 2b;
p = 0.026 and 0.038, respectively). However, there was no significant difference between namew caught below and above the hydroelectric complex (
p = 0.99;
Fig. 2b). These comparisons were made with unadjusted [THg] that do not account for any differences in fish size among the sites compared; see Section 3.2 for more information.
Methyl [Hg] in namew blood ranged from 76 to 1749 ng/g dw, which represented 62.5%–84.1% of the [THg] measured across all fish sampled. The blood [MeHg] of 30–2500 ng/g measured in Atlantic sturgeon (
Mallory et al. 2018) was more comparable to our [MeHg] than our [THg] estimates, as discussed above. While not statistically compared due to low sample sizes, [MeHg] was more similar between sites than [THg] (
Fig. 2c). Interestingly, namew caught below the most downstream generating station (i.e., below Kipling Generating Station), had more variable [THg], [MeHg], and %MeHg than fish from the other sites (
Figs. 2c and
2d). Similarly, blood %MeHg was comparable across sites but was most variable in fish caught below the Kipling Generating Station (
Figs. 2e and
2f). It is possible that these fish include individuals from upstream, since namew have been documented moving through the spillways and traveling downstream (according to unpublished acoustic telemetry data from the Learning from Lake Sturgeon program), adding to the variability in fish at this site (O'Connor, Simard, unpublished). The %MeHg in fish blood is expected to be high, due to the efficient uptake of MeHg from intestinal tissue, relative to inorganic Hg (Hg(II);
Peng et al. 2016).
3.2. Relationships between mercury measures in blood and fish size
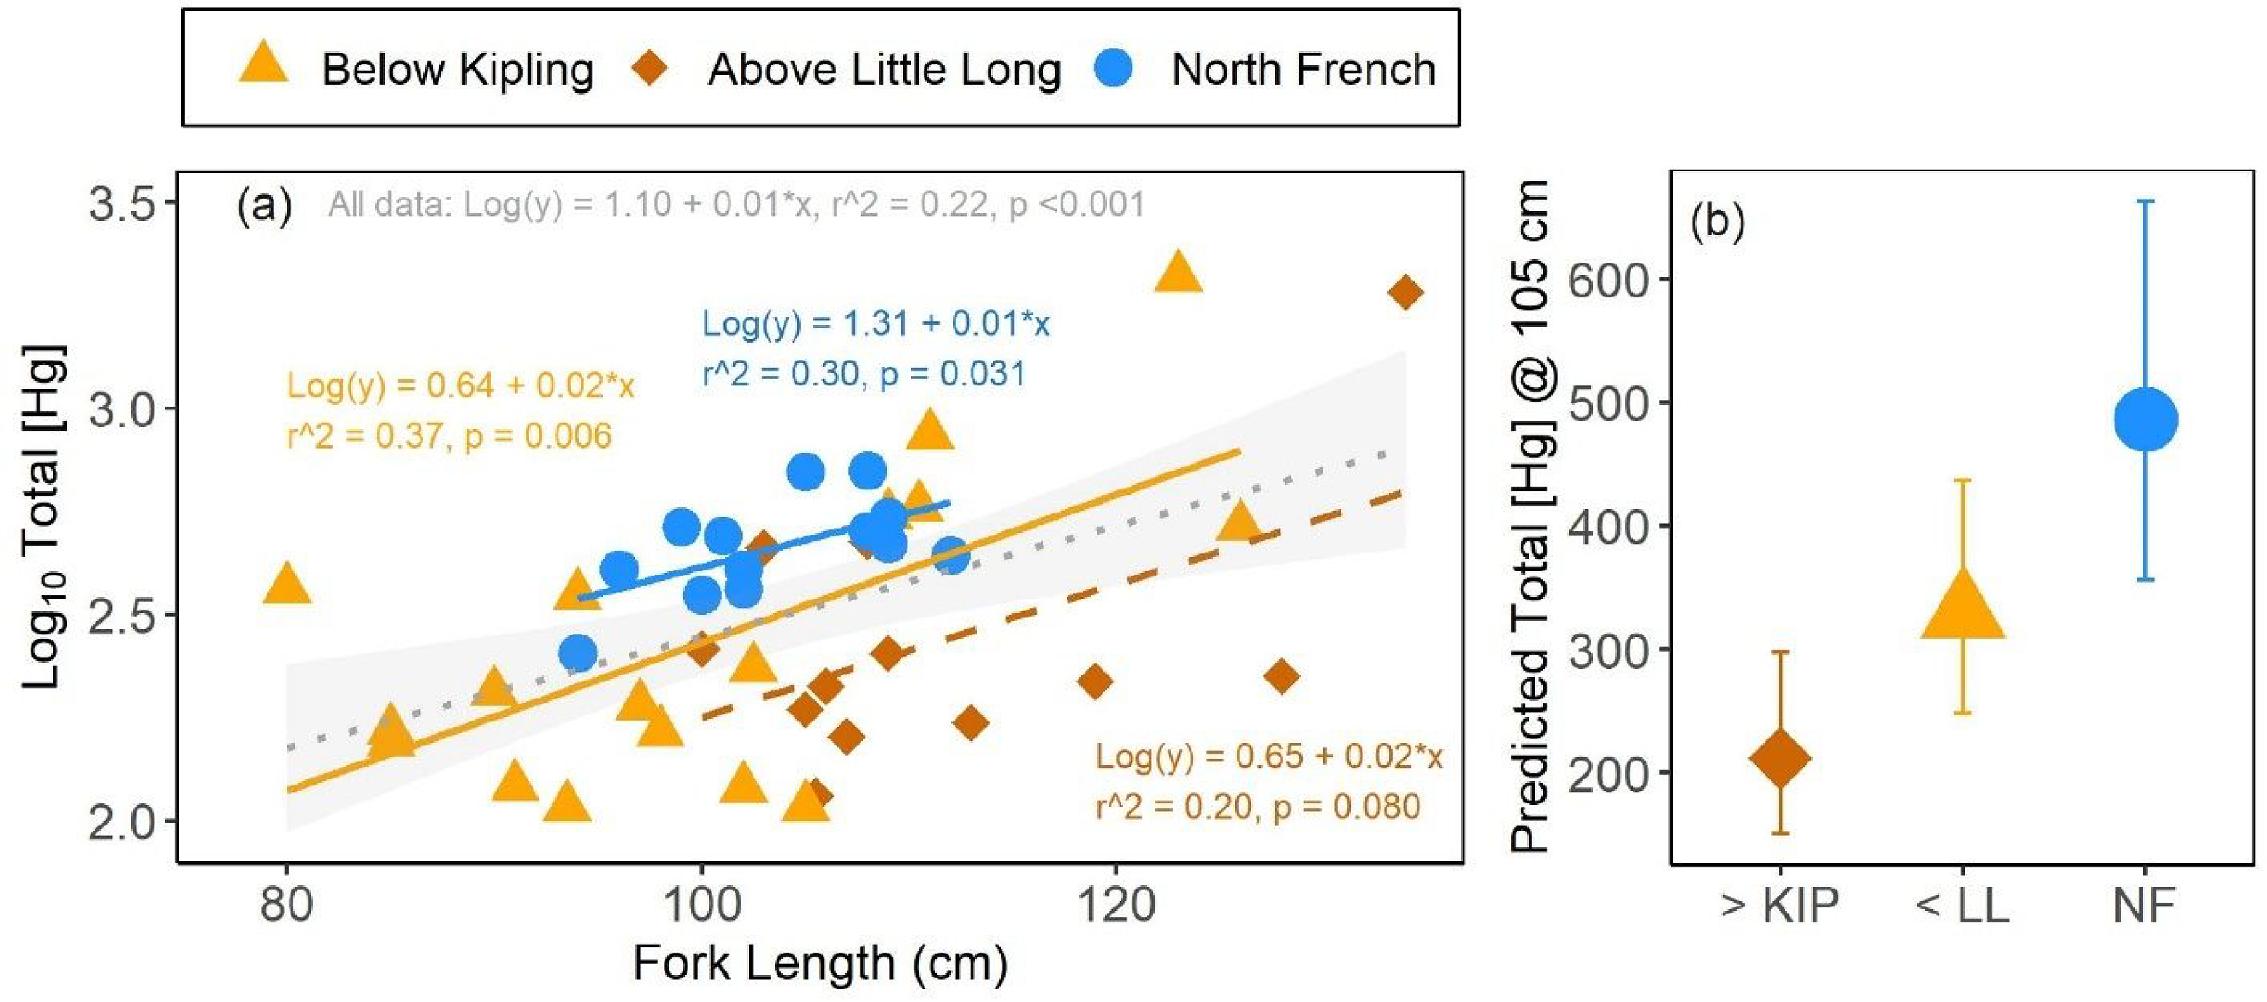
Overall, larger namew had higher [THg] in their blood. Fork length was a significant predictor of blood [THg] within two out of the three sites tested (
Fig. 3a). More specifically, namew from the North French River and from above the hydroelectric complex (i.e., Little Long Generating Station) had significantly higher [THg] as fish fork lengths increased. Fish from below this complex (i.e., below Kipling Generating Station) showed a similarly positive but insignificant blood [THg] versus fork length relationship (
Fig. 3a). The slopes of these relationships did not differ significantly among sites (ANCOVA interaction term
p = 0.927; Table SI-5) and, when combined, blood [THg] showed a significant and positive relationship with fork length across all sturgeon (
r2 = 0.22,
p < 0.001;
Fig. 3a). Blood %MeHg also showed a positive linear trend with fork length, but the relationship was statistically insignificant (
r2 = 0.15,
p = 0.121; Fig. SI-1b). It is possible that higher [Hg] in blood from larger sturgeon may reflect a shift in diet;
Jansen (2022) found that larger lake sturgeon ate larger prey with higher Hg burdens in Manitoba rivers (Canada). Additionally, [Hg] in fish blood has been shown to correlate with muscle and liver [Hg] (
Cizdziel et al. 2003), and thus reflect the overall body burden in a fish, which is known to increase with fish size. Interestingly,
Mallory et al. (2018) found that the relationship between blood [MeHg] and body size in Atlantic sturgeon was dependent on sex; only female Atlantic sturgeon showed a significant positive relationship. We did not determine sex for the namew sampled in the current study.
Namew sampled from the North French River spanned a smaller size range (94–112 cm fork length (FL)) than those sampled from the other sites (80–126 cm FL below Kipling Generating Station, 100–134 cm FL above Little Long Generating Station). When mean predicted values of blood [THg] at a shared fork length of 105 cm were compared among sites, the differences match those described in Section 3.1 using the raw data. More specifically, North French namew at 105 cm fork length had approximately 2.3 times higher [THg] in their blood, when compared to 105 cm fish from above the hydroelectric complex, which showed the lowest [THg] of the three sites compared (
Fig. 3b). Namew of similar size from below the hydroelectric complex had approximately 1.5 times higher [THg] when compared to namew upstream of this complex, and 1.5 times lower [THg] than North French fish.
Taken together, the results from Sections 3.1 and 3.2 show that namew blood Hg levels are highest in the unimpacted North French River, and not in fish caught above or below the hydroelectric complex on the Lower Mattagami River. Given that the initial construction of the generating stations happened 60–90 years ago, it is likely that any increase in Hg from the flooded landscape in the Lower Mattagami River has subsided, like other impacted fish across North America (
Willacker et al. 2016). It is noteworthy, however, that namew were sampled from upstream of the Little Long reservoir, not directly within the reservoir; namew residing within the reservoir itself may be exposed to higher [MeHg], particularly in the deeper anoxic sections (
St. Louis et al. 2004). It is possible that the North French system, which is a notably lower order stream when compared to the Lower Mattagami River, may have slower growing sturgeon, which could explain their higher Hg concentrations (
Sandheinrich and Drevnick 2016). The associated differences in river morphology, catchment characteristics, and limnology could impact Hg cycling and bioaccumulation potentials between these two systems (
Lehnherr 2014;
Lescord et al. 2019;
Emmerton et al. 2022).
3.3. Differences in food web structure and sturgeon trophic ecology between sites
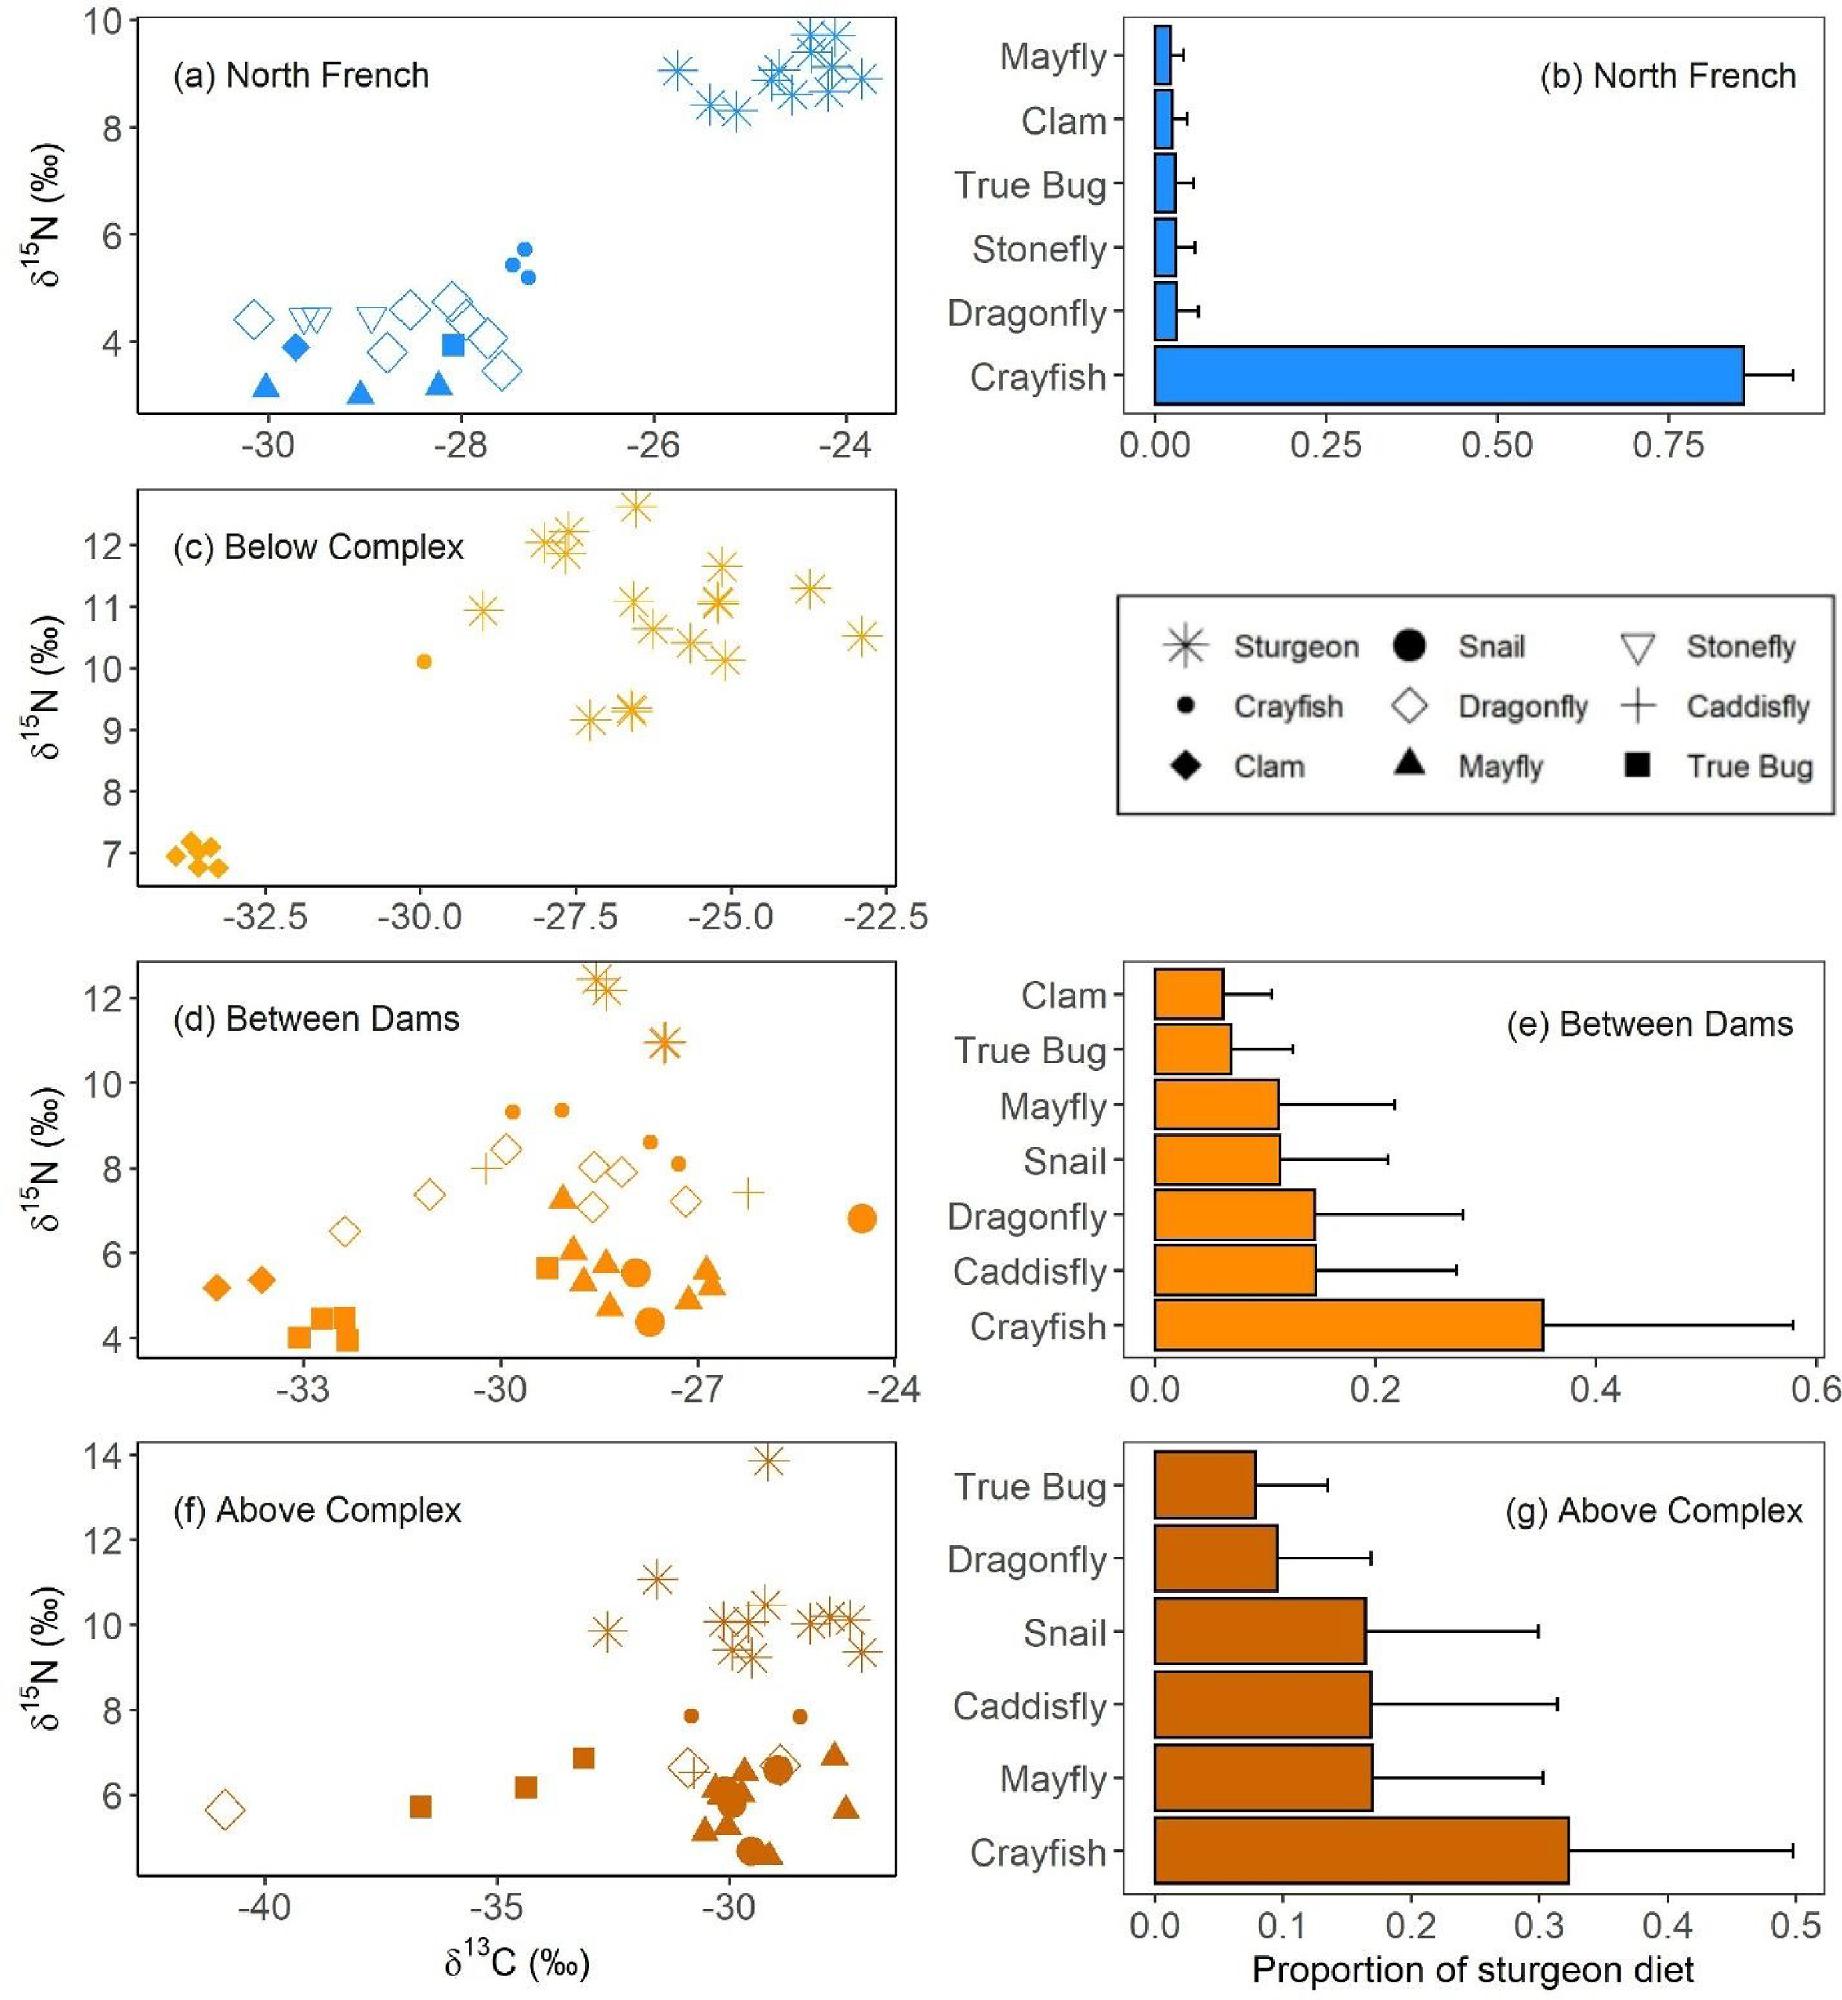
The food web structure assessed herein based on stable isotope ratios differed considerably among the study sites. In the North French River, namew’s food web position did not align with those of benthic invertebrates in the river. Specifically, δ
13C of namew was more depleted than that of the sampled invertebrates, suggesting that namew may be consuming an alternate prey source in the North French River (
Fig. 4a). As expected, the namew’s more positive δ
15N values suggest they are at a higher trophic elevation than the sampled invertebrates (
Fig. 4a). Crayfish were the closest invertebrate to namew, in terms of their isotope values (
Fig. 4a) and, as a result, they were determined to be the dominant prey item for this site (
Fig. 4b). It is notable that our invertebrates were caught on the lower North French River and it is possible that differences in water velocity and the associated gas change may alter biotic isotopic values, accounting for some of the differences between invertebrate and namew values (
Finlay et al. 1999).
Similarly, at the Kipling Generating Station, namew also had more negative δ
13C values and more positive δ
15N values, when compared to the clam isotope values (
Fig. 4c). However, very few benthic invertebrates were caught at this site, limiting further dietary modeling. The lower shoreline invertebrate catches at this site may be due to the highly variable flow regimes below Kipling Generating Station, which is the final generating station on the Mattagami River. Wide fluctuations in river water have been shown to extirpate invertebrates from littoral habitats (
Kennedy et al. 2016) and aligns with our findings. In both the food web models below Kipling Generating Station and the North French River, it is likely that we are missing important prey items that match the δ
13C values of namew therein, despite significant efforts made in sampling the base of the aquatic food webs thereof. Lake sturgeon are known to eat crayfish (
Braun et al. 2018), as our modeling suggests, but their diets can be diverse and include oligochaetes, amphipods, chironomids, and small fishes (
Jackson et al. 2002;
Guilbard et al. 2007;
Gosch et al. 2016), none of which we sampled. Fish eggs, another potential food item absent from our modeling, were estimated to account for 43% of lake sturgeon’s diet from the Rainy River (Ontario, Canada;
Smith et al. 2016). These gaps in dietary data may be contributing to the high proportions of crayfish in namew’s diets, shown in
Fig. 4b.
Conversely, in the sites within and above the hydroelectric complex, namew isotopic values were more aligned with those of the invertebrates sampled (
Figs. 4d and
4f). In both sites, namew δ
15N values were notably closer to those of invertebrates, when compared to the food web plots of the sites in the North French River and below Kipling Generating Station (
Figs. 4a and
4c). According to dietary modeling, crayfish were still the primary prey item for these namew though the contributions of other invertebrate groups (e.g., mayflies, caddisflies, dragonflies, and snails) were notably higher when compared to the North French dietary modeling (
Figs. 4b,
4e, and
4g). These invertebrate groups accumulate MeHg at different rates (
Malcata Martins et al. 2021;
Clarke et al. 2022); thus, such changes in dietary habits may impact Hg burdens in fish. Overall, these results show that namew above one or more generating stations had notably different diets, when compared to namew with unobstructed access to the lower Moose River.
Although lake sturgeon are primarily a freshwater fish, some lake sturgeon populations in large rivers with a marine confluence are known to be anadromous, semi-anadromous, or amphidromous (
Guilbard et al. 2007). Isotopic estimates from marine mussels (family
Mytilidae) are more enriched in
15N and
13C when compared to freshwater bivalves and other invertebrates (Fig. SI-2;
Dejong 2017). When these estimates are added into the dietary modeling exercises, marine mussels displace crayfish as the primary dietary item for namew in the North French River and below Kipling Generating Station (Fig. SI-3, a–d). In contrast, there is no significant change to the diet modeling for namew from between the generating stations or above the hydroelectric complex (Fig. SI-3, e–h). Thus, it is possible that marine prey are contributing to namew’s dietary isotope values, particularly for namew with unobstructed access to the marine environment (i.e., for namew in the North French River and namew captured below Kipling Generating Station). Past work on northern Ontario rivers has shown that anadromous fish, including cisco, reflect a marine baseline isotope value and should before accounted for in our inclusion of marine muscles herein (
DeJong 2017;
Lescord et al. 2022). However, lake sturgeon migration patterns are diverse, and some populations have been shown to be freshwater residents (
Kessel et al. 2018). Furthermore, the unpublished telemetry data and catch records to date from the Learning from Lake Sturgeon partnership program have not documented namew in the North French River migrating out into the Moose River, although movement from below Kipling generating station into the lower Moose River has been recorded (O'Connor, Simard, unpublished). The lower Moose River is also highly tidal and namew behavior may be influenced by salinity gradients, which have been shown to affect movement and diets of two sturgeon species in the St. Lawrence River Estuary (
Guilbard et al. 2007). Though it is noteworthy that BMIs caught at the mouth of the lower Moose River did not show heavier isotope values, suggesting their exposure to the marine tides may be minimal (Figs. SI-2 and SI-4a). Overall, a more extensive freshwater food web analysis is needed before we can conclude which dietary items are of greatest importance to these two groups of Moose River namew.
Namew downstream of and between the generating stations also appeared to have enriched δ
15N values in their fin clips, when compared to fish from other sites (Fig. SI-4). In fact, unadjusted δ
15N values in namew from the impacted Lower Mattagami River were 1.9 ‰ higher on average than those measured in namew from the intact North French River. The baseline organisms analyzed within the Mattagami River sites—including clams, crayfish, and dragonflies—also showed more positive δ15N values (Fig. SI-4), indicating a site-wide effect on isotope values. These differences could be due to varying nitrogen inputs and biogeochemical fractionation among the sites. However, δ15N values also tend to increase with fish size, like [Hg]. Thus, after baseline-adjustments using crayfish data, we estimated the δ
15N value of a 105 cm namew using an ANCOVA model; namew from the North French River had higher predicted δ
15N
adj values at 105 cm fork length (i.e., 3.56 ‰) than namew from either above (2.20 ‰) or below (1.00 ‰) the hydroelectric complex (see Tables SI-6 for full ANCOVA model and SI-5 for the predictions). These higher δ
15N
adj values may be related to the differences in food web structure discussed in Section 3.3 above. For example, a diet including small fishes or fish eggs could explain these namew’s elevated trophic levels, implied by the higher δ
15N
adj values observed. It is noteworthy that δ15N values can change along freshwater continuums, due to influences of various abiotic processes on fractionation rates (
Zhang et al. 2022). However, the baseline-correction of namew isotope values should account for such differences between sites. It is possible our baseline organisms, which were caught nearer to the confluence of the North French and Moose rivers during the late summer, may not reflect the springtime baseline conditions further upstream in the North French River, where all the namew were caught. Nevertheless, these results suggest that the higher blood [THg] in North French namew may be partly due to differences in their diets, leading to higher trophic elevations.
3.4. Predictors of [THg] in sturgeon blood
When multiple potential explanatory variables were considered together, trophic position was found to be the strongest and most consistent predictor of blood [THg] in sturgeon from all sites studied herein. The top four predictive models all included δ
15N
adj (
Table 1). The highest ranked model, which included δ
15N
adj and fork length was notably stronger (
r2 = 0.41 and AIC weight = 0.45) than the next three models (
r2 = 0.36–0.38, AIC weight = 0.13–0.27;
Table 1). Furthermore, the second strongest model included only δ
15N
adj. Fish weight and δ
13C
adj had smaller coefficients in the two top models in which they were included, and these parameters were not statistically significant predictors of blood [THg] within those models (
Table 1). Nine other models were also considered in this modeling exercise, but all had weak explanatory power (
r2 < 0.01–0.14, AIC weight < 0.01; Table SI-10).
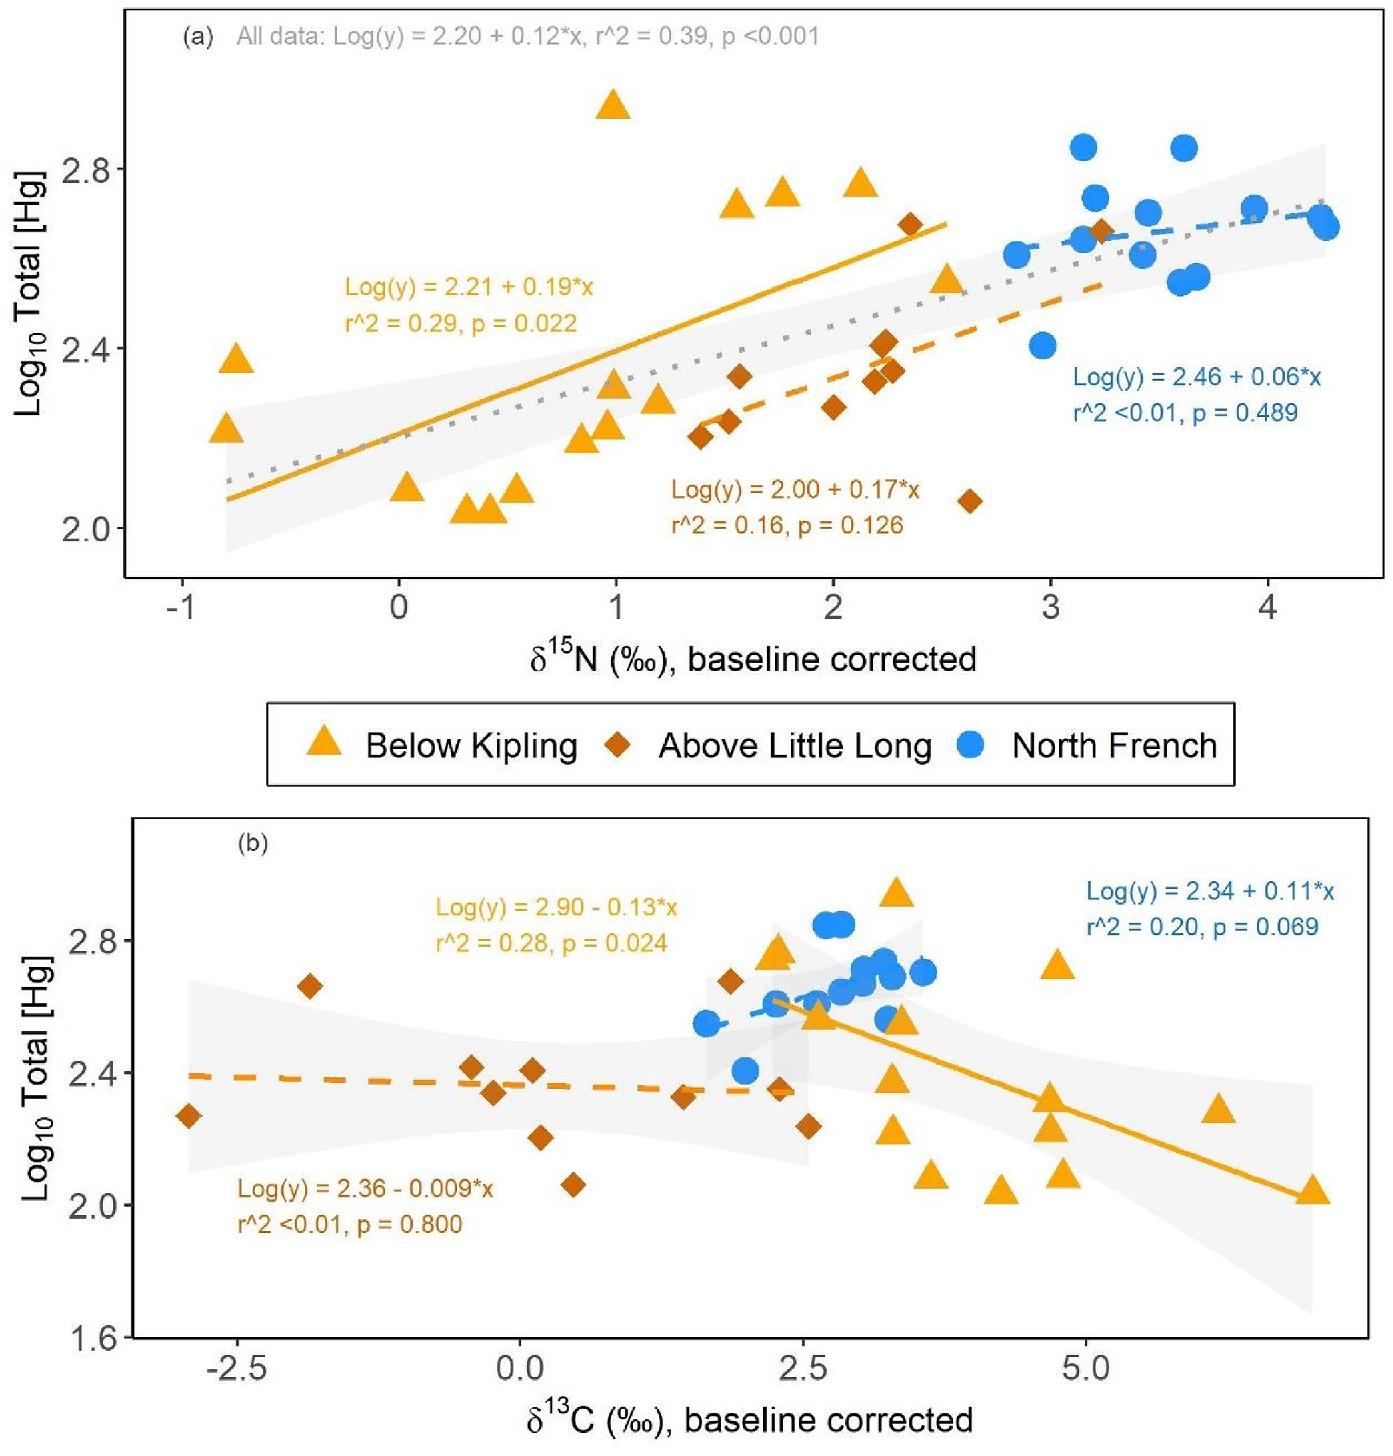
Namew blood [THg] increased with δ
15N
adj in all three study sites tested (
Fig. 5a). However, this relationship was only statistically significant within the downstream impacted site, below Kipling Generating Station (
r2 = 0.29,
p = 0.022;
Fig. 5a). Relationships between [THg] and δ
15N
adj in the namew in the North French River and above the Little Long reservoir were positive, but weak (
r2 < 0.01 and 0.16, respectively) and insignificant (
p = 0.486 and 0.126, respectively;
Fig. 5a). As with fork length relationships, the slopes of the THg-to-δ
15N
adj relationships did not differ among sites (interaction term
p = 0.693, see Table SI-8 for full ANCOVA modeling results). Once combined, δ
15N
adj had a strong and positive effect on blood [THg] across all namew sampled (
r2 = 0.39,
p < 0.001;
Fig. 5a). Conversely, blood [THg] did not vary significantly with δ
13C
adj in namew sampled from sites in the North French River or above the Little Long Generating Station (
Fig. 5b). Conversely, [THg] had a negative relationship with δ
13C
adj at the site below Kipling Generating Station (
Fig. 5b), suggesting that differences in namew diet impacted their Hg exposure. Again, the namew caught below Kipling Generating Station may represent individuals from above the generating station(s), which went through the spillways, and may add variability to the site data. Unlike the δ
15N model, the within-site slopes between length and δ
13C
adj were significantly different (interaction term
p = 0.033; see Table SI-9 for full ANCOVA modeling results); thus, no model was assessed for pooled data.
We recognize that using crayfish as a baseline organism to adjust isotope values is not conventional. Typically, a primary consumer would be used, such as a clam, rather than an omnivorous decapod. However, crayfish represented the most complete invertebrate caught among all the sites compared and allowed for the comparisons of three sites. Calms, on the other hand, were only caught at two of our study sites and their use as a baseline would have limited our modeling. Nevertheless, for comparisons sake, we also ran the ANCOVA modeling using clams as our baseline adjustment for namew isotope values; no clams were found above the Little Long dam, so this important site was removed from these comparison models. These models show that, across the North French and Kipling sites, the relationships between log [THg] in namew blood and adjusted isotope values using clam data (i.e., Fig. SI-5, Tables SI-12 and SI-13) strongly agree with results using crayfish to baseline adjust (
Fig. 5). Site was not long a significant variable in these models, likely due to the exclusion of the Little Long data (Tables SI-12 and SI-13). The only other notable difference was an insignificant interaction terms in the δ
13C
adj model, allowing for an overall negative trend between δ
13C
adj and log [THg] to be determined. Overall, the similarity in these results suggest that crayfish are an acceptable baseline when their isotopic values show food web alignment, as in our study herein.
Taken together, our results suggest that unexplained differences in trophic ecology may be a key driver of higher blood [THg] in namew from the North French River. It is possible that baseline [Hg] is also different among these sites. On a Quebec river, flooding and alterations to basal carbon and Hg cycling promoted MeHg uptake into the base of the food web, temporarily increasing fish Hg burdens within a run-of-river hydroelectric complex (
Ponton et al. 2021). Future studies should consider more extensive food web modeling, including baseline modeling and assessing trophic magnification slopes (
Lavoie et al. 2019).
