The long-term effects of water resource development on blood mercury levels and the trophic ecology of Namew (lake sturgeon, Acipenser fulvescens)
Abstract
Water resource development can alter the movement and ecology of sturgeons. We studied total (THg) and methylmercury concentrations in whole blood sampled non-lethally from namew (Moose Cree L-dialect, lake sturgeon, Acipenser fulvescens), an endangered and culturally important subsistence fish. Namew were sampled from two tributaries within the Moose Cree Homeland: the Lower Mattagami River (an impacted system with four hydroelectric generating stations) and the North French River (a reference system that is free-flowing system with no development). Results indicated namew from the North French River had higher blood [THg] than those from the Mattagami River. Further modeling showed that trophic position was the primary driver of these differences, with North French namew having the highest nitrogen isotope ratios. Based on further isotope modeling, crayfish were major components of namew diet at all sites, while other prey items differed between sites. Specifically, namew with unobstructed access to the lower watershed had notably more enriched isotope values when compared to the freshwater benthic macroinvertebrates sampled, implying that other prey not captured herein may contribute to their diets and [THg]. Overall, we found differences in namew’s trophic ecology but no elevation in blood mercury levels at a site impacted by hydroelectric operations 60+ years post-impoundment.
1. Introduction
Since the early 1900s, the Moose Cree First Nation (MCFN) Homeland, in what is now known as northeastern Ontario (Canada), has been heavily developed for hydropower. The Moose Cree community has ongoing concerns about the impacts, including on namew (na-may-o, lake sturgeon, Acipenser fulvescens). Lake sturgeon is a long-lived and slow-growing freshwater fish species that is threatened across most of its natural range (Threader and Broussaeu 1986). Internationally, lake sturgeon have recently been classified as an endangered species, with an estimated total of 140 000 individuals remaining (Haxton and Bruch 2022). They are also a culturally important fish for many Indigenous Peoples, including MCFN. Ongoing threats to lake sturgeon populations include habitat fragmentation or degradation, pollution, and overharvesting, though many knowledge gaps remain (Pollock et al. 2015). Of these threats, water resource management has been implicated as a key factor related to many sturgeon population declines, largely due to impacts on movement and reproduction (Cooke et al. 2020), including for lake sturgeon (Haxton and Findlay 2008).
Another stressor that may affect sturgeon’s conservation and use as a subsistence fish is mercury (Hg), a priority concern among MCFN citizens. Hg is a harmful contaminant known to bioaccumulate in aquatic environments and fish. More specifically, the organic Hg form, methylmercury (MeHg), is highly bioaccumulative, increasing in concentration with fish size and age (Johnston et al. 2022). Because sturgeon can live up to 100 years or more and can reach a considerable size, they have the potential to bioaccumulate high concentrations of Hg (Billard and Lecointre 2001; Haxton and Bruch 2022). In addition, MeHg biomagnifies through aquatic food webs, reaching highest concentrations in predatory fishes (Lavoie et al. 2013); while sturgeon tend to feed at lower trophic levels, primarily on invertebrates, their diets can vary broadly and may include small fish and fish eggs (Braaten et al. 2007; Smith et al. 2016; Jansen 2022). Lake sturgeon, in particular, have been noted as dietary generalists, more so than other sturgeon species (Guilbard et al. 2007), which may influence their MeHg bioaccumulation potential.
Hydroelectric developments have the potential to alter Hg bioaccumulation and biomagnification dynamics in fish. More specifically, the initial creation of a reservoir floods the surrounding landscape and releases terrestrial Hg into the water. Under the right biogeochemical conditions, this Hg can be methylated and accumulated into the aquatic food web (Paterson et al. 1998; St. Louis et al. 2004; Bodaly et al. 2007). Worldwide, research has shown sharp increases in fish Hg concentrations in hydroelectric reservoirs, for approximately 5–10 years post-impoundment (Johnston et al. 1991; Willacker et al. 2016; Cebalho et al. 2017). These Hg levels typically decline over the next 20–40 years, eventually returning to baseline levels that are comparable to unaffected waterbodies nearby, though there is notable variation in these trends (St. Louis et al. 2004; Hall et al. 2009; Willacker et al. 2016; Bilodeau et al. 2017; Ni et al. 2022). Furthermore, hydroelectric development can also alter the structure of aquatic food webs, largely due to flow regime changes (Kennedy et al. 2016; Robson et al. 2017; Mor et al. 2018). Because diet is the primary source of Hg for most fishes (Hall et al. 1997), changes to food web structure due to hydroelectric operations have been shown to alter Hg biomagnification therein (Walters et al. 2020; Ponton et al. 2021).Overall, more work is needed to understand how such changes to food webs can alter Hg bioaccumulation patterns in fish, particularly generalist benthivores like lake sturgeon.
Given the importance of lake sturgeon to Indigenous Peoples, and their status as an internationally endangered species (Haxton and Bruch 2022), more information is needed on the long-term effects of hydroelectric development on their movement, ecology, and health. Using non-lethal sampling techniques, we studied the Hg levels and trophic ecology of lake sturgeon, known as namew in Moose Cree L-dialect and referred to as such in this paper. We sampled namew from impacted and reference sites in the Moose River system in the Moose Cree Homeland. We measured Hg concentrations ([Hg]) in namew blood, which reflect a fish’s recent Hg exposure from food (Leaner and Mason 2004) or water (Barbosa et al. 2022). Using these data, we examined the long-term impacts of one hydroelectric complex on the lower Mattagami River. We specifically addressed three questions: (1) Do we see differences in blood Hg concentrations in namew sampled from sites impacted by hydroelectric development when compared to a reference area? (2) Do we see differences in aquatic food web structure and namew diet between impacted and reference sites? (3) Based on correlative analyses, what are the primary drivers of Hg uptake in namew within this part of the Moose Cree Homeland?
2. Methods
2.1. Project information
This study was conducted on the Homeland of the MCFN and is part of an ongoing collaboration between MCFN and Wildlife Conservation Society Canada (WCSC), with other government and academic partners (see https://learningfromlakesturgeon.ca/ for more information). The data generated and used for this project are co-owned by both MCFN and WCSC. MCFN is actively engaged in activities to reclaim their role as stewards of the lands and waters of the Moose Cree Homeland. Collecting scientific data through these and similar studies provides information for Moose Cree stewardship, monitoring, and decision-making. As caretakers and as part of rebuilding relationships with the land, the Moose Cree People are moving forward through collaborations of a shared understanding of environmental impacts and development of land protection plans. The health of the land (including namew) is a reflection of the health of Indigenous People; this is a connection that needs to be included in the understanding of the sturgeon and river health.
This scientific study was co-created between MCFN and civil society, academic, and government scientists, with both Ililiwak (Moose Cree) and settler co-authors. However, the information and views presented herein represent only the individual author’s interpretations. This paper should not be cited as an official MCFN position, nor should it be used in any way as a representation of the Ililiwak Indigenous Knowledge System.
2.2. Study location
The Moose River is a large freshwater river system in northern Ontario, Canada, that drains northward into James Bay (Fig. 1). The mainstem Moose River is wide, with 1–2 km in wetted width on its lower reaches and a mean annual discharge rate of approximately 1370 cubic meters per second. Its drainage area spans approximately 108 500 km2. The system crosses two ecozones—beginning in the boreal shield and transitioning into the Hudson plains—which differ in their elevation, geology, vegetation, and limnology (Patterson et al. 2020). The transition between these two zones is marked by a sharp drop in elevation; as a result, the watershed supports several hydroelectric generating stations.
Fig. 1.
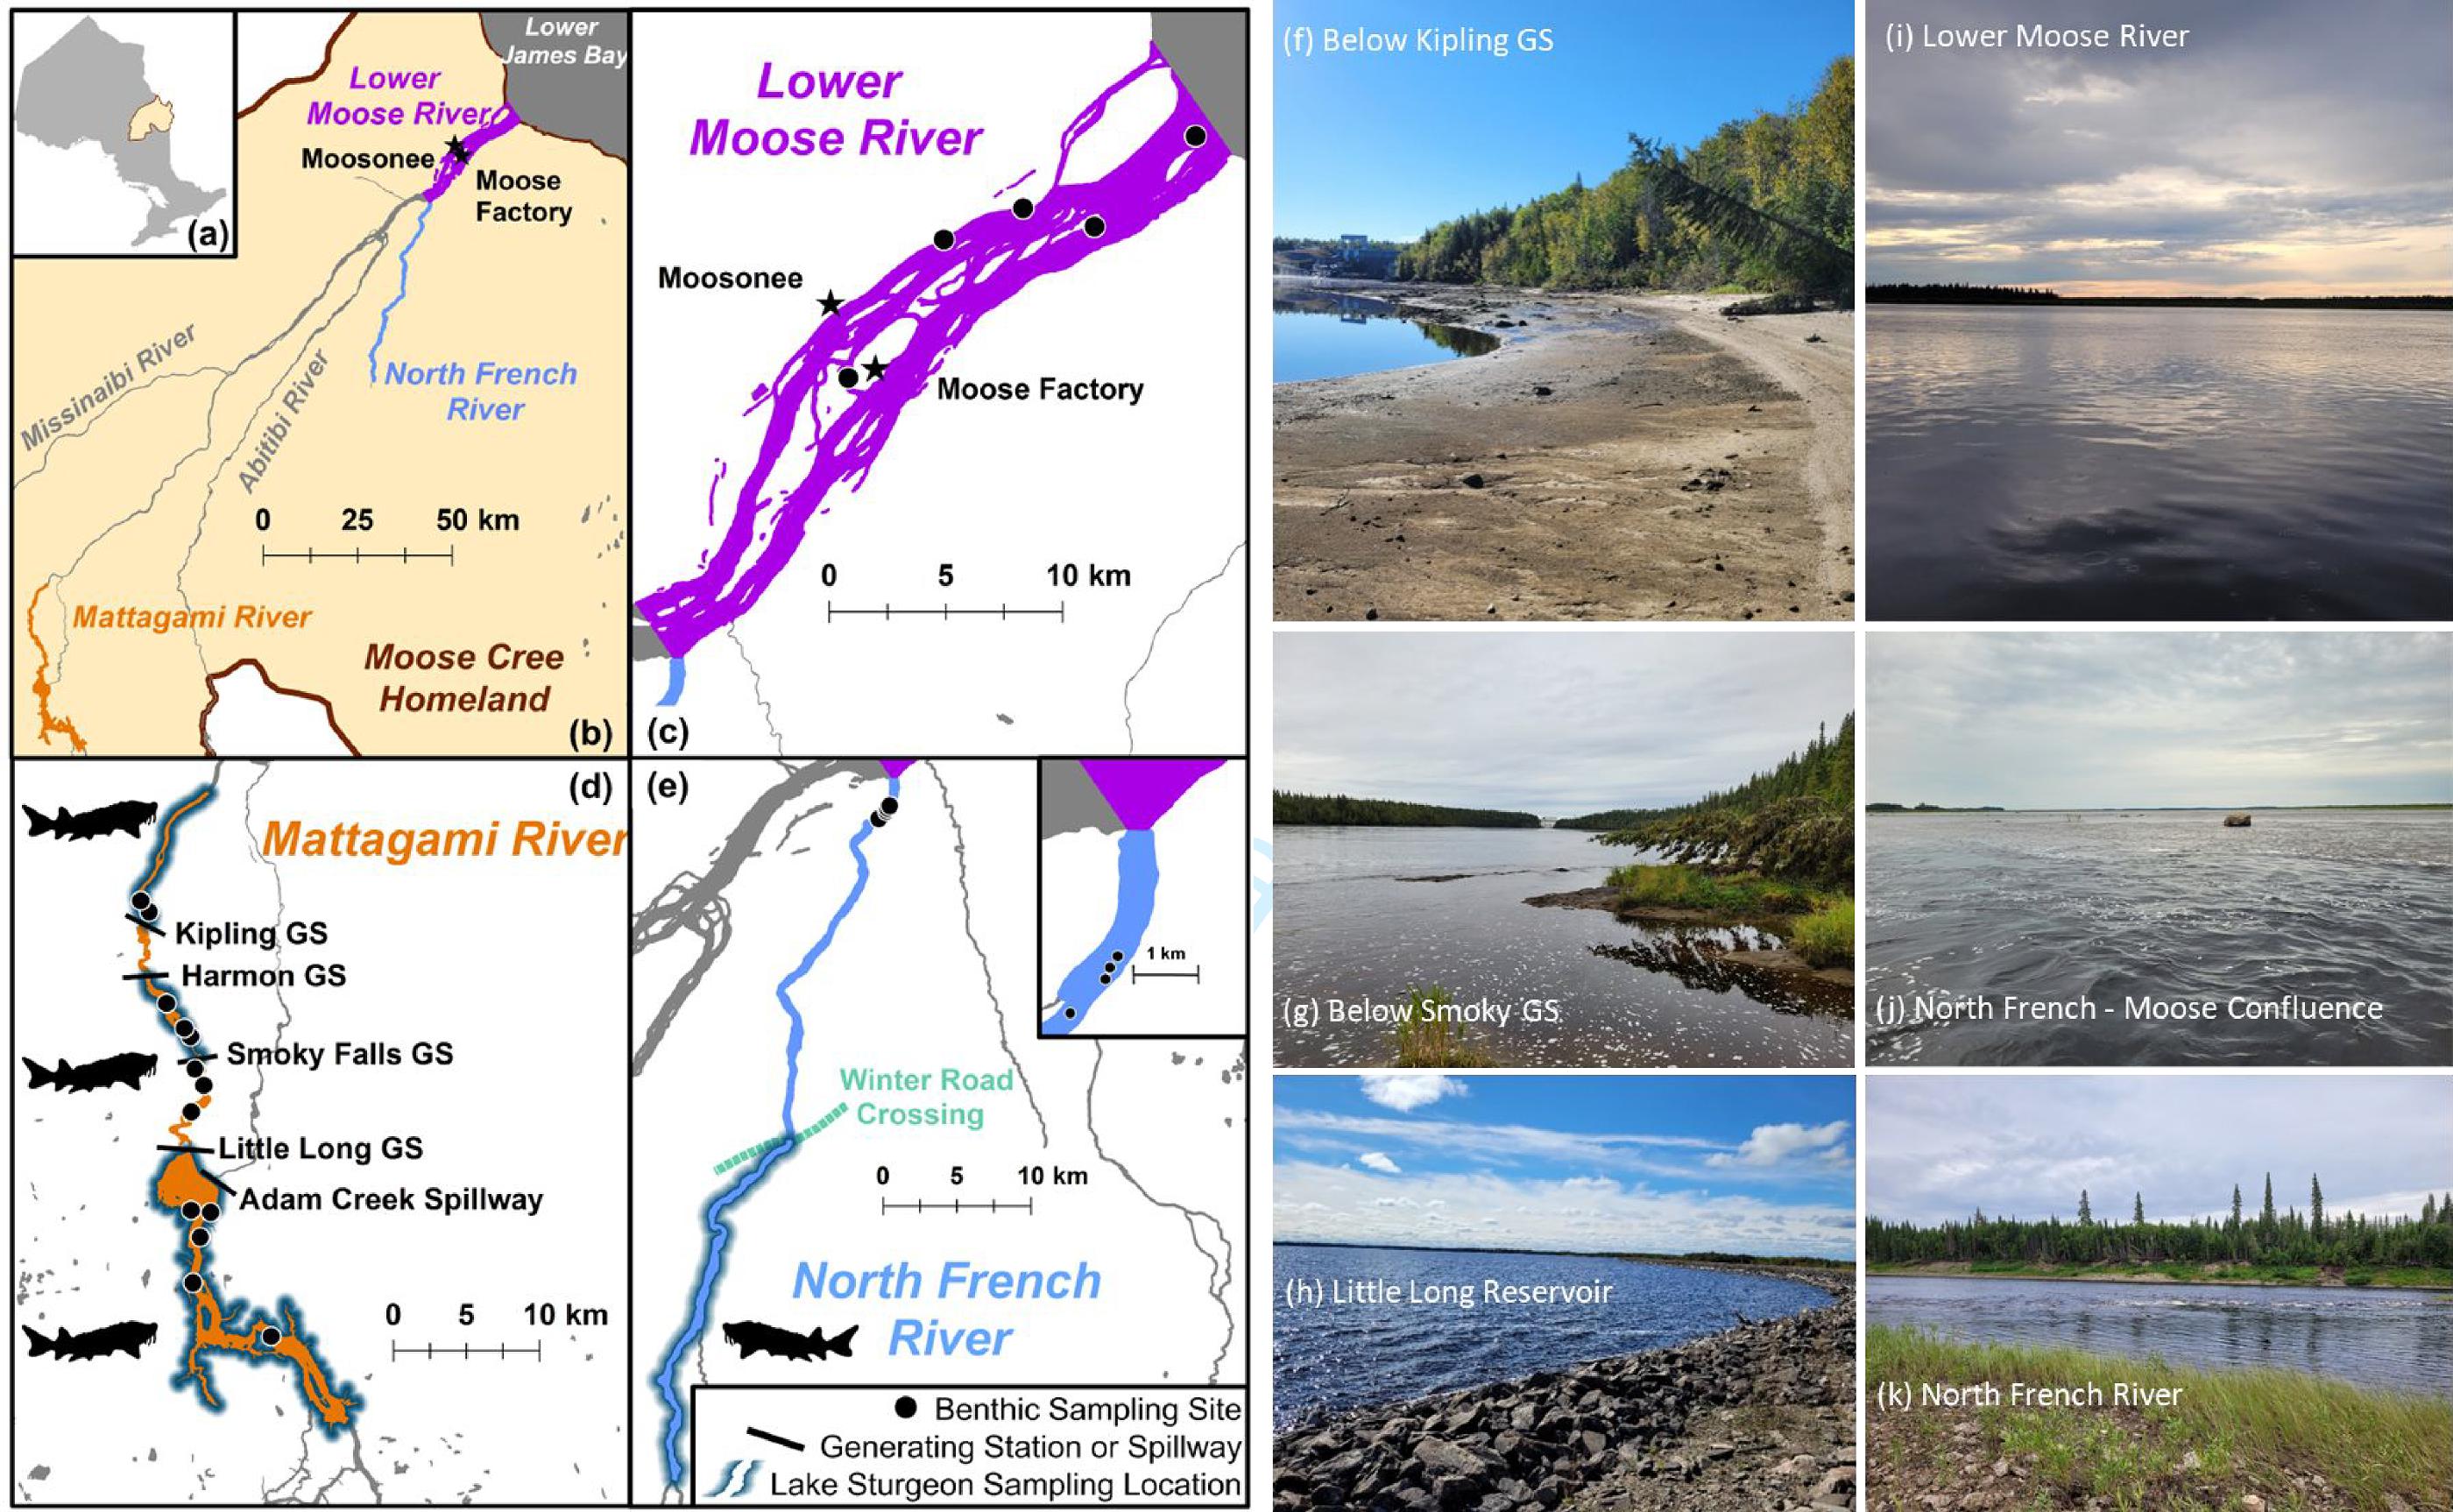
Our study focused on the lower reaches of two Moose River tributaries: the Lower Mattagami River and the North French River. These systems enter the Moose River approximately 100 and 40 km upstream of the James Bay coast, respectively (Fig. 1). The Mattagami River has several anthropogenic impacts worth noting, including effluents from pulp and paper mills, large-scale forest harvesting, urbanization, and mining activities in the upper reaches (McMahon et al. 2020), as well as water resource development. Our specific study site on the Lower Mattagami River included the Lower Mattagami Hydroelectric Complex, comprised of four hydroelectric generating stations, the first of which was constructed between 1927 and 1931 at a natural waterfall known as Smoky Falls (OPG 2023). The other three stations were constructed between 1963 and 1966, both downstream and upstream of what became the Smoky Falls Generating Station (OPG 2023). The construction of the upstream hydroelectric facility, the Little Long Generating Station (LL), created the Little Long Reservoir approximately 60 years before this study (approximately 30.7 km2 with a max depth of 25 m). Conversely, the North French River is undeveloped and has minimal anthropogenic disturbances. The Wetum ice road crosses the North French River, approximately 50 km downstream of a natural waterfall (Fig. 1); both of these features may be barriers to namew movement within the system, especially when flows are seasonally low or ice cover is thick.
2.3. Field sampling
All animal handling procedures were approved by the MCFN Elders Advisory Group and Ontario Tech Animal Care Committee #16780, and collected under OMNRF permit #1100693. MCFN Knowledge Holders and scientists worked together for all field data collection. A total of 45 namew were captured from the North French and Lower Mattagami rivers in May–June 2022 using monofilament gill nets (180–230 mm stretched mesh). Nets were set overnight and checked at least every 12 h. Individual namew were transported in tubs of water to a nearby shoreline where they were weighed using a sling and measured for fork length using a bump board. Approximately 1–2 mL of blood was then sampled from the caudal vasculature using a 1.5′′ 21 G needle and a 6 mL Trace Metal grade BD Vacutainer™ with 10.8 mg K2EDTA preservative. Vacutainers were inverted 3× and blood was transferred to 2 mL cryovials. Ultra-clean handling methods were used when collecting blood Hg samples (i.e., double bagging all supplies and using “Clean Hands, Dirty Hands” protocols; Kirk and St. Louis 2009). Anal fin clips (∼1 cm2) were also collected from the anal fins of each fish before releasing namew back into the river. Additionally, on the North French River, whole blood and anal fin clips were collected from three namew harvested by MCFN members. All blood and fin clip samples were stored on ice in a Yeti® Tundra 65 for no longer than 4 days before being frozen at –20 °C.
Benthic macroinvertebrates (BMIs) were also collected from the North French and lower Moose rivers in August 2022, and from the Lower Mattagami River in September 2022 (Tables SI-2, SI-3, and SI-4). In total, 22 sites were sampled for BMIs (Fig. 1). In general, samples were pooled across sites that were within a study region (i.e., (1) the North French River, Table SI-2, (2) the lower Moose River, Table SI-3, (3) above, (4) within, and (5) below the Lower Mattagami hydroelectric complex, Table SI-4). At each sampling location, a variety of collection methods were used, including kick-and-sweeping, rock flipping, and general shoreline scouting for larger BMIs and bivalves. The exception to this was near Moose Factory, which only included one site, where freshwater clams were collected based on MCFN members’ suggestions.
BMIs were sorted by order in the field and included Ephemeroptera (mayflies), Plecoptera (stoneflies), Trichoptera (caddisflies), Hemiptera (true bugs, such as water boatmen), Odonata (dragonflies), as well as freshwater crayfish, snails, and clams. In the lab, large clams (shell length = 32–68 mm, family Unionidae) were identified as either Lampsilis siliquoidea or Elliptio complanata, but small fingernail clams (shell length < 10 mm, family Sphaeriidae) were not keyed further. Fingernail clams were only caught between the generating stations on the Lower Mattagami River, and no large clams were caught above the Kipling Generating Station (Fig. 1). Dragonflies were further sorted into families, including Aeshnidae, Cordulegastridae, Gomphidae, and Macromiidae. Likewise, mayflies were sorted into the families Ephemeridae and Heptageniidae. Stoneflies were mostly caught on the North French River and were all classified as family Perlidae; only one individual from family Pteronarcyidae was caught at the mouth of the Moose River. True bugs were classified and sorted as either Corixidae, Notonectidae, or Belostomatidae, with the latter caught on the shorelines of the lower Moose River only. Caddisfly larvae were only caught infrequently (though a notable number of empty casings were found during kick-and-sweeps) and were not classified or sorted beyond their order. Likewise, snails were not identified or sorted further but all were small, with shells <13 mm in length. Crayfish (carapace lengths = 20–47 mm) were also not classified beyond superorder (Pleocyemata), though blue-tinted chelipeds were commonly noted during sorting, suggesting they may have been Faxonius virilis.
2.4. Sample handling and lab analysis
All samples were shipped to the Vale Living with Lakes Centre (Laurentian University, Sudbury, Ontario) on dry ice approximately 2–4 weeks after each collection event. BMIs were further sorted to family or species, where noted above. The tissues used for stable isotope analysis varied among invertebrate taxa. Tail muscle was dissected from all crayfish, foot muscle was removed from large unionid clams, whole viscera were taken from fingernail clams and snails, and whole bodies were used for all other taxa. Samples from large crayfish, clams, true bugs (Belostomatidae), and all dragonflies were from individuals, whereas mayflies, caddisflies, true bugs (Notonectidae), small crayfish, and stoneflies were pooled into samples of 2–10 individuals within a sampling region (except two stoneflies from the lower Moose River, which were analyzed as individuals). Fingernail clams, snails, true bugs (Corixidae), and small mayflies had up to 20 individuals pooled in each sample, to ensure adequate biomass for subsequent analysis. A total of 101 BMI samples were amalgamated across all classification groups and sampling regions. All samples of blood, sturgeon fin clips, and invertebrate tissues were dried using a Labconco™ FreeZone freeze-drier for 7 days.
All 101 BMI samples and 47 fin clips were analyzed for stable carbon and nitrogen isotopic ratios (δ13C and δ15N, respectively) at the Stable Isotopes in Nature Laboratory at the University of New Brunswick (Fredericton, NB) using continuous flow isotope ratio mass spectrometry and following methods outlined in Jardine et al. (2003). Fin clips were cut and inserted directly into the instrument, while invertebrates were homogenized with a mortar and pestle prior to analysis and weighed into tin capsules. In each sample, the ratio of heavy (i.e., 13C and 15N) to light (i.e., 12C and 14N) isotopes were analyzed and compared to an international standard to generate a delta value for each element. Considered together, δ13C and δ15N provide inferences on food web structure. More specifically, δ15N was used to assess the trophic level of an organism, while δ13C was used to assess the primary production sources supporting an organism. The relative percent difference between duplicate samples was 0.8 ± 1.6% for δ13C and 0.6 ± 5.4% for δ15N (n = 8 sets of duplicates). Additionally, six other internal standards were used to check instrument performance and accuracy, including nicotinamide, BLS, MLS, USGS-61, N2, and CH7 (results shown in the SI file).
Whole blood samples from 46 namew were analyzed for [THg] at the K.C. Irving Environmental Science Centre’s Mercury Lab (Acadia University, Wolfville, NS; note that one additional sturgeon was sampled for fin clips, but its blood sample was lost due to a labeling error; Table SI-1). Total mercury concentrations (THg) was analyzed using thermal pyrolysis gold-amalgamation atomic absorption spectrometry (Nippon MA-3000). Quality assurance and control (QAQC) measures during THg analysis included certified reference materials (CRMs; DORM-4, % recovery = 102.9 ± 1.9%, n = 9; DOLT-5, % recovery = 99.4 ± 6.5%, n = 9), triplicate sample comparisons (relative standard deviation (RSD), % RSD = 2.5 ± 2.9%, n = 9), and method blanks. Method detection limit (MDL) was calculated as 3 × the standard deviation of repeated blanks; at standard 20 mg dry sample mass MDL = 6.2 ng/g (n = 25). Additionally, 12 blood samples (Table SI-1) were also analyzed for [MeHg] following methods described in Edmonds et al. (2010) and Lescord et al. (2015). Approximately 10.0 mg of dried blood was weighted using a 5-decimal Sartorius balance and MeHg was extracted in trace clean 2 mL glass vials with Teflon lids using a 25% methanol: potassium hydroxide digestion solution shaken for 1 h and then heated at 90 °C for 1 h. A 20 µL aliquot of this extract was captured on Tenax traps before species separation via gas chromatography and detection with cold vapor atomic fluorescence spectrometry (MERX system, Brooks Rand; Bloom and Fitzgerald 1988). The same QAQC measures as described above were assessed during MeHg analysis: two CRMs (DORM-4, % recovery = 81.8 ± 3.5%, n = 6; DOLT-5, % recovery = 92.4 ± 3.3%, n = 6), triplicate sample comparisons (% RSD = 4.4 ± 2.8%, n = 6), and method blanks (MDL = 0.17 ng/g; n = 10). It should be noted that, in fish, muscle and liver Hg burdens are correlated with blood [Hg] (Cizdziel et al. 2003).
2.5. Data handling and statistics
All graphing and statistics were done in R software (v. 4.1.2). Alpha was set at 0.05 for all statistical tests. The map in Fig. 1 was made in ArcMap 10.8. All Hg concentrations reported herein are based on dry weight (dw) measurements. Occasionally, dw concentrations were converted to wet weight (ww) by assuming 80% moisture to allow for direct comparisons with other studies (Mallory et al. 2018). Concentration data were log10-transformed for graphing and statistical testing to improve visualization and linearity of relationships. Model residuals were assessed after all tests and, in most cases, normality assumptions were met. If normality was violated, outliers were identified using Cook’s Distance test and were removed before re-running the analysis, as noted below. The percentage of MeHg was calculated for all samples with both [THg] and [MeHg] data using eq. 1:
(1)
A logit transformation was initially applied to %MeHg data prior to statistical testing, but the transformation had minimal effect on the results and raw %MeHg was used in all subsequent analyses.
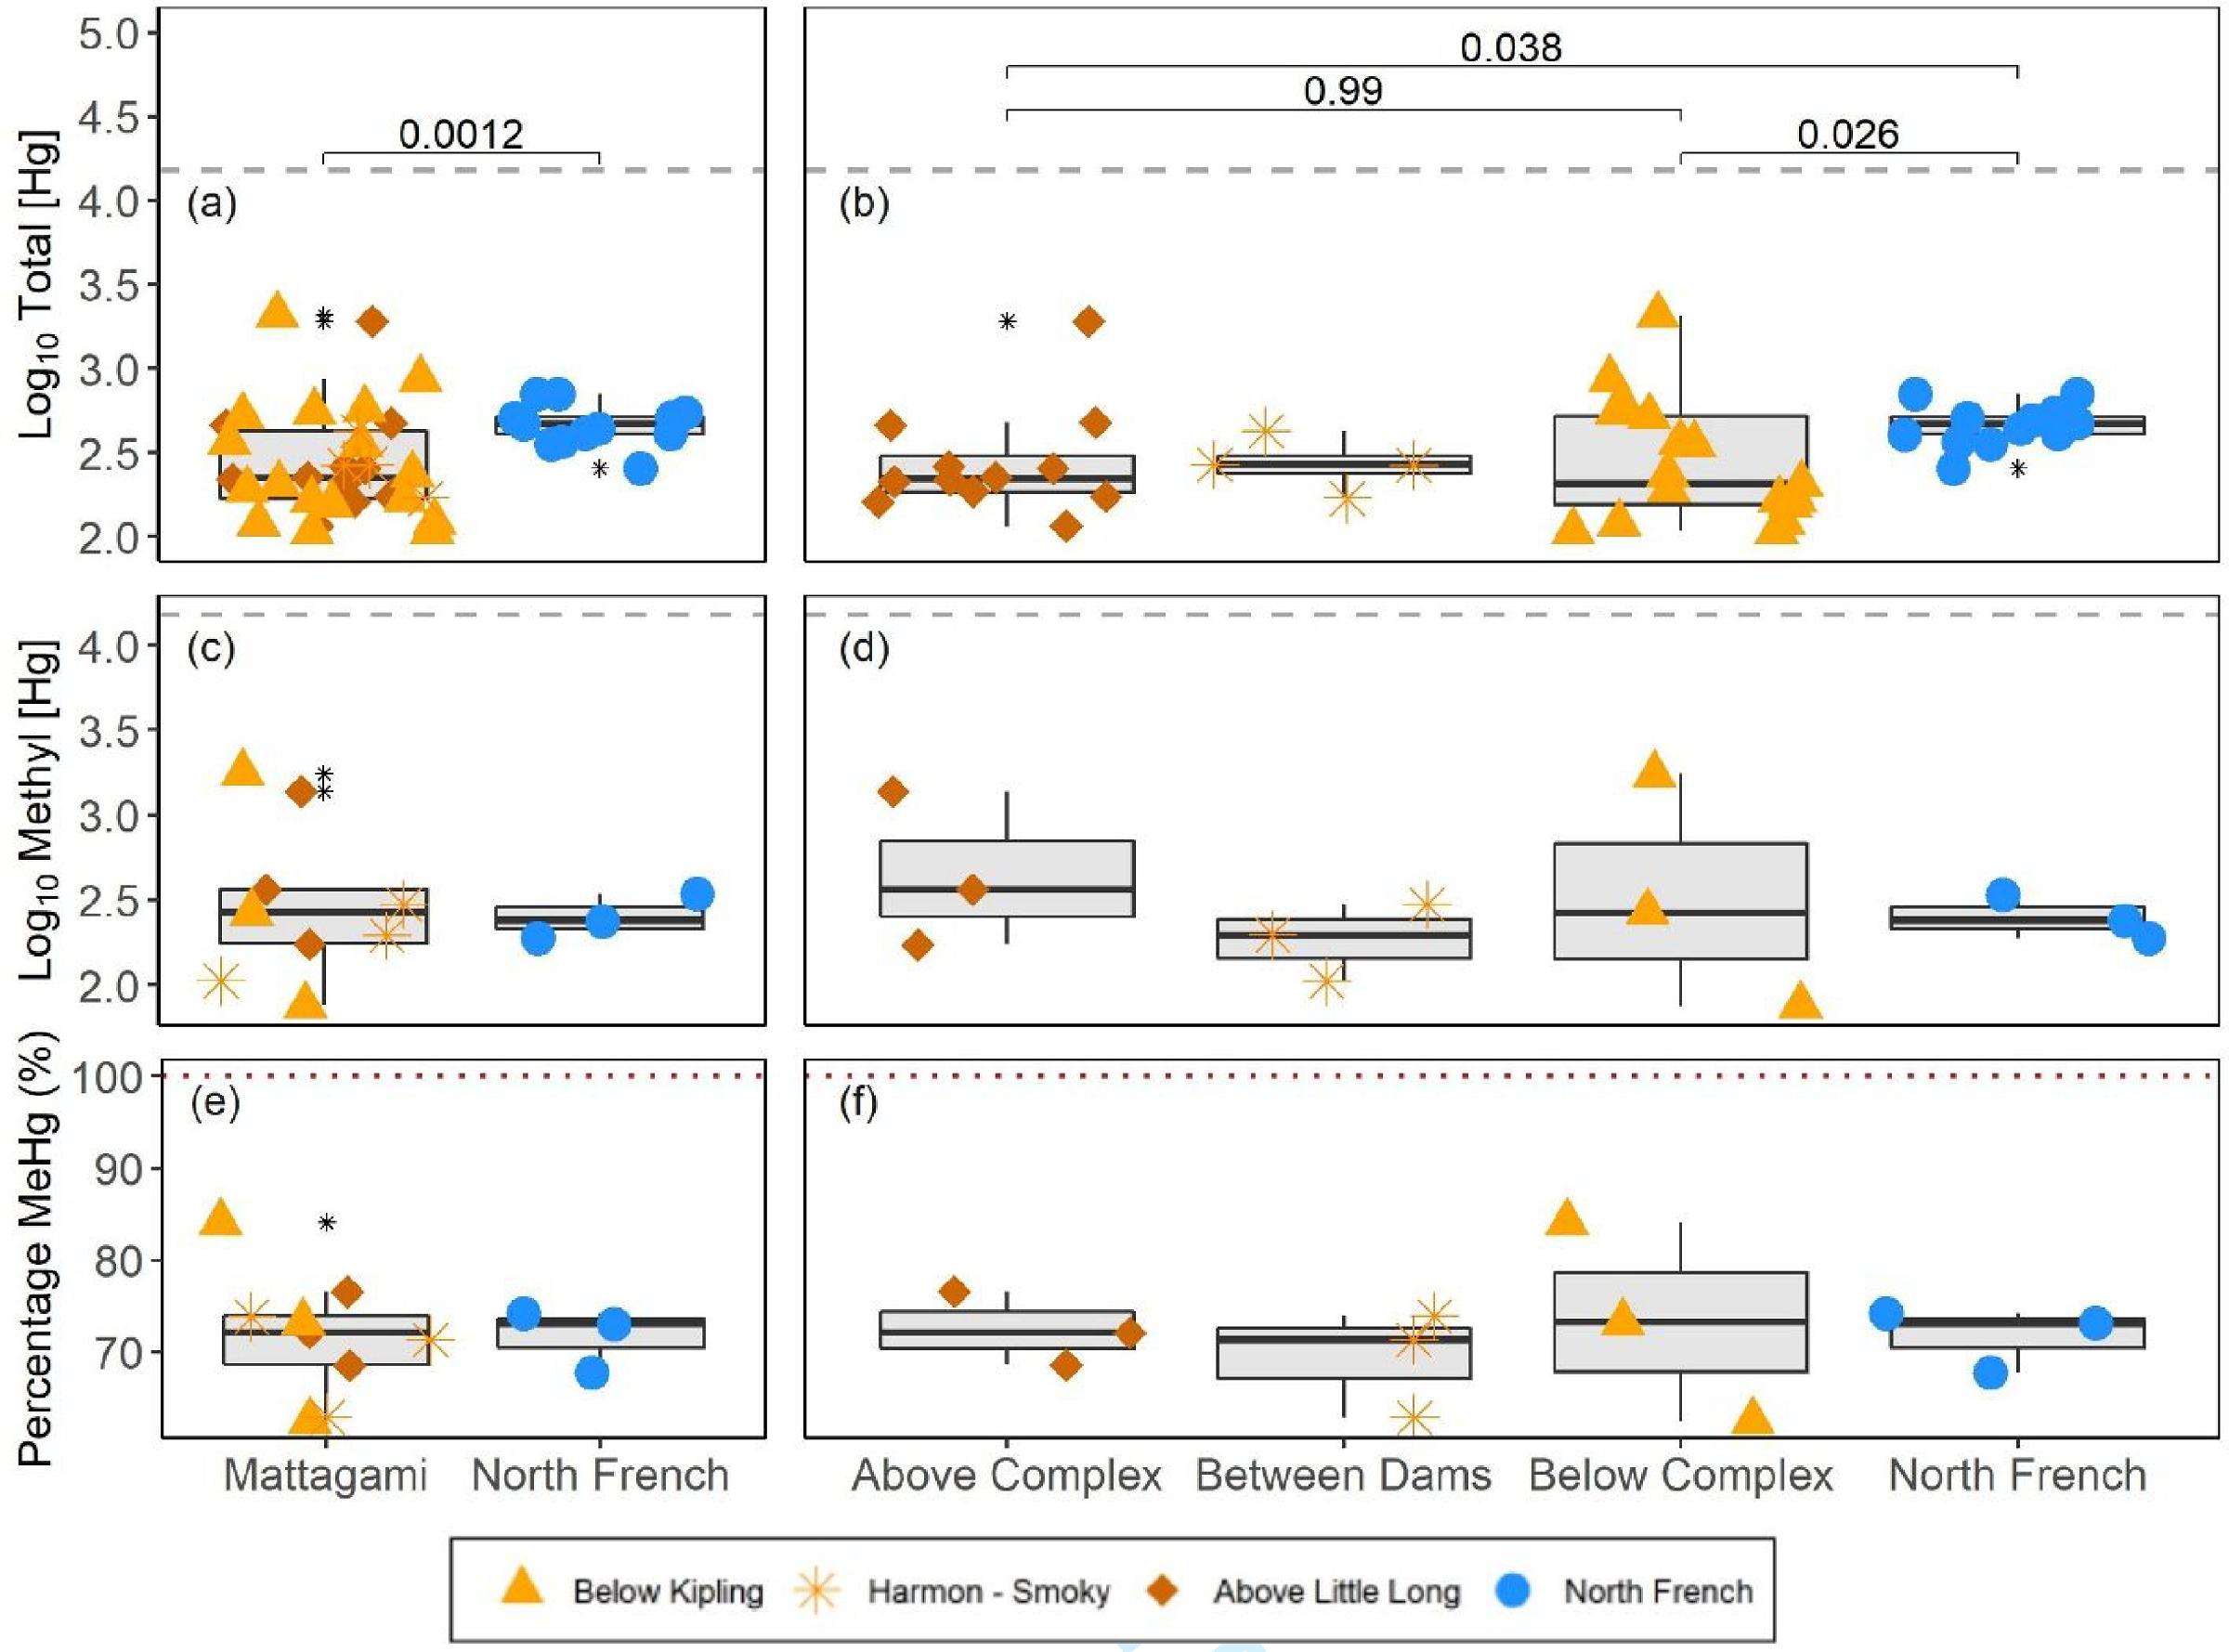
In general, comparative analyses and modeling were performed at two levels: by river (i.e., namew from the North French River vs. those pooled across all sampling locations on the Lower Mattagami River) or site (i.e., North French River vs. above the hydroelectric complex vs. between the generating stations vs. below the hydroelectric complex). For example, [THg] in namew blood were compared between rivers using two-sample t-tests. Additional comparisons were also made among sites within the Lower Mattagami River, though namew sampled between the Smoky and Harmon generating stations were not included in these site comparisons because of low sample size (n = 4). For both tests, results were added to box plots shown in Fig. 2 using the stat_compare_means() function from the ggpubr package. No river or site comparisons were performed for [MeHg] or %MeHg, due to limited data (n = 3/site); differences were therefore discussed qualitatively.
Fig. 2.
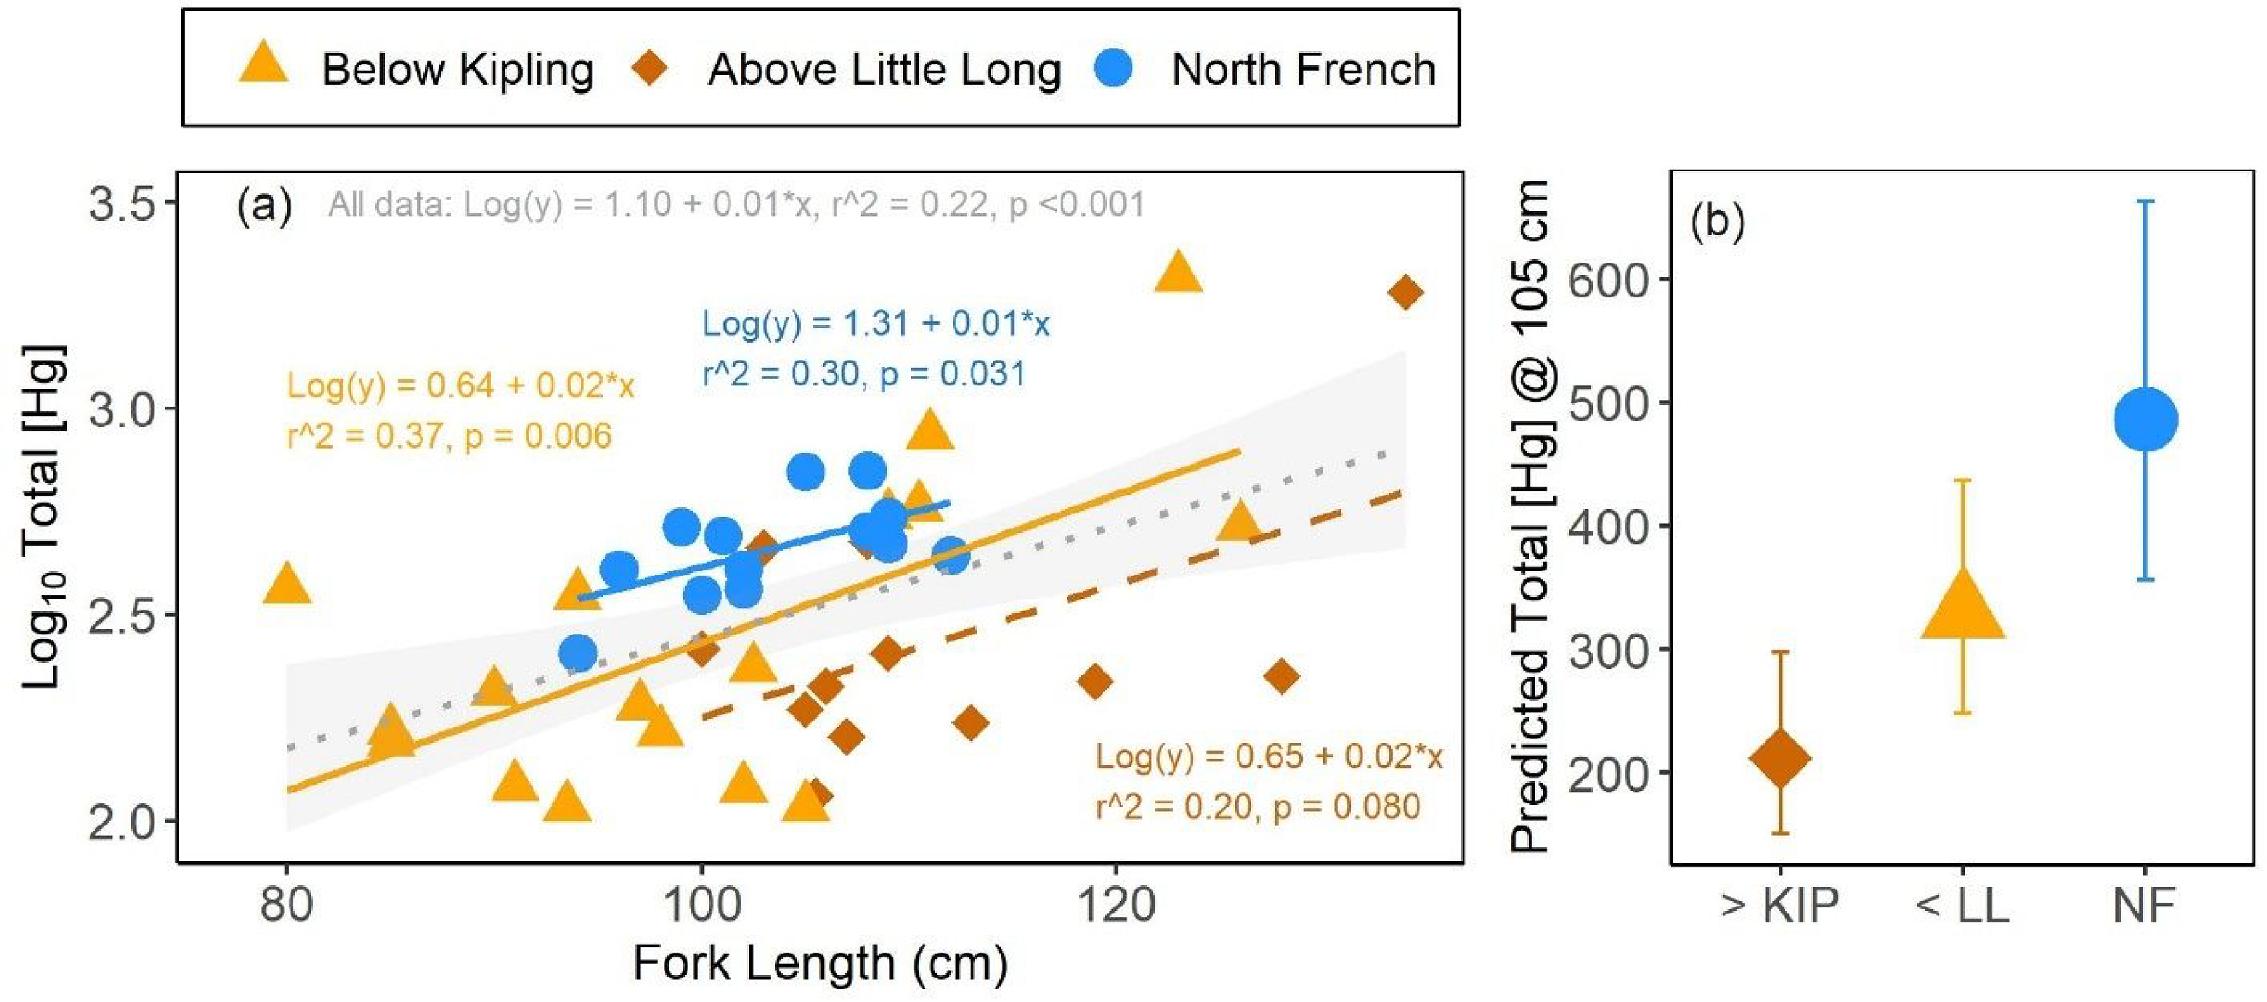
The relationships between namew blood [MeHg] and %MeHg and fork length were assessed using linear regression. An Analysis of covariance (ANCOVA) model was run to assess if the relationships between blood [THg] and fork length differed among four sites (i.e., North French, below, between, and above the hydroelectric complex on the Lower Mattagami River); again, this analysis excluded sturgeon from between Smoky and Harmon generating stations due to low sample size. The ANCOVA model structure was: log10[THg] ∼ Length + Site + Length*Site. Because the interaction term was insignificant (p > 0.05), it was removed, and the model was re-run to assess main effects. This model was used to predict the blood [THg] of a 105 cm long namew from each sampling site, to allow for a size adjusted comparison among sites. Additionally, linear regressions between blood [THg] and sturgeon fork length were run within each site to provide regression statistics presented in Fig. 3.
Fig. 3.
Stable isotope biplots were used to illustrate namew’s food web position across sites. Plots of unadjusted δ15N versus δ13C values in namew fin clips and invertebrate tissues were created within each of the four study sites. Additionally, dietary modeling was performed using both isotope tracers and the simmr R package, following methods outlined in Parnell et al. (2013), within three of these regions; below the hydroelectric complex was excluded because it had too few invertebrate groups to compare. In these models, namew were considered the “mixture” and all available benthic invertebrates, grouped by taxonomic order, were considered the “sources”. Across sites, models had 4–17 mixtures and 6–7 sources. The mean of each invertebrate population (or in some cases singular observation) within a given site was used as the order’s isotopic source value; for the region between the generating stations, this included averaging samples from between the Little Long and Smoky stations, and the Smoky and Harmon stations (Fig. 1). Trophic enrichment factors were set to 3.4 ± 0.1 and 0.8 ± 0.1 for δ15N versus δ13C, respectively (Vander Zanden and Rasmussen 2001). A second series of dietary models was also run to test for marine inputs in the sturgeon diet. These models included the mean δ15N and δ13C values of blue mussels (family Mytilidae) from northern James Bay, collected and analyzed by Dejong (2017): 8.74 ± 0.14 δ15N and −23.8 ± 0.27 δ13C, based on n = 7 mussels. The same trophic enrichment factors, as described above, were applied to these secondary models.
To examine the relationship between namew isotope ratios more accurately across sites, fin δ15N and δ13C data were adjusted to account for baseline variation, according to eq. 2:
(2)
Within each site, baseline adjustments used mean crayfish values because they were caught at all sites. Baseline adjustments were also made using clams and dragonfly data for comparison (data not shown); all modeling results and conclusions drawn were similar. To assess the relationship between blood [THg] and both isotopic values, two ANCOVAs were run across the three sites with ample data. The structure of these models was: log10[THg] ∼ δ15Nadj or δ13Cadj + Site + δ15Nadj or δ13Cadj*Site. In both models, three influential points (identified with Cook’s Distance test) were removed only when improvement to residual normality was warranted; two of these sturgeon were outliers in both models. Additionally, a third ANCOVA model was run, with fin δ15Nadj as the dependent variable and fork length as the covariate; this was done to predict and compare the trophic elevation (i.e., δ15Nadj) of a namew at 105 cm fork length across sites. In all models, the interaction term was removed when statistically insignificant, and the main effects were interpreted.
Finally, a series of multiple regression models were fitted and compared using Akaike’s information criterion (AIC). These models included log10[THg] in sturgeon blood as the dependent variable, and all possible combinations of four standardized predictor variables: fork length, whole body weight, fin δ15Nadj, and fin δ13Cadj. In total, 13 models were compared. All models with a delta AIC (ΔAIC) of less than 4 were considered “top” models and interpreted further. All models were standardized and compared using the AICmodavg package in R. The collective four influential points identified during the isotope ANCOVA models were also removed from this modeling exercise.
3. Results and discussion
3.1. Mercury concentrations in whole blood
Across all sturgeon sampled, whole blood [THg] ranged from 108 to 5464 ng/g dw and averaged 761 ± 1121 ng/g dw. These concentrations are 2-3 times higher than [MeHg] in whole blood sampled from 35 Atlantic sturgeon (Acipenser oxyrhynchus), which ranged from 30 to 250 ng/g dw (Mallory et al. 2018). Conversely, our [THg] range was 2-3 times lower than [THg] from blood spots collected from Arctic char (Salvelinus alpinus, ∼200–16 900 ng/g dw, assuming a percent moisture of 80%), another long-lived and cold-water fish (Barst et al. 2020). Overall, the blood [THg] measured herein fell below the estimated lowest-observed-adverse-effect level in birds, noted by Scheuhammer et al. (2015), of 3 μg/g ww (or roughly 15 000 ng/g dw), suggesting that concentrations in namew are not causing significant harm to fish health. We recognize that a fish benchmark would be more applicable; we were unable to find one based on fish blood specifically and thus chose to include the bird metric for reference. If one exists, we suggest it is more clearly discussed where applicable. Overall, the lack of Hg data in fish blood available in relevant literature is notable. For example, Webb et al. (2006) report collecting blood, but do not report any data or results therein.
Blood [THg] levels differed in namew across the various sites sampled herein. Namew from the unimpacted North French River had significantly higher [THg] in their blood than Lower Mattagami River fish (Fig. 2a; p = 0.0012). When the specific dam sites were considered, North French namew had significantly higher [THg] compared to fish caught below and above the hydroelectric complex (Fig. 2b; p = 0.026 and 0.038, respectively). However, there was no significant difference between namew caught below and above the hydroelectric complex (p = 0.99; Fig. 2b). These comparisons were made with unadjusted [THg] that do not account for any differences in fish size among the sites compared; see Section 3.2 for more information.
Methyl [Hg] in namew blood ranged from 76 to 1749 ng/g dw, which represented 62.5%–84.1% of the [THg] measured across all fish sampled. The blood [MeHg] of 30–2500 ng/g measured in Atlantic sturgeon (Mallory et al. 2018) was more comparable to our [MeHg] than our [THg] estimates, as discussed above. While not statistically compared due to low sample sizes, [MeHg] was more similar between sites than [THg] (Fig. 2c). Interestingly, namew caught below the most downstream generating station (i.e., below Kipling Generating Station), had more variable [THg], [MeHg], and %MeHg than fish from the other sites (Figs. 2c and 2d). Similarly, blood %MeHg was comparable across sites but was most variable in fish caught below the Kipling Generating Station (Figs. 2e and 2f). It is possible that these fish include individuals from upstream, since namew have been documented moving through the spillways and traveling downstream (according to unpublished acoustic telemetry data from the Learning from Lake Sturgeon program), adding to the variability in fish at this site (O'Connor, Simard, unpublished). The %MeHg in fish blood is expected to be high, due to the efficient uptake of MeHg from intestinal tissue, relative to inorganic Hg (Hg(II); Peng et al. 2016).
3.2. Relationships between mercury measures in blood and fish size
Overall, larger namew had higher [THg] in their blood. Fork length was a significant predictor of blood [THg] within two out of the three sites tested (Fig. 3a). More specifically, namew from the North French River and from above the hydroelectric complex (i.e., Little Long Generating Station) had significantly higher [THg] as fish fork lengths increased. Fish from below this complex (i.e., below Kipling Generating Station) showed a similarly positive but insignificant blood [THg] versus fork length relationship (Fig. 3a). The slopes of these relationships did not differ significantly among sites (ANCOVA interaction term p = 0.927; Table SI-5) and, when combined, blood [THg] showed a significant and positive relationship with fork length across all sturgeon (r2 = 0.22, p < 0.001; Fig. 3a). Blood %MeHg also showed a positive linear trend with fork length, but the relationship was statistically insignificant (r2 = 0.15, p = 0.121; Fig. SI-1b). It is possible that higher [Hg] in blood from larger sturgeon may reflect a shift in diet; Jansen (2022) found that larger lake sturgeon ate larger prey with higher Hg burdens in Manitoba rivers (Canada). Additionally, [Hg] in fish blood has been shown to correlate with muscle and liver [Hg] (Cizdziel et al. 2003), and thus reflect the overall body burden in a fish, which is known to increase with fish size. Interestingly, Mallory et al. (2018) found that the relationship between blood [MeHg] and body size in Atlantic sturgeon was dependent on sex; only female Atlantic sturgeon showed a significant positive relationship. We did not determine sex for the namew sampled in the current study.
Namew sampled from the North French River spanned a smaller size range (94–112 cm fork length (FL)) than those sampled from the other sites (80–126 cm FL below Kipling Generating Station, 100–134 cm FL above Little Long Generating Station). When mean predicted values of blood [THg] at a shared fork length of 105 cm were compared among sites, the differences match those described in Section 3.1 using the raw data. More specifically, North French namew at 105 cm fork length had approximately 2.3 times higher [THg] in their blood, when compared to 105 cm fish from above the hydroelectric complex, which showed the lowest [THg] of the three sites compared (Fig. 3b). Namew of similar size from below the hydroelectric complex had approximately 1.5 times higher [THg] when compared to namew upstream of this complex, and 1.5 times lower [THg] than North French fish.
Taken together, the results from Sections 3.1 and 3.2 show that namew blood Hg levels are highest in the unimpacted North French River, and not in fish caught above or below the hydroelectric complex on the Lower Mattagami River. Given that the initial construction of the generating stations happened 60–90 years ago, it is likely that any increase in Hg from the flooded landscape in the Lower Mattagami River has subsided, like other impacted fish across North America (Willacker et al. 2016). It is noteworthy, however, that namew were sampled from upstream of the Little Long reservoir, not directly within the reservoir; namew residing within the reservoir itself may be exposed to higher [MeHg], particularly in the deeper anoxic sections (St. Louis et al. 2004). It is possible that the North French system, which is a notably lower order stream when compared to the Lower Mattagami River, may have slower growing sturgeon, which could explain their higher Hg concentrations (Sandheinrich and Drevnick 2016). The associated differences in river morphology, catchment characteristics, and limnology could impact Hg cycling and bioaccumulation potentials between these two systems (Lehnherr 2014; Lescord et al. 2019; Emmerton et al. 2022).
3.3. Differences in food web structure and sturgeon trophic ecology between sites
The food web structure assessed herein based on stable isotope ratios differed considerably among the study sites. In the North French River, namew’s food web position did not align with those of benthic invertebrates in the river. Specifically, δ13C of namew was more depleted than that of the sampled invertebrates, suggesting that namew may be consuming an alternate prey source in the North French River (Fig. 4a). As expected, the namew’s more positive δ15N values suggest they are at a higher trophic elevation than the sampled invertebrates (Fig. 4a). Crayfish were the closest invertebrate to namew, in terms of their isotope values (Fig. 4a) and, as a result, they were determined to be the dominant prey item for this site (Fig. 4b). It is notable that our invertebrates were caught on the lower North French River and it is possible that differences in water velocity and the associated gas change may alter biotic isotopic values, accounting for some of the differences between invertebrate and namew values (Finlay et al. 1999).
Fig. 4.
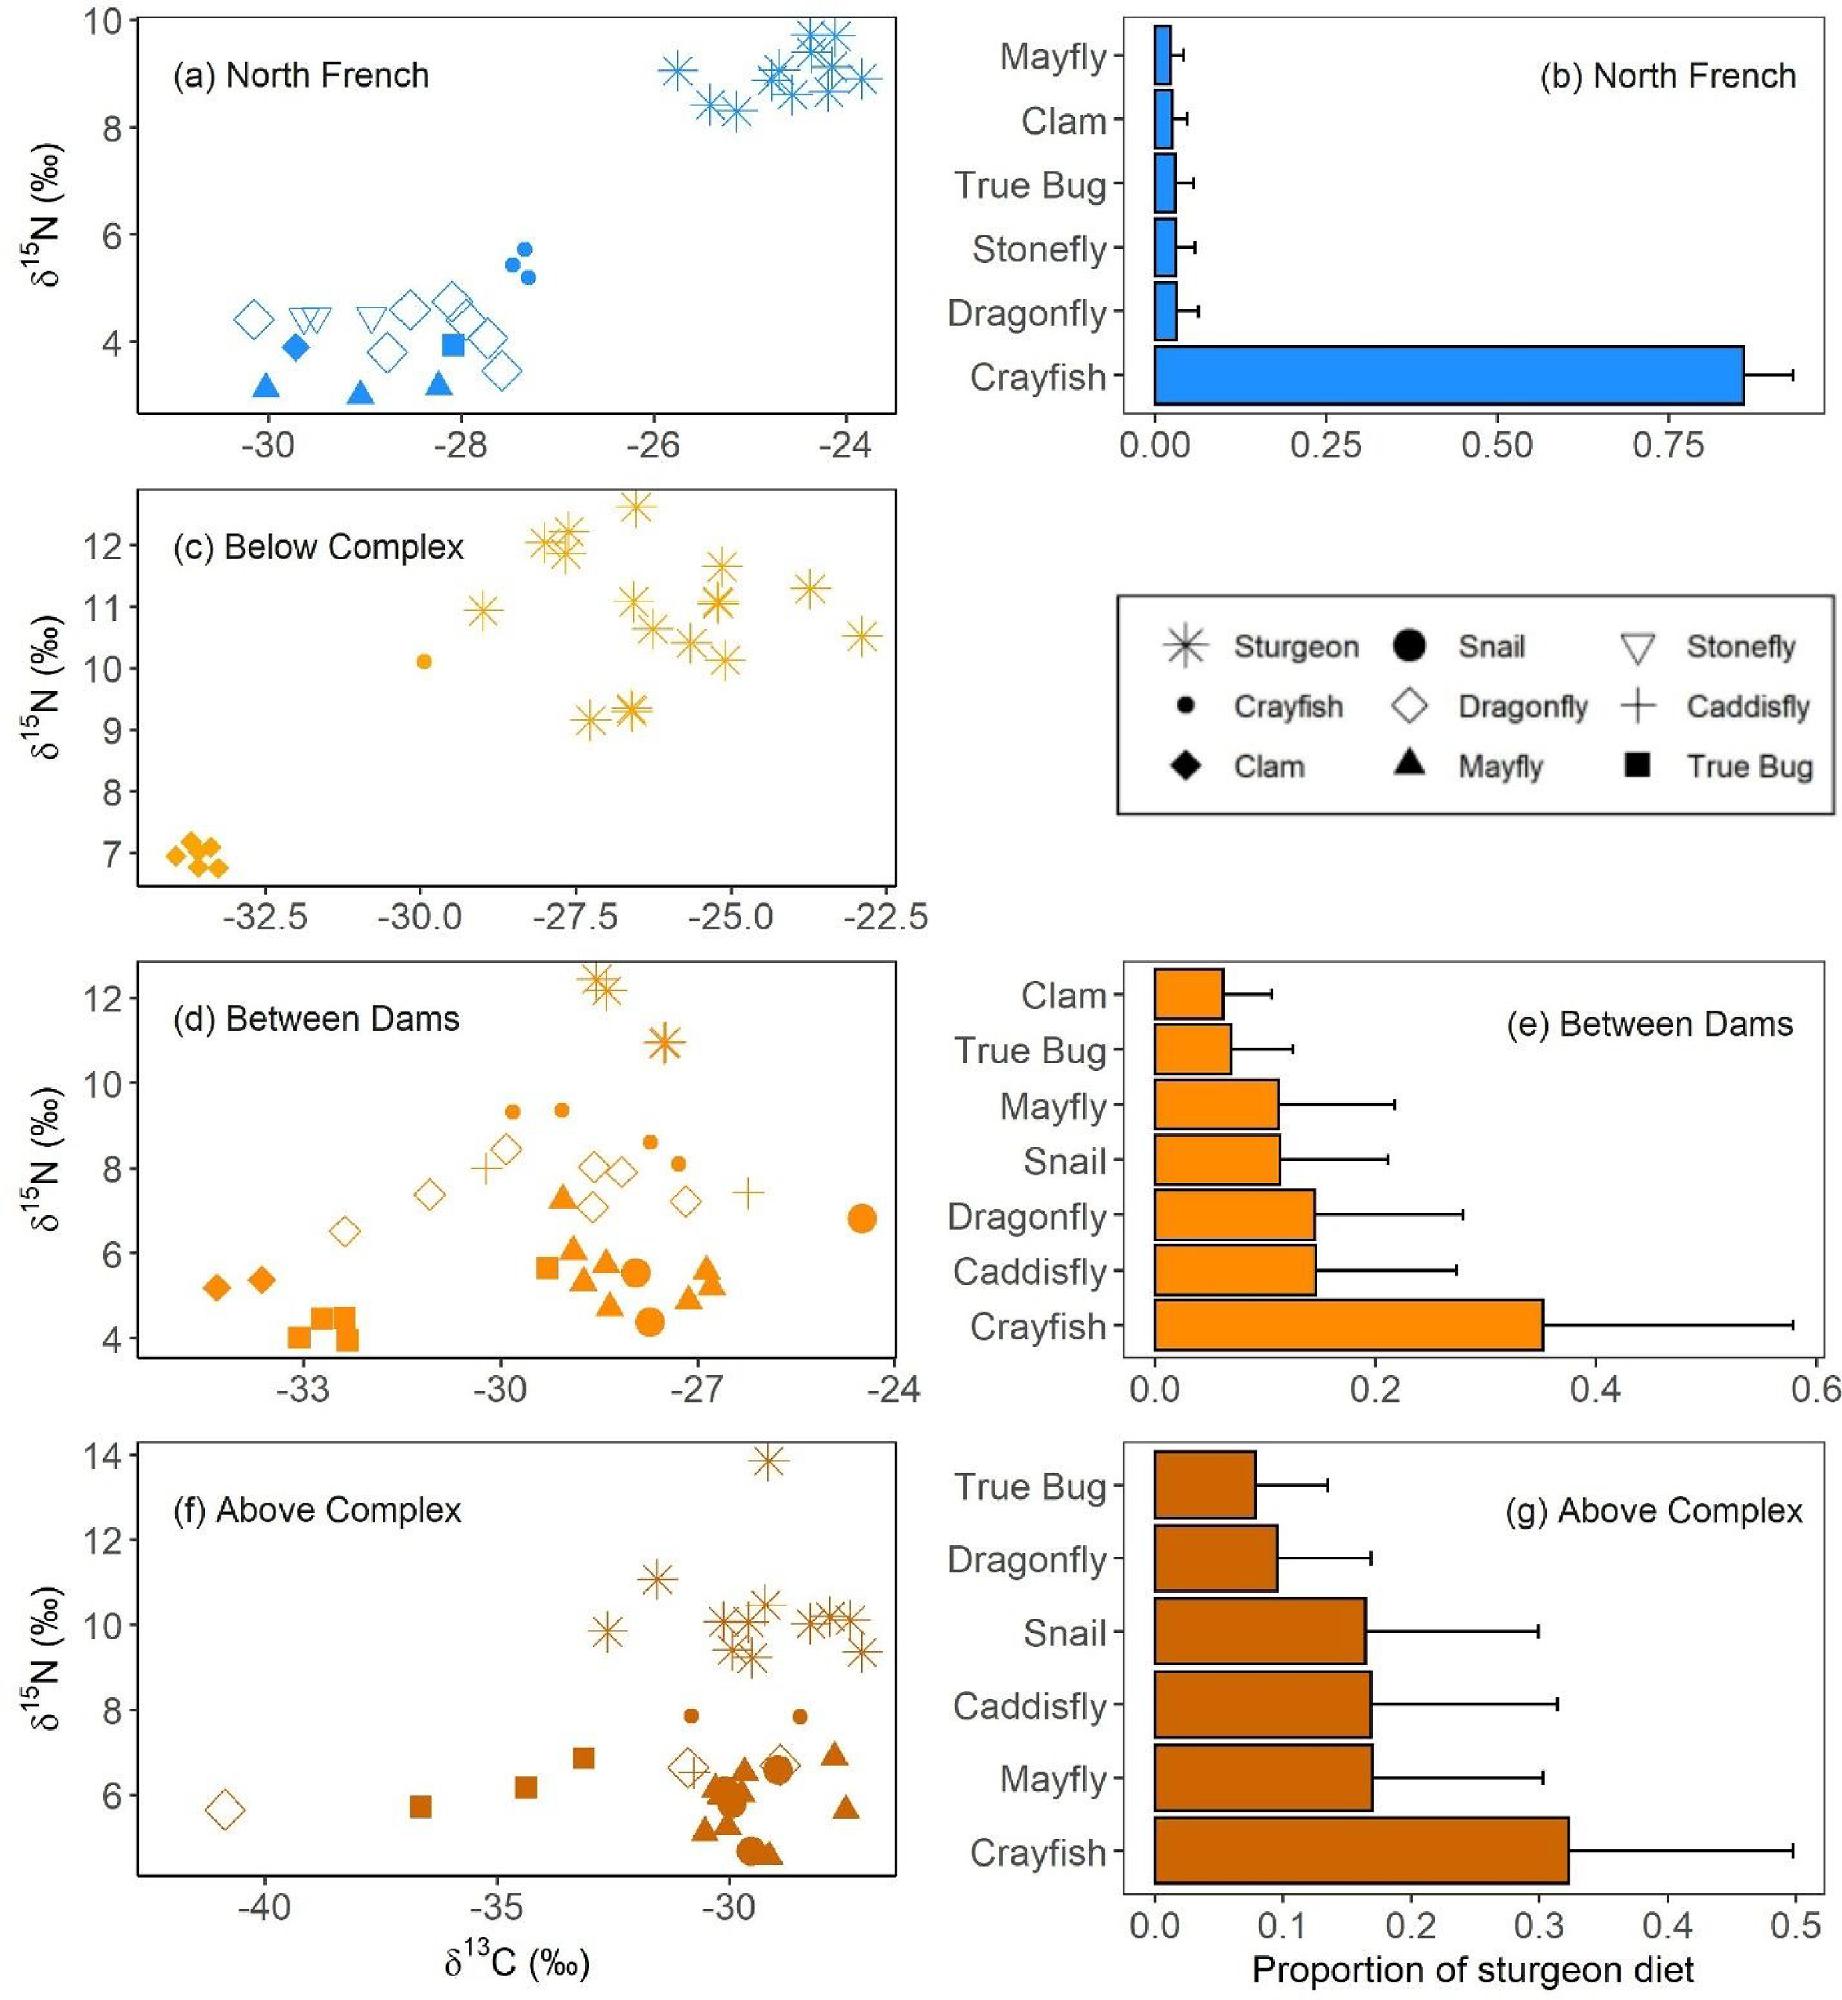
Similarly, at the Kipling Generating Station, namew also had more negative δ13C values and more positive δ15N values, when compared to the clam isotope values (Fig. 4c). However, very few benthic invertebrates were caught at this site, limiting further dietary modeling. The lower shoreline invertebrate catches at this site may be due to the highly variable flow regimes below Kipling Generating Station, which is the final generating station on the Mattagami River. Wide fluctuations in river water have been shown to extirpate invertebrates from littoral habitats (Kennedy et al. 2016) and aligns with our findings. In both the food web models below Kipling Generating Station and the North French River, it is likely that we are missing important prey items that match the δ13C values of namew therein, despite significant efforts made in sampling the base of the aquatic food webs thereof. Lake sturgeon are known to eat crayfish (Braun et al. 2018), as our modeling suggests, but their diets can be diverse and include oligochaetes, amphipods, chironomids, and small fishes (Jackson et al. 2002; Guilbard et al. 2007; Gosch et al. 2016), none of which we sampled. Fish eggs, another potential food item absent from our modeling, were estimated to account for 43% of lake sturgeon’s diet from the Rainy River (Ontario, Canada; Smith et al. 2016). These gaps in dietary data may be contributing to the high proportions of crayfish in namew’s diets, shown in Fig. 4b.
Conversely, in the sites within and above the hydroelectric complex, namew isotopic values were more aligned with those of the invertebrates sampled (Figs. 4d and 4f). In both sites, namew δ15N values were notably closer to those of invertebrates, when compared to the food web plots of the sites in the North French River and below Kipling Generating Station (Figs. 4a and 4c). According to dietary modeling, crayfish were still the primary prey item for these namew though the contributions of other invertebrate groups (e.g., mayflies, caddisflies, dragonflies, and snails) were notably higher when compared to the North French dietary modeling (Figs. 4b, 4e, and 4g). These invertebrate groups accumulate MeHg at different rates (Malcata Martins et al. 2021; Clarke et al. 2022); thus, such changes in dietary habits may impact Hg burdens in fish. Overall, these results show that namew above one or more generating stations had notably different diets, when compared to namew with unobstructed access to the lower Moose River.
Although lake sturgeon are primarily a freshwater fish, some lake sturgeon populations in large rivers with a marine confluence are known to be anadromous, semi-anadromous, or amphidromous (Guilbard et al. 2007). Isotopic estimates from marine mussels (family Mytilidae) are more enriched in 15N and 13C when compared to freshwater bivalves and other invertebrates (Fig. SI-2; Dejong 2017). When these estimates are added into the dietary modeling exercises, marine mussels displace crayfish as the primary dietary item for namew in the North French River and below Kipling Generating Station (Fig. SI-3, a–d). In contrast, there is no significant change to the diet modeling for namew from between the generating stations or above the hydroelectric complex (Fig. SI-3, e–h). Thus, it is possible that marine prey are contributing to namew’s dietary isotope values, particularly for namew with unobstructed access to the marine environment (i.e., for namew in the North French River and namew captured below Kipling Generating Station). Past work on northern Ontario rivers has shown that anadromous fish, including cisco, reflect a marine baseline isotope value and should before accounted for in our inclusion of marine muscles herein (DeJong 2017; Lescord et al. 2022). However, lake sturgeon migration patterns are diverse, and some populations have been shown to be freshwater residents (Kessel et al. 2018). Furthermore, the unpublished telemetry data and catch records to date from the Learning from Lake Sturgeon partnership program have not documented namew in the North French River migrating out into the Moose River, although movement from below Kipling generating station into the lower Moose River has been recorded (O'Connor, Simard, unpublished). The lower Moose River is also highly tidal and namew behavior may be influenced by salinity gradients, which have been shown to affect movement and diets of two sturgeon species in the St. Lawrence River Estuary (Guilbard et al. 2007). Though it is noteworthy that BMIs caught at the mouth of the lower Moose River did not show heavier isotope values, suggesting their exposure to the marine tides may be minimal (Figs. SI-2 and SI-4a). Overall, a more extensive freshwater food web analysis is needed before we can conclude which dietary items are of greatest importance to these two groups of Moose River namew.
Namew downstream of and between the generating stations also appeared to have enriched δ15N values in their fin clips, when compared to fish from other sites (Fig. SI-4). In fact, unadjusted δ15N values in namew from the impacted Lower Mattagami River were 1.9 ‰ higher on average than those measured in namew from the intact North French River. The baseline organisms analyzed within the Mattagami River sites—including clams, crayfish, and dragonflies—also showed more positive δ15N values (Fig. SI-4), indicating a site-wide effect on isotope values. These differences could be due to varying nitrogen inputs and biogeochemical fractionation among the sites. However, δ15N values also tend to increase with fish size, like [Hg]. Thus, after baseline-adjustments using crayfish data, we estimated the δ15N value of a 105 cm namew using an ANCOVA model; namew from the North French River had higher predicted δ15Nadj values at 105 cm fork length (i.e., 3.56 ‰) than namew from either above (2.20 ‰) or below (1.00 ‰) the hydroelectric complex (see Tables SI-6 for full ANCOVA model and SI-5 for the predictions). These higher δ15Nadj values may be related to the differences in food web structure discussed in Section 3.3 above. For example, a diet including small fishes or fish eggs could explain these namew’s elevated trophic levels, implied by the higher δ15Nadj values observed. It is noteworthy that δ15N values can change along freshwater continuums, due to influences of various abiotic processes on fractionation rates (Zhang et al. 2022). However, the baseline-correction of namew isotope values should account for such differences between sites. It is possible our baseline organisms, which were caught nearer to the confluence of the North French and Moose rivers during the late summer, may not reflect the springtime baseline conditions further upstream in the North French River, where all the namew were caught. Nevertheless, these results suggest that the higher blood [THg] in North French namew may be partly due to differences in their diets, leading to higher trophic elevations.
3.4. Predictors of [THg] in sturgeon blood
When multiple potential explanatory variables were considered together, trophic position was found to be the strongest and most consistent predictor of blood [THg] in sturgeon from all sites studied herein. The top four predictive models all included δ15Nadj (Table 1). The highest ranked model, which included δ15Nadj and fork length was notably stronger (r2 = 0.41 and AIC weight = 0.45) than the next three models (r2 = 0.36–0.38, AIC weight = 0.13–0.27; Table 1). Furthermore, the second strongest model included only δ15Nadj. Fish weight and δ13Cadj had smaller coefficients in the two top models in which they were included, and these parameters were not statistically significant predictors of blood [THg] within those models (Table 1). Nine other models were also considered in this modeling exercise, but all had weak explanatory power (r2 < 0.01–0.14, AIC weight < 0.01; Table SI-10).
Table 1.
| Coefficients | Model metrics | ||||||||||
|---|---|---|---|---|---|---|---|---|---|---|---|
| Model ranking | Int. | δ13Cadj | δ15Nadj | Fork length | Weight | R2 | degrees of freedom (DF) | Log likelihood | AICC | ΔAIC | AIC weight |
| 1 | 2.47 | – | 0.29* | 0.11 | – | 0.41 | 4 | 10.43 | −11.80 | 0.00 | 0.45 |
| 2 | 2.47 | – | 0.30* | – | – | 0.36 | 3 | 8.68 | −10.70 | 1.05 | 0.27 |
| 3 | 2.47 | 0.08 | 0.32* | – | – | 0.38 | 4 | 9.36 | −9.60 | 2.14 | 0.15 |
| 4 | 2.47 | – | 0.29* | – | 0.06 | 0.37 | 4 | 9.21 | −9.30 | 2.44 | 0.13 |
Note: In total, 11 models were compared (ΔAIC < 4). All δ15N values were baseline corrected. (VIF range = 1.09–6.06). * indicates a significant predictor of blood [THg] in a subsequent linear regression within that model structure. ΔAIC, delta AIC.
Namew blood [THg] increased with δ15Nadj in all three study sites tested (Fig. 5a). However, this relationship was only statistically significant within the downstream impacted site, below Kipling Generating Station (r2 = 0.29, p = 0.022; Fig. 5a). Relationships between [THg] and δ15Nadj in the namew in the North French River and above the Little Long reservoir were positive, but weak (r2 < 0.01 and 0.16, respectively) and insignificant (p = 0.486 and 0.126, respectively; Fig. 5a). As with fork length relationships, the slopes of the THg-to-δ15Nadj relationships did not differ among sites (interaction term p = 0.693, see Table SI-8 for full ANCOVA modeling results). Once combined, δ15Nadj had a strong and positive effect on blood [THg] across all namew sampled (r2 = 0.39, p < 0.001; Fig. 5a). Conversely, blood [THg] did not vary significantly with δ13Cadj in namew sampled from sites in the North French River or above the Little Long Generating Station (Fig. 5b). Conversely, [THg] had a negative relationship with δ13Cadj at the site below Kipling Generating Station (Fig. 5b), suggesting that differences in namew diet impacted their Hg exposure. Again, the namew caught below Kipling Generating Station may represent individuals from above the generating station(s), which went through the spillways, and may add variability to the site data. Unlike the δ15N model, the within-site slopes between length and δ13Cadj were significantly different (interaction term p = 0.033; see Table SI-9 for full ANCOVA modeling results); thus, no model was assessed for pooled data.
Fig. 5.
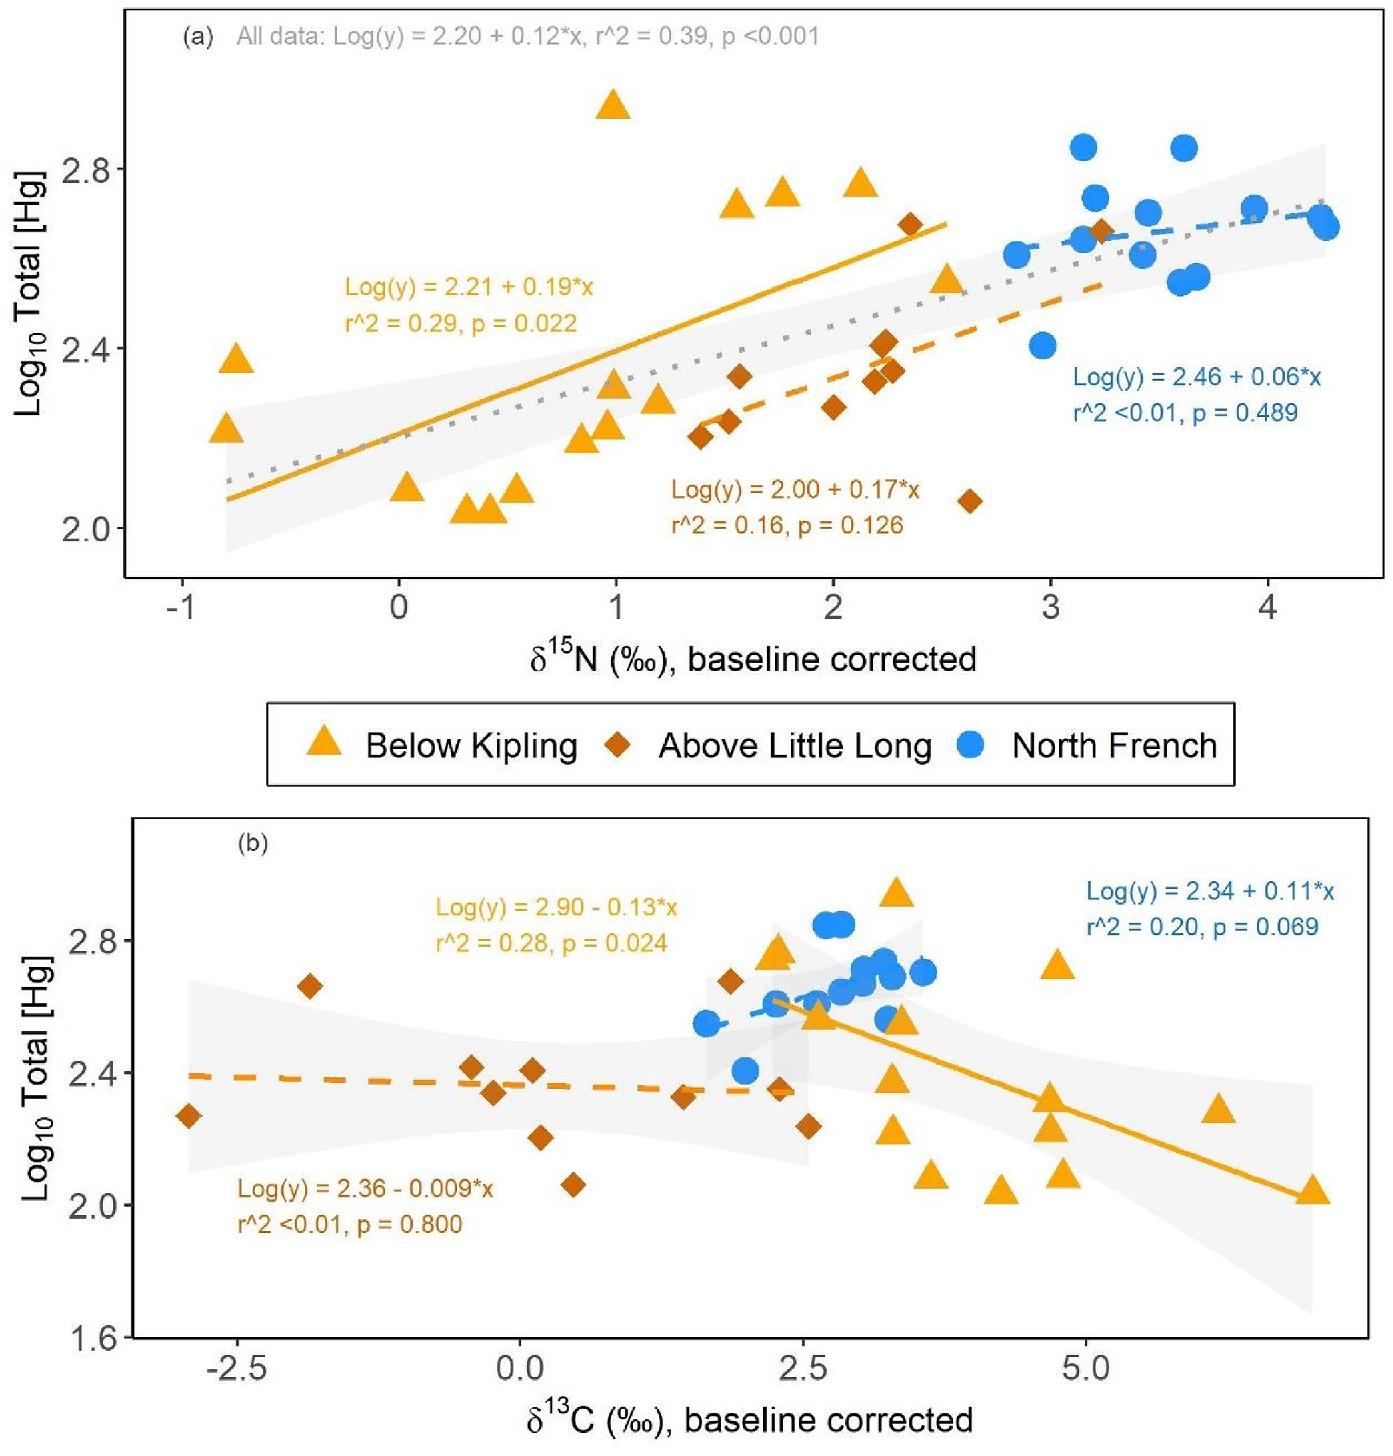
We recognize that using crayfish as a baseline organism to adjust isotope values is not conventional. Typically, a primary consumer would be used, such as a clam, rather than an omnivorous decapod. However, crayfish represented the most complete invertebrate caught among all the sites compared and allowed for the comparisons of three sites. Calms, on the other hand, were only caught at two of our study sites and their use as a baseline would have limited our modeling. Nevertheless, for comparisons sake, we also ran the ANCOVA modeling using clams as our baseline adjustment for namew isotope values; no clams were found above the Little Long dam, so this important site was removed from these comparison models. These models show that, across the North French and Kipling sites, the relationships between log [THg] in namew blood and adjusted isotope values using clam data (i.e., Fig. SI-5, Tables SI-12 and SI-13) strongly agree with results using crayfish to baseline adjust (Fig. 5). Site was not long a significant variable in these models, likely due to the exclusion of the Little Long data (Tables SI-12 and SI-13). The only other notable difference was an insignificant interaction terms in the δ13Cadj model, allowing for an overall negative trend between δ13Cadj and log [THg] to be determined. Overall, the similarity in these results suggest that crayfish are an acceptable baseline when their isotopic values show food web alignment, as in our study herein.
Taken together, our results suggest that unexplained differences in trophic ecology may be a key driver of higher blood [THg] in namew from the North French River. It is possible that baseline [Hg] is also different among these sites. On a Quebec river, flooding and alterations to basal carbon and Hg cycling promoted MeHg uptake into the base of the food web, temporarily increasing fish Hg burdens within a run-of-river hydroelectric complex (Ponton et al. 2021). Future studies should consider more extensive food web modeling, including baseline modeling and assessing trophic magnification slopes (Lavoie et al. 2019).
3.5. Implications and future work
As a product of a community research project, this paper aimed to better understand the long-term impacts of the Lower Mattagami River hydropower development on namew’s Hg burdens and diet. It is a small part of a larger effort to understand the impacts of land-use on namew’s conservation within the Moose Cree Homeland. From this work, we can conclude that we do not see elevated Hg and MeHg in sites impacted by established hydroelectric development, relative to a reference site. However, we do see differences in namew diet, particularly downstream of the hydroelectric facilities, which may be the result of large fluctuations in water levels and represent a potential avenue to explore for operational improvements. Additional work is needed to fully understand the implications of these findings, for namew within their region and lake sturgeon more broadly. Specifically, future studies may consider Hg levels in other sturgeon tissues (e.g., muscle), and additional dietary end points in subsequent modeling.
Acknowledgements
We firstly thank the Moose Cree First Nation for their support during this project. Funding for this work was provided by the Canadian Department of Fisheries and Oceans (DFO), TD Friends of the Environment Foundation, the Weston Family Foundation, and an anonymous family foundation. We further thank Fred and Roger Simard, Justin Simard, Ocean Phillips, Rachel Corston, Emma Simard, Zoe Simard, Trevor Small, Adrian Linklater, Colby Kapashesit, Clarence Trapper, Ron Spencer, Alex Litvinov, Ryan Sunderland, and the John R Delaney Youth Centre Staff for their assistance with field work and logistics. Additionally, we thank Ben Barst and Mark Mallory for their guidance on collection methods, and Denina Simmons, Keisha Deoraj, and John Gunn for their input throughout this work.
References
Barbosa R.V., Point D., Médieu A., Allain V., Gillikin D.P., Couturier LI.E., et al., 2022. Mercury concentrations in tuna blood and muscle mirror seawater methylmercury in the Western and Central Pacific Ocean, Marine Pollution Bulletin, 180, 113801, ISSN 0025-326X.
Barst B.D., Wooller M.J., O'Brien D.M., Santa-Rios A., Basu N., Köck G., et al. 2020. Dried blood spot sampling of landlocked arctic char (Salvelinus alpinus) for estimating mercury exposure and stable carbon isotope fingerprinting of essential amino acids. Environmental Toxicology and Chemistry, 39: 893–903.
Billard R., Lecointre G. 2001. Biology and conservation of sturgeon and paddlefish. Reviews in Fish Biology and Fisheries.
Bilodeau F., Therrien J., Schetagne R. 2017. Intensity and duration of effects of impoundment on mercury levels in fishes of hydroelectric reservoirs in northern Québec (Canada). Inland Waters, 7(4): 493–503.
Bloom N.S., Fitzgerald W. 1988. Determination of volatile mercury species at the picogram level by low-temperature gas chromatography with cold-vapour atomic fluorescence detection. Analytica Chimica Acta, 208: 151–161.
Bodaly R.A., Jansen W.A., Majewski A.R., Fudge R.J.P., Strange N.E., Derksen A.J., Green D.J. 2007. Postimpoundment time course of increased mercury concentrations in fish in hydroelectric reservoirs of northern Manitoba, Canada. Archives of Environmental Contamination and Toxicology, 53: 379–389.
Braaten P.J., Fuller D.B., McClenning N.D. 2007. Diet composition of larval and young-of-year shovelnose sturgeon in the Upper Missouri River. Journal of Applied Ichthyology, 23, 516–520, First published: 31 January 2007.
Braun D.P., Phillips I.D., Nanayakkara L., Wissel B. 2018. Diet characterization and a preliminary investigation into trophic niche placement for an endangered lake sturgeon (Acipenser fulvescens) population in the Saskatchewan River, SK, Canada. PLoS ONE, 13: e0206313.
Cebalho E.C., Díez S., dos Santos Filho M., Muniz C.C., Lázaro W., Malm O., Ignácio A.R.A. 2017. Effects of small hydropower plants on mercury concentrations in fish. Environmental Science and Pollution Research, 24: 22709–22716.
Cizdziel J., Hinners T., Cross C., Pollard J. 2003. Distribution of mercury in the tissues of five species of freshwater fish from Lake Mead, USA. Journal of Environmental Monitoring, 5: 802.
Clarke R.G., Klapstein S.J., Hillier N.K., O'Driscoll N.J. 2022. Methylmercury in caddisflies and mayflies: influences of water and sediment chemistry. Chemosphere, 286: 131785.
Cooke S.J., Cech J.J., Glassman D.M., Louttit S., Lennox R.J., Font L.C., et al. 2020. Water resource development and sturgeon (Acipenseridae): state of the science and research gaps related to fish passage, entrainment, impingement and behavioural guidance. Reviews in Fish Biology and Fisheries 30, 219–244.
Dejong R.A. 2017. Life history characteristics of Lake Whitefish (Coregonus clupeaformis), Cisco (Coregonus artedi), and Northern Pike (Esox lucius) in rivers of the Hudson Bay Lowlands. University of Waterloo, M.Sc. Thesis.
Edmonds S.T., Evers D.C., Cristol D.A., Mettke-Hofmann C., Powell L.L., McGann A.J., et al. 2010. Geographic and seasonal variation in mercury exposure of the declining Rusty Blackbird. Condor, 112: 789–799.
Emmerton C.A., Drevnick P.E., Serbu J.A., Cooke C.A., Graydon J.A., Reichert M., et al. 2022. Downstream modification of mercury in diverse river systems underscores the role of local conditions in fish bioaccumulation. Ecosystems, 1–20.
Finlay J.C., Power M.E., Cabana G. 1999. Effects of water velocity on algal carbon isotope ratios: implications for river food web studies. Limnology and Oceanography, 44(5): 1198–1203.
Gosch N.J.C., Miller M.L., Gemeinhardt T.R., Starks T.A., Civiello A.P., Long J.M., Bonneau J.L. 2016. Age-0 shovelnose sturgeon prey consumption in the Lower Missouri River. River Research and Applications, 32: 1819–1823.
Guilbard F., Munro J., Dumont P., Hatin D., Fortin R. 2007. Feeding ecology of Atlantic Sturgeon and Lake Sturgeon co-occurring in the St. Lawrence Estuarine Transition Zone. American Fisheries Society Symposium. pp. 85–101.
Hall B.D., Bodaly R.A., Fudge R.J.P., Rudd J.W.M., Rosenberg D.M. 1997. Food as the dominant pathway of methylmercury uptake by fish. Water, Air, & Soil Pollution 100, 13–24.
Hall B.D., Cherewyk K.A., Paterson M.J., Bodaly R.A. 2009. Changes in methyl mercury concentrations in zooplankton from four experimental reservoirs with differing amounts of carbon in the flooded catchments. Canadian Journal of Fisheries and Aquatic Sciences. 66(11): 1910–1919.
Haxton T., Bruch R. 2022. Acipenser fulvescens [WWW Document]. The IUCN Red List of Threatened Species.
Haxton T.J., Findlay S. 2008. Variation in lake sturgeon (Acipenser fulvescens) abundance and growth among river reaches in a large regulated river. Canadian Journal of Fisheries and Aquatic Sciences 65: 645–657
Jackson J.R., VanDeValk A.J., Brooking T.E., vanKeeken O.A., Rudstam L.G. 2002. Growth and feeding dynamics of lake sturgeon, Acipenser fulvescens, in Oneida Lake, New York: results from the first five years of a restoration program. Journal of Applied Ichthyology, 18: 439–443.
Jansen W. 2022. Mercury concentrations in Lake Sturgeon from Six River Systems in Manitoba, Canada. Environmental Toxicology Chemistry.
Jardine T.D., McGeachy S.A., Paton C.M., Savoie M., Cunjak R.A. 2003. Stable isotopes in aquatic systems: sample preparation, analysis, and interpretation. Fish Aquatic Science, 2656: 1–39.
Johnston T.A., Bodaly R.A., Mathias J.A. 1991. Predicting fish mercury levels from physical characteristics of Boreal reservoirs. Canadian Journal of Fisheries and Aquatic Sciences, 48: 1468–1475.
Johnston T.A., Lescord G.L., Quesnel M., Savage P.-L., Gunn J.M., Kidd K.A. 2022. Age, body size, growth and dietary habits: what are the key factors driving individual variability in mercury of lacustrine fishes in northern temperate lakes?, Environmental Research, 213, 113740, ISSN 0013-9351.
Kennedy T.A., Muehlbauer J.D., Yackulic C.B., Lytle D.A., Miller S.W., Dibble K.L., et al. 2016. Flow management for hydropower extirpates aquatic insects, undermining river food webs. Bioscience, 66: 561–575.
Kessel S.T., Hondorp D.W., Holbrook C.M., Boase J.C., Chiotti J.A., Thomas M.V., et al. 2018. Divergent migration within lake sturgeon (Acipenser fulvescens) populations: multiple distinct patterns exist across an unrestricted migration corridor. Journal of Animal Ecology, 87: 259–273.
Kirk J.L., Louis V.L.S. 2009. Multiyear total and methyl mercury exports from two major sub-arctic rivers draining into Hudson Bay, Canada. Environmental Science and Technology, 43: 2254–2261.
Lavoie R.A., Amyot M., Lapierre J.F. 2019. Global meta-analysis on the relationship between mercury and dissolved organic carbon in freshwater environments. Journal of Geophysical Research, Biogeosciences, 124: 1508–1523.
Lavoie R.A., Jardine T.D., Chumchal M.M., Kidd K.A., Campbell L.M. 2013. Biomagnification of mercury in aquatic food webs: A worldwide meta-analysis. Environmental Science & Technology 47(23): 13385–13394.
Leaner J.J., Mason R.P. 2004. Methylmercury uptake and distribution kinetics in sheepshead minnows, cyprinodon variegatus, after exposure to CH3Hg-spiked food. Environmental Toxicology and Chemistry 23: 2138–2146.
Lehnherr I. 2014. Methylmercury biogeochemistry: a review with special reference to Arctic aquatic ecosystems. Environmental Reviews, 22: 229–243.
Lescord G.L., Johnston T.A., Branfireun B.A., Gunn J.M. 2019. Mercury bioaccumulation in relation to changing physicochemical and ecological factors across a large and undisturbed boreal watershed. Canadian Journal of Fisheries and Aquatic Sciences, cjfas–c2018-0465.
Lescord G.L., Kidd K.A., Kirk J.L., O'Driscoll N.J., Wang X., Muir D.C.G. 2015. Factors affecting biotic mercury concentrations and biomagnification through lake food webs in the Canadian high Arctic. Science of the Total Environment, 509–510: 195–205.
Lescord G.L., Johnston T.A., Ponton D.E., Lock A., Gunn J.M., Amyot M. 2022. The speciation of arsenic (As) in muscle tissue of inland and coastal freshwater fish from a remote boreal region. Chemosphere, 308, 136140.
Malcata Martins B., O'Driscoll N.J., Mallory M.L., Canário J. 2021. A review of freshwater invertebrates as biomonitors of methylmercury: the importance of more complete physical and chemical reporting. Bulletin of Environment Contamination and Toxicology, 107: 801–808.
Mallory M.L., O'Driscoll N.J., Klapstein S., Varela J.L., Ceapa C., Stokesbury M.J. 2018. Methylmercury in tissues of Atlantic sturgeon (Acipenser oxyrhynchus) from the Saint John River, New Brunswick, Canada. Marine Pollution Bulletin, 126: 250–254.
McMahon H.M., Arciszewski T.J., Munkittrick K.R., Kidd K.A. 2020. Regional and long-term analyses of stable isotopes of fish and invertebrates show evidence of the closure of a pulp mill and the influence of additional stressors. Environmental Toxicology and Chemistry, 39: 1207–1218.
Mor J.-R., Ruhí A., Tornés E., Valcárcel H., Muñoz I., Sabater S. 2018. Dam regulation and riverine food-web structure in a Mediterranean river, Science of The Total Environment, 625, 301–310, ISSN 0048-9697.
Ni X., Yang R., Yuan W., Wang X., Chen J., Zhang G.E., et al., 2022. New insight into the source of metals in Hg deposits at the southwestern margin of the Yangtze Platform, China: evidence from mercury stable isotope compositions, Ore Geology Reviews, 149, 105089, ISSN 0169-1368.
OPG. 2023. OPG projects >Lower Mattagami River Project [WWW Document]. Available from https://www.opg.com/strengthening-the-economy/our-projects/lower-mattagami/ [accessed 18 January 2023].
Parnell A.C., Phillips D.L., Bearhop S., Semmens B.X., Ward E.J., Moore J.W., et al. 2013. Bayesian stable isotope mixing models. Environmetrics, 24(6): 387–399.
Patterson K., Johnston T., Keller B.W., Lescord G., Heerschap M., DeJong R., et al. 2020. Fish and aquatic sampling activities in the Hudson Bay Lowlands Ecozone of the Far North of Ontario: 2008-2018. Sudbury, Ontario, Canada.
Peng X., Liu F., Wang W.X. 2016. Organ-specific accumulation, transportation, and elimination of methylmercury and inorganic mercury in a low Hg accumulating fish. Environmental Toxicology and Chemistry, 35: 2074–2083.
Pollock M.S., Carr M., Kreitals N.M., Phillips I.D. 2015. Review of a species in peril: what we do not know about lake sturgeon may kill them. Environmental Reviews. 23(1): 30–43.
Ponton D.E., Lavoie R.A., Leclerc M., Bilodeau F., Planas D., Amyot M. 2021. Understanding food web mercury accumulation through trophic transfer and carbon processing along a river affected by recent run-of-river dams. Environmental Science and Technology, 55: 2949–2959.
Robson B.J., Lester R.E., Baldwin D.S., Bond N.R., Drouart R., Rolls R.J., et al., 2017. Modelling food-web mediated effects of hydrological variability and environmental flows, Water Research, 124, 108–128, ISSN 0043-1354.
Sandheinrich M.B., Drevnick P.E. 2016. Relationship among mercury concentration, growth rate, and condition of northern pike: a tautology resolved? Environmental Toxicology Chemistry, 35: 2910–2915.
Scheuhammer A., Braune B., Chan H.M., Frouin H., Krey A., Letcher R., et al. 2015. Recent progress on our understanding of the biological effects of mercury in fish and wildlife in the Canadian Arctic. Science of the Total Environment.
Smith A., Smokorowski K., Marty J., Power M. 2016. Stable isotope characterization of Rainy River, Ontario, lake sturgeon diet and trophic position. Journal of Great Lakes Research, 42: 440–447.
St. Louis V.L., Rudd J.W.M., Kelly C.A., Bodaly R.A., Paterson M.J., Beaty K.G., et al. 2004. The rise and fall of mercury methylation in an experimental reservoir. Environmental Science and Technology, 38: 1348–1358.
Threader R.W., Broussaeu C.S. 1986. Biology and management of the Lake Sturgeon in the Moose River, Ontario. North American Journal of Fisheries Management.
Vander Zanden M.J., Rasmussen J.B. 2001. Variation in δ15N and δ13C trophic fractionation: implications for aquatic food web studies. Limnology and Oceanography, 46: 2061–2066.
Walters D.M., Cross W.F., Kennedy T.A., Baxter C.V., Hall R.O., Jr., Rosi E.J. 2020. Food web controls on mercury fluxes and fate in the Colorado River, Grand Canyon. Science Advances 6, eaaz4880.
Webb M.a.H., Feist G.W., Fitzpatrick M.S., Foster E.P., Schreck C.B., Plumlee M., et al. 2006. Mercury concentrations in gonad, liver, and muscle of white sturgeon Acipenser transmontanus in the lower Columbia River. Archives of Environment Contamination and Toxicology, 50: 443–451.
Willacker J.J., Eagles-Smith C.A., Lutz M.A., Tate M.T., Lepak J.M., Ackerman J.T. 2016. Reservoirs and water management influence fish mercury concentrations in the western United States and Canada. Science of the Total Environment, 568: 739–748.
Zhang A., Lei K., Lang Q., Li Y. 2022. Identification of nitrogen sources and cycling along freshwater river to estuarine water continuum using multiple stable isotopes. Science of the Total Environment, 851: 158136.
Supplementary material
Supplementary Material 1 (DOCX / 1.38 MB).
- Download
- 1.39 MB
Information & Authors
Information
Published In
FACETS
Volume 9 • Number 1 • January 2024
Pages: 1 - 13
Editor: Christine Madliger
History
Received: 24 August 2023
Accepted: 23 April 2024
Version of record online: 23 August 2024
Notes
This paper is part of a collection entitled Progress and Priorities for the Recovery of Aquatic Species at Risk in Canada.
Copyright
© 2024 Authors Lescord, Simard, Seguin, Farrell, O'Driscoll, and O'Connor, and The Crown. This work is licensed under a Creative Commons Attribution 4.0 International License (CC BY 4.0), which permits unrestricted use, distribution, and reproduction in any medium, provided the original author(s) and source are credited.
Data Availability Statement
All data collected herein are co-owned between Moose Cree First Nation and the Wildlife Conservation Society Canada. All data inquiries should be sent to both [email protected] and [email protected]. For additional information and inquiries, see https://www.moosecree.com/contact/ and https://www.wcscanada.org/contact.aspx. The lead author may also be contacted for more information (current address: University of Florida, Gainesville, FL, USA; [email protected]).
Key Words
Sections
Subjects
Plain Language Summary
Impact of Hydroelectric Facilities on Namew in the Moose Cree Homeland: A Study of Mercury Levels and Dietary Changes
Authors
Author Contributions
Conceptualization: GLL, JS, TAJ, JS, CEF, NJO, CMO
Data curation: GLL, JS, TAJ, JS, CEF, NJO, CMO
Formal analysis: GLL, TAJ, CEF
Funding acquisition: GLL, JS, TAJ, CMO
Investigation: GLL, JS, TAJ, JS, CEF, CMO
Methodology: GLL, JS, TAJ, JS, CEF, NJO, CMO
Project administration: GLL, JS, CMO
Resources: GLL, JS, TAJ, JS, CEF, NJO, CMO
Supervision: CMO
Visualization: GLL
Writing – original draft: GLL
Writing – review & editing: GLL, JS, TAJ, JS, CEF, NJO, CMO
Competing Interests
The authors declare there are no competing interests.
Funding Information
Canadian Department of Fisheries and Oceans (DFO)
Friends of the Environment
Metrics & Citations
Metrics
Other Metrics
Citations
Cite As
Gretchen L. Lescord, Jennifer Simard, Thomas A. Johnston, Jacob Seguin, Claire E. Farrell, Nelson J. O'Driscoll, and Constance M. O'Connor. 2024. The long-term effects of water resource development on blood mercury levels and the trophic ecology of Namew (lake sturgeon, Acipenser fulvescens). FACETS.
9: 1-13.
https://doi.org/10.1139/facets-2023-0151
Export Citations
If you have the appropriate software installed, you can download article citation data to the citation manager of your choice. Simply select your manager software from the list below and click Download.
There are no citations for this item