A pilot bioavailable strontium isotope baseline map of Southern British Columbia, Canada
Abstract
Introduction
The strontium cycle
Strontium isotopes and provenience
Strontium mapping methods
Why strontium in BC
Materials and methods
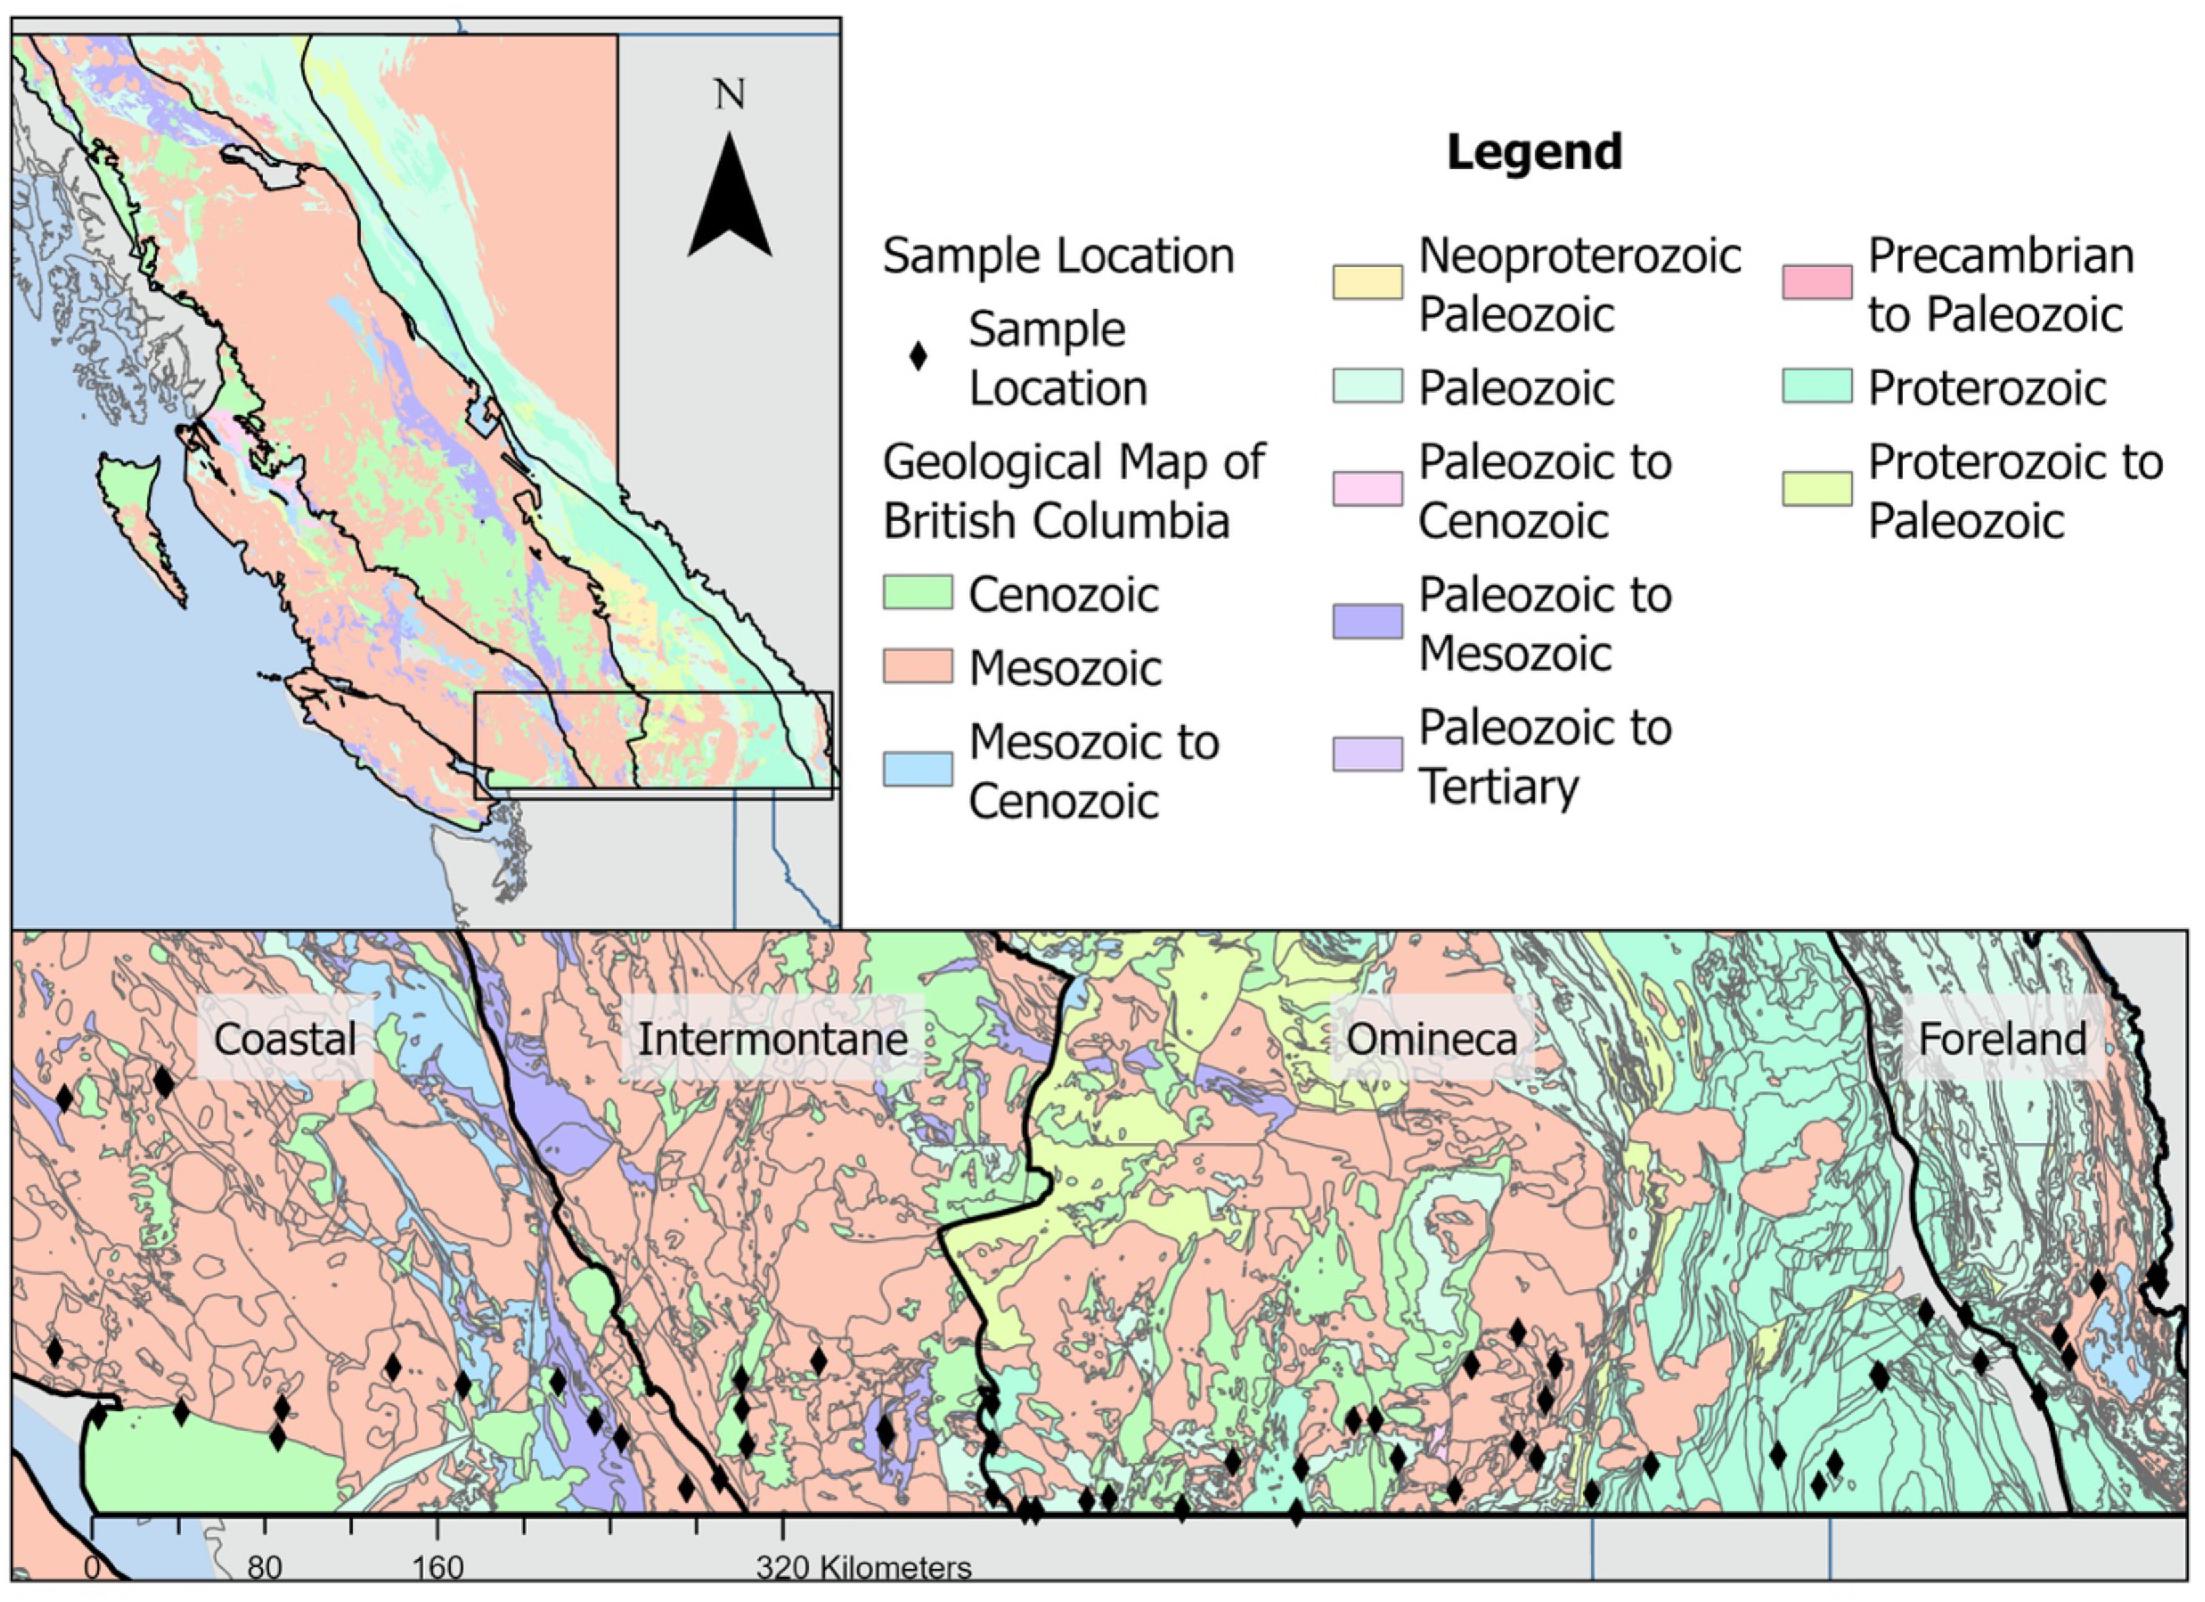
Sampling locations and British Columbia’s geologic history
Coastal belt
Intermontane belt
Omineca
Foreland
Sample preparation and strontium isotope analysis
Statistical analysis
| Sample | Belt | Rock class | Rock description | Era |
|---|---|---|---|---|
| BC-M-1 | Coast | Intrusive | Granodioritic intrusive rocks | Cenozoic |
| BC-M-2 | Coast | Volcanic | Malfic Basalt Volcanic Rocks | Paleozoic to Mesozoic |
| BC-M-3 | Coast | Sedimentary | Undivided sedimentary rocks; basaltic volcanic rocks; granodioritic intrusive rocks; | Paleozoic to Mesozoic |
| BC-M-4 | Coast | Sedimentary | Undivided sedimentary rocks | Mesozoic |
| BC-M-5 | Coast | Sedimentary | Coarse clastic sedimentary rocks; tonalite intrusive rocks | Mesozoic |
| BC-M-21 | Coast | Volcanic | Malfic Basalt Volcanic Rocks | Paleozoic to Mesozoic |
| BC-M-57 | Coast | Volcanic | Andesitic volcanic rocks | Mesozoic |
| BC-M-58 | Coast | Intrusive | Quartz dioritic intrusive rocks | Mesozoic |
| BC-M-59 | Coast | Sedimentary | Undivided sedimentary rocks | Cenozoic |
| BC-M-60 | Coast | Sedimentary | Marine sedimentary and volcanic rocks | Mesozoic |
| BC-M-61 | Coast | Sedimentary | Marine sedimentary and volcanic rocks | Mesozoic |
| BC-M-63 | Coast | Sedimentary | Undivided sedimentary rocks | Cenozoic |
| BC-M-64 | Coast | Intrusive | Quartz dioritic intrusive rocks | Mesozoic |
| BC-M-64RB | Coast | Intrusive | Quartz dioritic intrusive rocks | Mesozoic |
| BC-M-65 | Coast | Intrusive | Granodioritic intrusive rocks | Mesozoic |
| BC-M-66 | Coast | Sedimentary | Undivided sedimentary rocks | Cenozoic |
| WH-M-3 | Coast | Volcanic | Andesitic volcanic rocks | Mesozoic |
| WH-M-4 | Coast | Volcanic | Andesitic volcanic rocks | Mesozoic |
Note: See Supplementary material A for more information and 87Sr/86Sr ratios for samples. Open data from Cui et al. (2017).
| Sample | Belt | Rock class | Rock description | Era |
|---|---|---|---|---|
| BC-M-6 | Intermontane | Volcanic | Mafic basaltic volcanic rocks | Mesozoic |
| BC-M-7 | Intermontane | Volcanic | Andesitic volcanic rocks (locally mafic and felsic | Cenozoic |
| BC-M-8 | Intermontane | Sedimentary | Undivided sedimentary rocks; undivided volcanic rocks | Cenozoic |
| BC-M-9 | Intermontane | Intrusive | Quartz dioritic intrusive rocks | Mesozoic |
| BC-M-10 | Intermontane | Sedimentary | Chert, siliceous argillite, siliciclastic rocks | Paleozoic to Mesozoic |
| BC-M-11 | Intermontane | Sedimentary | Chert, siliceous argillite, siliciclastic rocks; marine sedimentary and volcanic rocks | Paleozoic to Mesozoic |
| BC-M-12 | Intermontane | Sedimentary | Chert, siliceous argillite, siliciclastic rocks | Paleozoic to Mesozoic |
| BC-M-13 | Intermontane | Sedimentary | Chert, siliceous argillite, siliciclastic rocks | Paleozoic to Mesozoic |
| BC-M-15 | Intermontane | Intrusive | Granodioritic intrusive rocks; greenstone, greenschist metamorphic rocks | Mesozoic |
Note: See Supplementary material A for more information and 87Sr/86Sr ratios for samples. Open data from Cui et al. (2017).
| Sample | Belt | Rock class | Rock description | Era |
|---|---|---|---|---|
| BC-M-17 | Omineca | Intrusive | Granite, alkali feldspar granite intrusive rocks | Mesozoic |
| BC-M-18 | Omineca | Intrusive | Granite, alkali feldspar granite intrusive rocks | Mesozoic |
| BC-M-19 | Omineca | Metamorphic | Greenstone, greenschist metamorphic rocks | Paleozoic |
| BC-M-20 | Omineca | Sedimentary | Mudstone, siltstone, shale fine clastic sedimentary rocks; syenitic to monzonitic intrusive | Cenozoic |
| BC-M-22 | Omineca | Volcanic | Undivided volcanic rocks | Cenozoic |
| BC-M-23 | Omineca | Volcanic | Undivided volcanic rocks; undivided sedimentary rocks | Cenozoic |
| BC-M-24 | Omineca | Metamorphic | Paragneiss metamorphic rocks | Proterozoic |
| BC-M-25 | Omineca | Intrusive | Granite, alkali feldspar granite intrusive rocks | Mesozoic |
| BC-M-26 | Omineca | Intrusive | Granite, alkali feldspar granite intrusive rocks | Mesozoic |
| BC-M-27 B | Omineca | Intrusive | Syenitic to monzonitic intrusive rocks | Cenozoic |
| BC-M-28 B | Omineca | Intrusive | Syenitic to monzonitic intrusive rocks | Cenozoic |
| BC-M-29 | Omineca | Sedimentary | Mudstone, siltstone, shale fine clastic sedimentary rocks; basaltic volcanic rocks | Mesozoic |
| BC-M-30 | Omineca | Intrusive | Granite, alkali feldspar granite intrusive rocks | Mesozoic |
| BC-M-31 | Omineca | Sedimentary | Dolomitic carbonate rocks; argillite, greywacke, wacke, conglomerate turbidites | Proterozoic |
| BC-M-32 | Omineca | Sedimentary | Limestone, slate, siltstone, argillite | Paleozoic |
| BC-M-39 B | Omineca | Sedimentary | Argillite, greywacke, wacke, conglomerate turbidites | Proterozoic |
| BC-M-40 | Omineca | Sedimentary | Dolomitic carbonate rocks; argillite, greywacke, wacke, conglomerate turbidites | Proterozoic |
| BC-M-41 | Omineca | Sedimentary | Argillite, greywacke, wacke, conglomerate turbidites | Proterozoic |
| BC-M-42 | Omineca | Sedimentary | Argillite, greywacke, wacke, conglomerate turbidites | Proterozoic |
| BC-M-43 | Omineca | Sedimentary | Argillite, greywacke, wacke, conglomerate turbidites | Proterozoic |
| BC-M-45 | Omineca | Sedimentary | Argillite, greywacke, wacke, conglomerate turbidites | Proterozoic |
| BC-M-46 | Omineca | Sedimentary | Quartzite, quartz arenite sedimentary rocks; granodioritic intrusive rocks | Proterozoic |
| BC-M-47 | Omineca | Volcanic | Basaltic volcanic rocks; feldspar porphyritic intrusive rocks (mafic) | Mesozoic |
| BC-M-48 | Omineca | Sedimentary | Limestone, slate, siltstone, argillite | Mesozoic |
| BC-M-49 | Omineca | Intrusive | Granodioritic intrusive rocks | Mesozoic |
| BC-M-50 | Omineca | Volcanic | Basaltic volcanic rocks (mafic) | Mesozoic |
| BC-M-51 | Omineca | Intrusive | Granodioritic intrusive rocks; limestone, slate, siltstone, argillite | Mesozoic |
| BC-M-52 | Omineca | Metamorphic | Paragneiss metamorphic rocks | Proterozoic |
| BC-M-53 | Omineca | Metamorphic | Paragneiss metamorphic rocks | Proterozoic |
| BC-M-27 A | Omineca | Intrusive | Syenitic to monzonitic intrusive rocks | Cenozoic |
| BC-M-28 A | Omineca | Intrusive | Syenitic to monzonitic intrusive rocks | Cenozoic |
| BC-M-39 A | Omineca | Sedimentary | Argillite, greywacke, wacke, conglomerate turbidites | Proterozoic |
Note: See Supplementary material A for more information and 87Sr/86Sr ratios for samples. Open data from Cui et al. (2017).
| Sample | Belt | Rock class | Rock description | Era |
|---|---|---|---|---|
| BC-M-33 | Foreland | Sedimentary | Undivided sedimentary rocks | Proterozoic |
| BC-M-34 | Foreland | Sedimentary | Undivided sedimentary rocks | Mesozoic |
| BC-M-35 | Foreland | Sedimentary | Undivided sedimentary rocks | Mesozoic |
| BC-M-36 | Foreland | Sedimentary | Undivided sedimentary rocks; mudstone, siltstone, shale fine clastic sedimentary rocks | Mesozoic |
| BC-M-37 | Foreland | Sedimentary | Dolmitic carbonate rocks; dolmitic carbonate rocks; mudstone, siltstone, shale fine clastic sedimentary rocks | Paleozoic |
| BC-M-38 | Foreland | Sedimentary | Proterozoic | |
| AB-M-1 | Foreland | Sedimentary | Paleozoic | |
| AB-M-2 | Foreland | Sedimentary | Paleozoic |
Note: See Supplementary material A for more information and 87Sr/86Sr ratios for samples. Open data from Cui et al. (2017).
| Variables | Description | Source |
|---|---|---|
| r.meanage | GLiM age attribute (Myrs) | Hartmann and Moosdorf (2012) |
| r.salt | Salt deposition (kg.ha −1.yr −1) | Vet et al. (2014) |
| r.distance | Distance from the ocean (km) | Bataille et al. (2021) |
| r.volc | Volcanic deposition | Brahney et al. (2015) |
Results and discussion
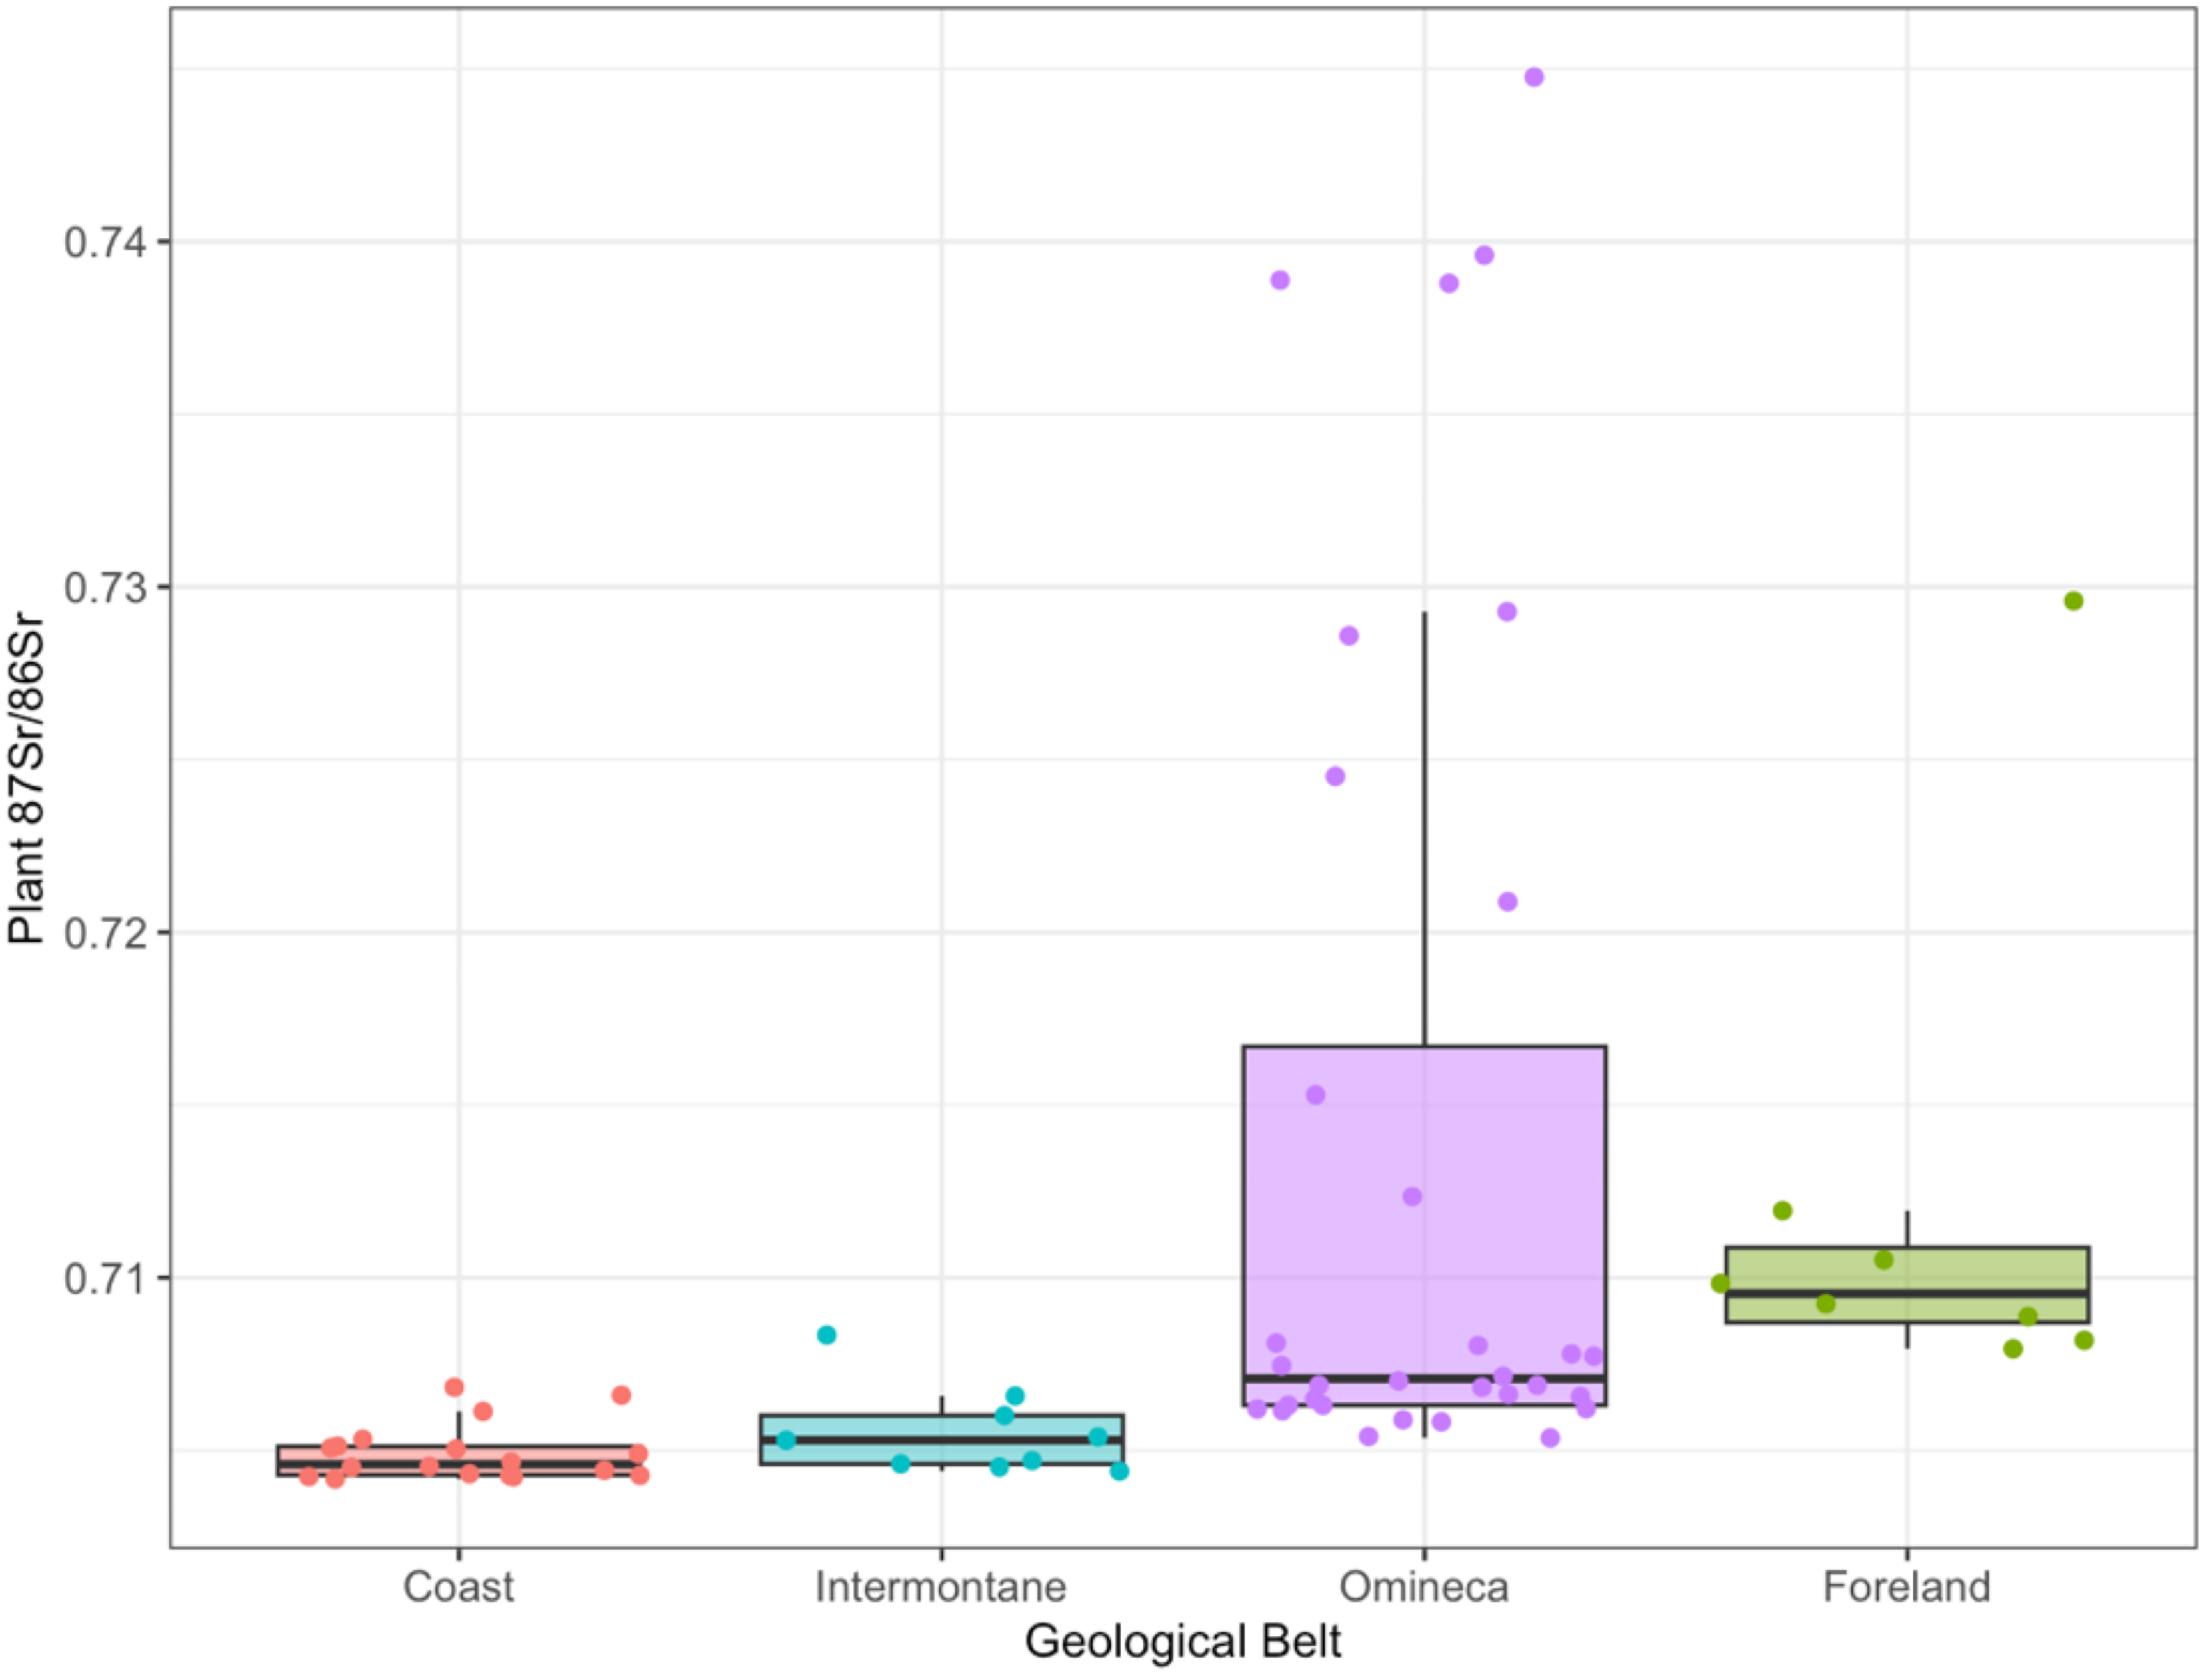
Descriptive statistics
| Belt | n | Mean | ± | Minimum | Median | Maximum |
|---|---|---|---|---|---|---|
| All | 67 | 0.71007 | 0.00002 | 0.70417 | 0.70655 | 0.74475 |
| Coastal | 18 | 0.70492 | 0.00002 | 0.70417 | 0.70460 | 0.70683 |
| Intermontane | 9 | 0.70553 | 0.00002 | 0.70440 | 0.70529 | 0.70834 |
| Omineca | 32 | 0.71375 | 0.00001 | 0.70531 | 0.70707 | 0.74475 |
| Foreland | 8 | 0.71201 | 0.00002 | 0.70794 | 0.70953 | 0.72959 |
| Geological belt | Coast | Foreland | Intermontane |
|---|---|---|---|
| Foreland | 7.7e-6 | – | – |
| Intermontane | 0.7863 | 0.0020 | – |
| Omineca | 1.2e-8 | 0.4894 | 0.0024 |
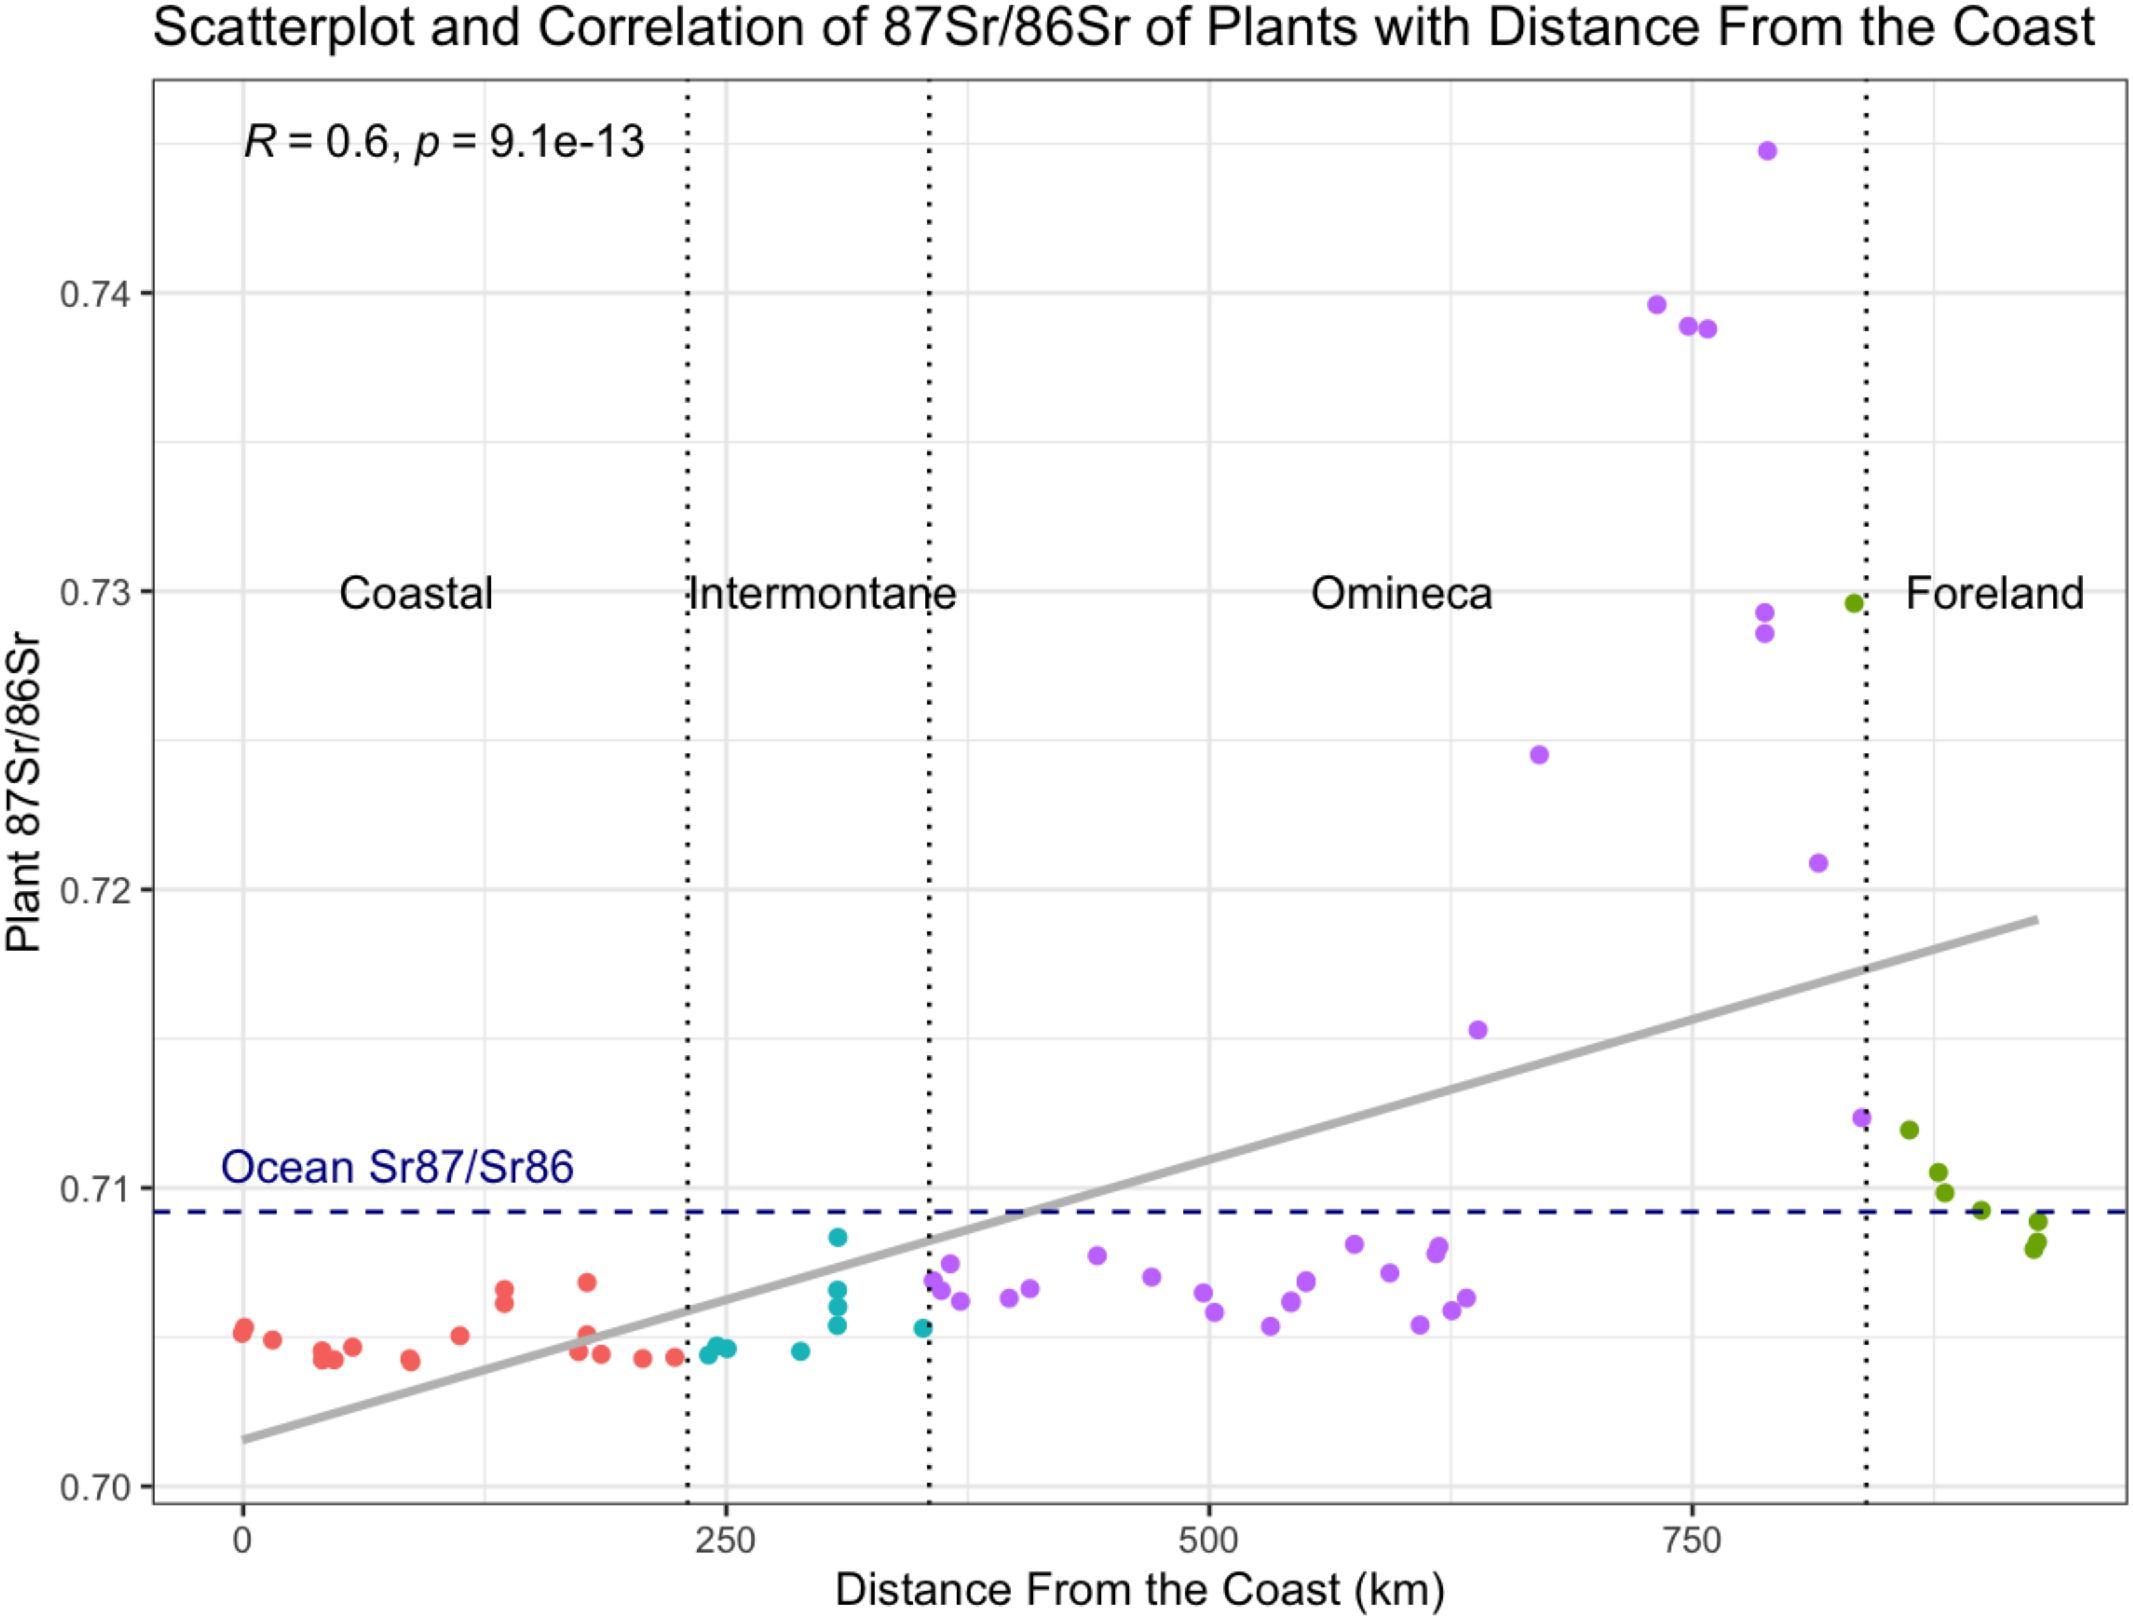
Relationships with salt deposition, distance from the ocean, and mean age of lithology
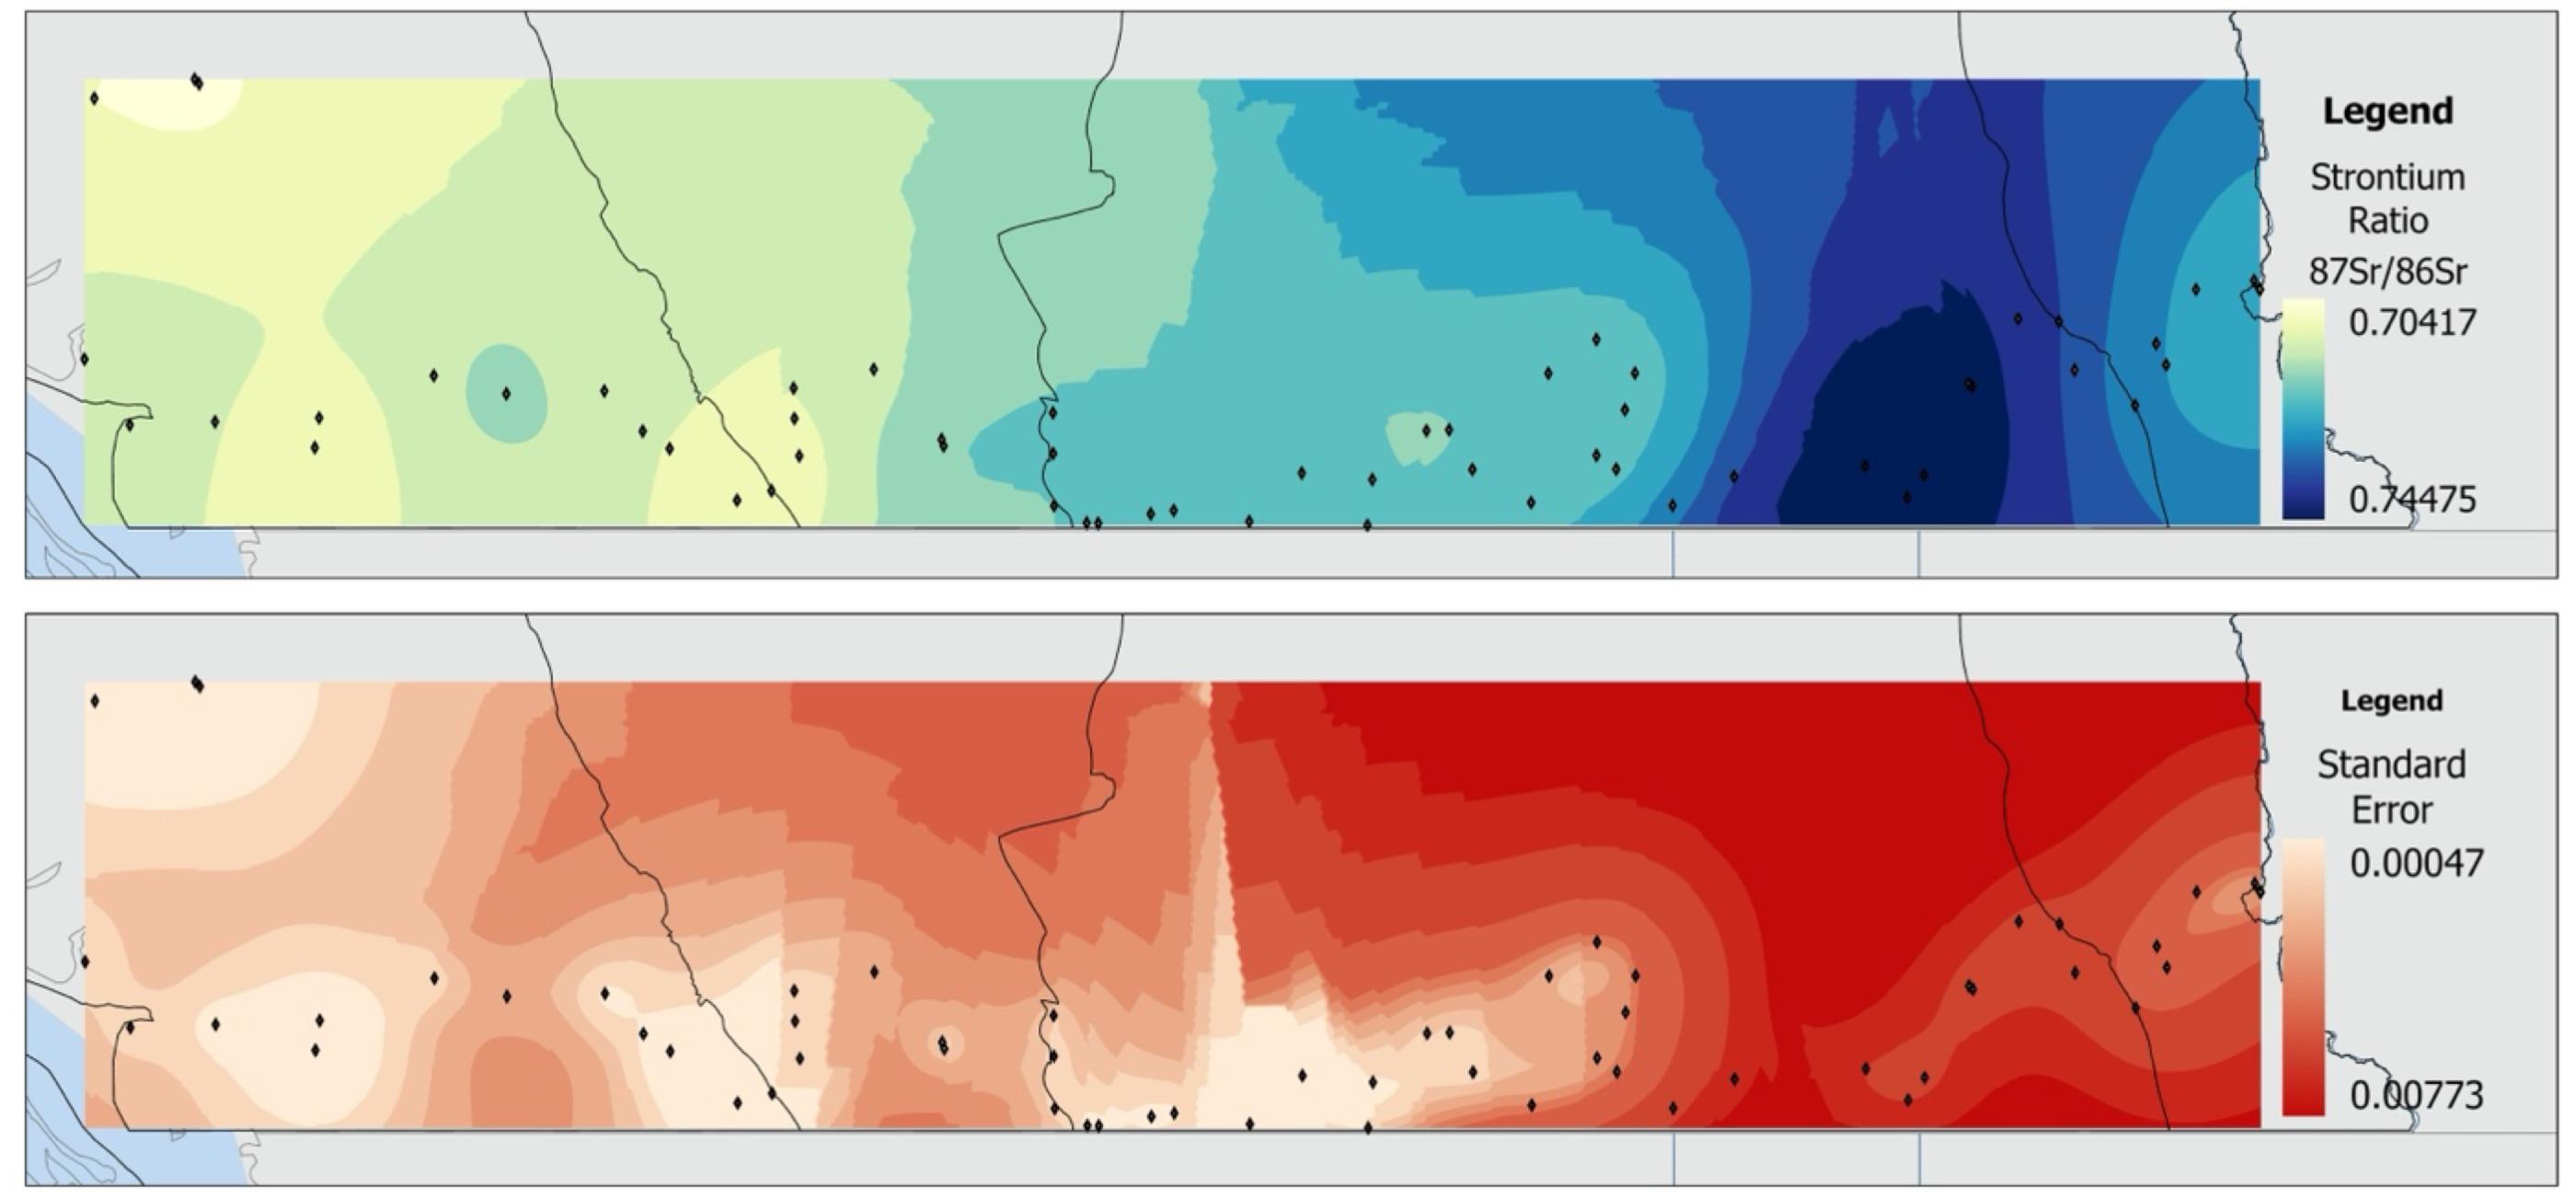
Isoscape
Conclusion
Acknowledgements
References
Supplementary material
- Download
- 21.07 KB
- Download
- 313.46 KB
- Download
- 6.59 KB
Information & Authors
Information
Published In

History
Copyright
Data Availability Statement
Key Words
Sections
Subjects
Plain Language Summary
Authors
Author Contributions
Competing Interests
Funding Information
Metrics & Citations
Metrics
Other Metrics
Citations
Cite As
Export Citations
If you have the appropriate software installed, you can download article citation data to the citation manager of your choice. Simply select your manager software from the list below and click Download.
There are no citations for this item