Drivers of high rates of carbon burial in a riverine-influenced freshwater marsh in the Long Point Walsingham Priority Place of southern Ontario
Abstract
Reported rates of soil organic carbon (SOC) accumulation in wetlands are markedly higher over recent versus longer timescales, caused by SOC losses through decomposition, paleoenvironmental changes, and recent increases in sedimentation or biomass production. Explaining changes in SOC sequestration rates and determining the time horizon over which high rates are sustained are both critical for accurately measuring the potential for wetland conservation as a natural climate solution. Here, we present analyses on a 4-m core from a riverine-influenced marsh in Big Creek watershed, southern Ontario, to track changes in SOC accumulation regimes. Since wetland initiation ∼5700 years ago, mean long-term (pre-industrial) rates of SOC accumulation were 24 g C m−2 year−1, and recent rates up to four times higher. We demonstrate that elevated recent rates of SOC accumulation are largely explained by more labile carbon in surficial soils, and are sustained for less than a century before transitioning to slower burial rates of predominantly recalcitrant organic matter. However, there are exceptions to this trend, such as when labile SOC was buried intermittently during Holocene Lake Erie highstands. Our research underscores the importance of organic matter type and hydroclimatic context in predicting long-term potential for marsh soils to stabilize atmospheric carbon.
Introduction
There is a need for improved quantifications of soil carbon dynamics because of the potential for the soil carbon pool to help mitigate or amplify anthropogenic-induced global warming. However, soil carbon accumulation in the terrestrial biosphere remains challenging to quantify due to high spatial and temporal variability (Archer 2010; Ciais et al. 2014). Wetland soils are recognized as a significant carbon pool with potential to take up or release enough carbon to influence the global climate while simultaneously supporting biodiversity and cultural value (Heimann and Reichmann 2008; Petrescu et al. 2015; Dinerstein et al. 2020; Pyke et al. 2021). Yet, the overall size of wetland soil carbon stocks and their vulnerabilities to disturbance remain poorly constrained (Kolka et al. 2018).
Freshwater marshes are a broad group of wetlands characterized by emergent, soft-stemmed herbaceous vegetation with the capacity to tolerate saturated soils and dynamic hydrological conditions. These marshes are prevalent in the temperate region and have been widely drained and converted to agricultural use (Zoltai 1988; Reddy and Delaune 2008; Mitsch and Gosselink 2015). While freshwater marsh soils are generally classified as mineral soils with low organic matter content, freshwater marshes support significant organic carbon burial over decades, centuries, and millennia, and can contain peat horizons (Loder and Finkelstein 2020). Estimates of recent rates of soil organic carbon (SOC) accumulation in upper sediments of freshwater marshes in temperate North America typically exceed 150 g C m−2 year−1 (Loder and Finkelstein 2020; Creed et al. 2022). However, available data extending over century to millennial timescales suggest that these rates are not sustained, and eventually decline as some carbon is lost (Loder and Finkelstein 2020). While the causes of declines in SOC accumulation rates over time vary by wetland type and context, they are necessary to understand to accurately model and predict future wetland carbon balances.
In some coastal wetlands for example, high recent rates of carbon accumulation have been linked to sea level rise (e.g., McTigue et al. 2019; Rogers et al. 2019; Gore et al. 2024). Elsewhere, increases in biomass production due to eutrophication or the arrival of invasive wetland emergent plants lead to increased rates of SOC accumulation in surficial soils (Bansal et al. 2019; Spivak et al. 2019; Peteet et al. 2020; Gailis et al. 2021). In northern peatlands, it is well established that long-term rates of carbon accumulation are lower than recent rates because of SOC losses over time due to decomposition (e.g., Clymo 1984), but that extrinsic factors (e.g., climatic changes, wildfire, hydrological change, and human activity) can influence both rates (e.g., Packalen and Finkelstein 2014; Marrs et al. 2019; Young et al. 2019). For freshwater marshes, further work is needed to determine how intrinsic (e.g., organic matter lability and long-term decay) and extrinsic factors (e.g., increases in sediment fluxes and hydrological changes) affect recent versus long-term rates of SOC accumulation; this is necessary to ensure that rates accurately capture the strengths of natural carbon sinks. Otherwise, assuming that recent rates are sustained over the long-term may result in the overestimation of the strengths of natural carbon sinks and lead to negative outcomes including overly generous emission offsets (Bridgham et al. 2014; Neubauer 2014; Young et al. 2019; Gore et al. 2024).
Freshwater marshes bury and preserve autochthonous (in situ) and allochthonous (ex situ) organic carbon derived from the surrounding watershed due to their variable hydrological regimes (Bridgham et al. 2006; Drexler 2011; Van de Broek et al. 2018). Consequently, carbon accounting in freshwater marshes has additional complexities, as there are multiple pathways from which carbon is derived and deposited over time. Thus the carbon stock in marsh soils may not solely reflect in situ production of organic matter (Bridgham et al. 2006). Furthermore, freshwater marsh soils can contain both organic and inorganic carbon (Mitsch and Gosselink 2015). Although inorganic carbon fractions can be negligible, carbonate burial may be significant in ecosystems where allochthonous sources of carbonate (e.g., coral reefs and lithogenic sources) are present (Martin 2017; Saderne et al. 2019; Mueller et al. 2023) and needs to be differentiated from organic carbon burial for carbon accounting purposes.
This study focusses on long-term carbon accumulation in a riparian freshwater marsh, which formed in the Middle Holocene following lake level shifts induced by glacial isostasy in the lower Laurentian Great Lakes region. The objectives of this study were to characterize SOC accumulation regimes since wetland establishment, and to evaluate factors leading to elevated recent versus long-term rates of carbon accumulation. To address these objectives, we used radiometric dating, elemental analyses, programmed pyrolysis, and carbon to nitrogen (C/N) ratios.
Materials and methods
Study site
Central Big Creek Marsh (42.65°N, 80.54°W) is an undrained freshwater marsh situated on modern alluvial deposits on the floodplain of Big Creek in Norfolk County, southern Ontario (Fig. 1). Norfolk County is on the traditional lands of the Attawandaron, Haudenosaunee and the Anishinaabe First Nations, and encompassed within the Treaty lands (“Between the Lakes Purchase”) of the Mississaugas of the Credit. The site is located approximately 8 km from the Lake Erie shoreline and about 2 m above the mean annual level of Lake Erie (∼174 m asl; NOAA 2022); the water table fluctuates intra- and inter-annually, and is estimated to vary between 50 cm above and below ground surface. At present day, the site supports predominantly monotypic stands of Reed Canary Grass (Phalaris arundinacea) and other emergent marsh plants including Schoenoplectus tabernaemontani, Sparganium eurycorpum, and Nuphar lutea, with Lemna spp. in pools of standing water. Surrounding ecotypes encompass thicket swamp and upland Carolinian forest (Fig. 1). The climate is temperate with daily mean temperatures of 21.1 °C in July and −5.4 °C in January, and annual precipitation of 1036 mm (Delhi, ON, 1981–2010; Environment and Climate Change Canada 2021). The bedrock in the Big Creek watershed consists of limestone carbonates; these are overlain by modern and older alluvium around the Big Creek channel, and by carbonate-rich till and glaciolacustrine deposits of clay, sand, and silt deposited during the most recent glaciation (Barnett 1993).
Fig. 1.
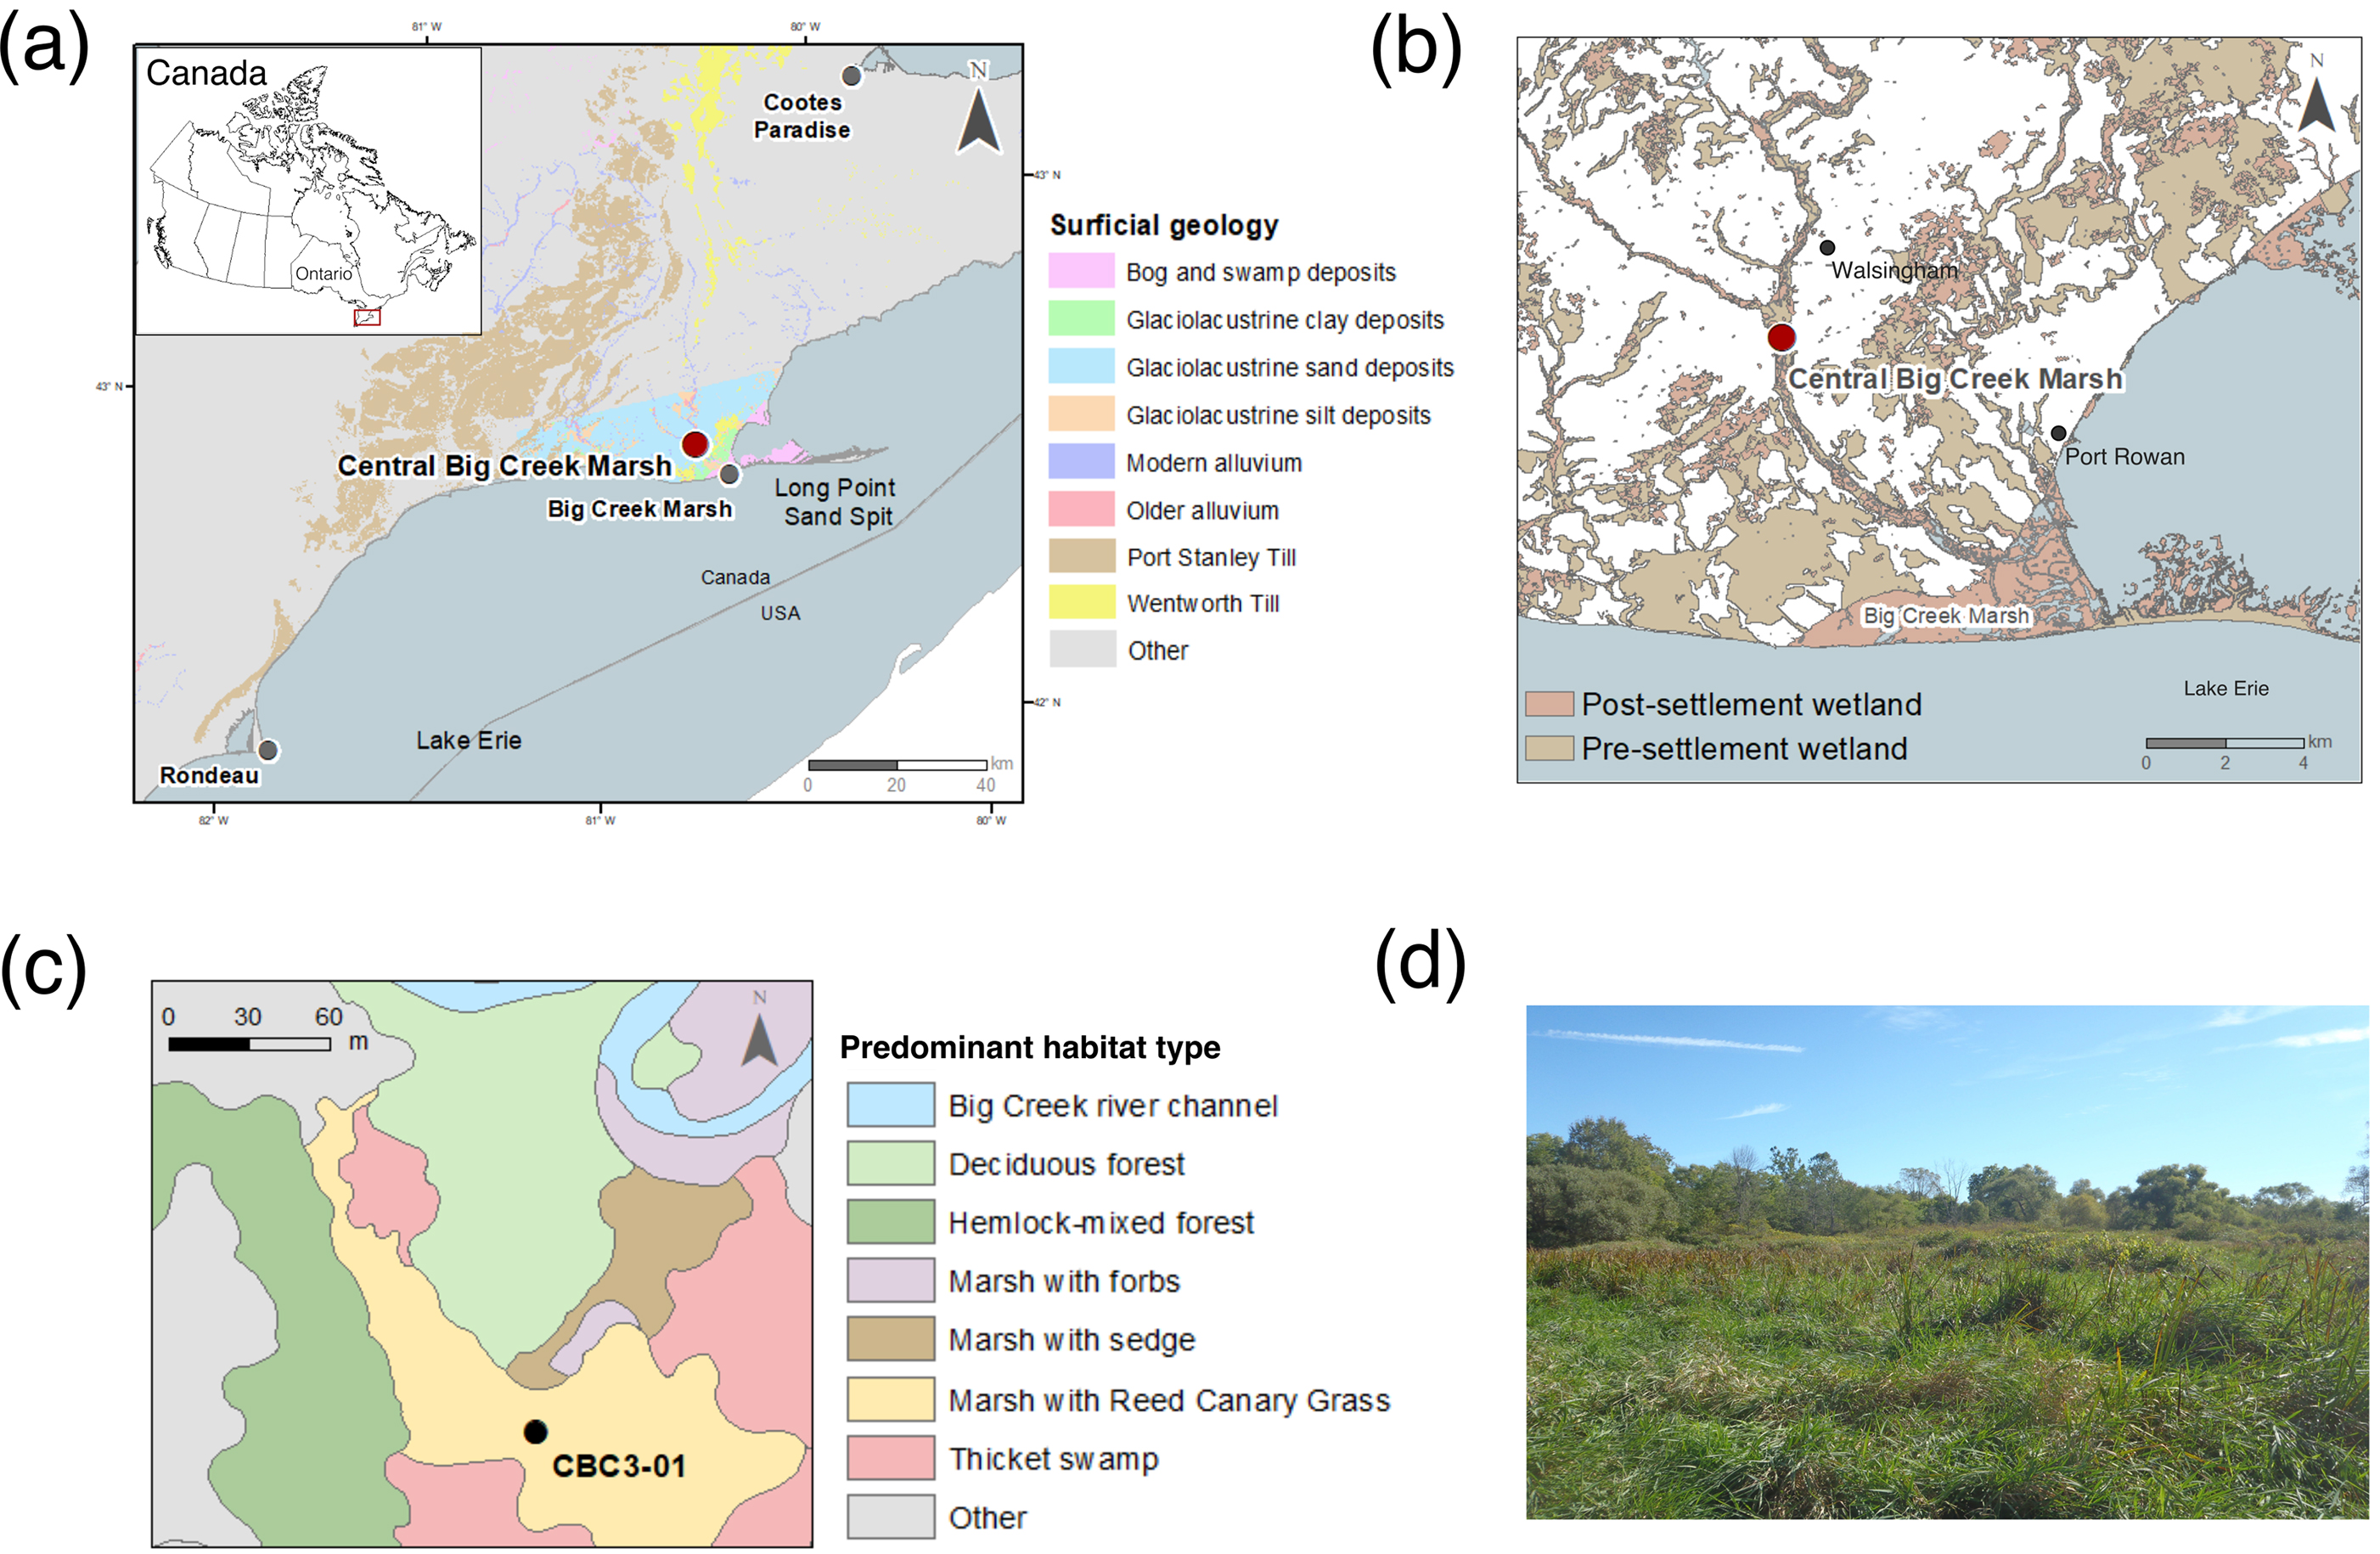
In the coastal zone adjacent to Lake Erie, long-term fluctuations of lake levels caused by differential glacial isostatic adjustment have had a strong influence on wetland development over the post-glacial (Coakley and Lewis 1985; Pengelly et al. 1997; Bunting and Warner 1998; Finkelstein and Davis 2006). During the Middle Holocene, a two-pulsed event related to outlet incision and drainage from the upper to lower Great Lakes caused water levels in Lake Erie to rapidly rise and decline by several meters (termed the Nipissing highstands; Coakley and Lewis 1985; Finkelstein and Davis 2006). Based on a series of regional paleorecords, the first of these highstands known as Nipissing I resulted in a rapid increase in water level ∼5960 calibrated years B.P. (hereafter cal. year B.P.), and was followed by a decline ∼5200 cal. year B.P. Nipissing II was a subsequent increase in water level which reached a maximum ∼4480 cal. year B.P. and dropped ∼3770 cal. year B.P. (Lewis et al. 2012). Water levels in Lake Erie have since fluctuated at a lower magnitude (i.e., 1–2 m) over the past 3000 cal. year B.P. (Coakley and Lewis 1985; Pengelly et al. 1997; Finkelstein and Davis 2006; Lewis et al. 2012). Periods of high and low water stands in Lake Erie during and following the Nipissing events affected water levels in the coastal marshes (Finkelstein and Davis 2006), also causing inundation and lower water table levels in low-lying upstream riverine-influenced marshes. Thus, these events had potential to promote or reduce local production and preservation of organic matter, as well as inputs of minerogenic materials, and to ultimately affect sedimentation and carbon accumulation in marsh soils (Van de Broek et al. 2016, 2018).
Based on soil maps, topographic, hydrological data, and land cover information, marsh and swamp habitat were extensive in Norfolk County prior to European settlement and 82% of wetlands have since been lost in this region (Snell 1987; Ducks Unlimited Canada 2010; Byun et al. 2018; Fig. 1). During the Holocene, widespread marshland had established across the Big Creek watershed (Fig. 1) due to low-lying topography, the low permeability of glaciolacustrine deposits and riverine influence (Byun et al. 2018). Europeans arrived in Norfolk County during the mid-17th century, and significant land clearance for agriculture and industrial activities took place by 1850 AD (Chapman and Putnam 1984; Dakin and Skibicki 1994). Large-scale deforestation, drainage and intensive landscape alterations have continued into the 20th century, primarily in support of agricultural development, which has resulted in massive increases in rates of erosion (Dakin and Skibicki 1994; Bunting et al. 1997; Riley 2013).
Sampling
A 430-cm sediment core (CBC3-01) was recovered from Central Big Creek Marsh in October 2019 using a Russian peat corer of barrel length 50 cm (Eijkelkamp Soil and Water, Giesbeek, the Netherlands) to minimize compaction. Surface vegetation, including root and rhizome material, was removed prior to soil collection. We sampled to refusal depth where wetland sediments transitioned to underlying coarse-grained mineral sediments of glacio-lacustrine or glacio-fluvial origin which are not characteristic of a wetland environment. Like other marsh cores (e.g., Drexler et al. 2009; Peteet et al. 2020), we did not observe sediment compaction upon examining the soil cores. Standing water was not present at the time of sampling. Core samples were stored in plastic split tubes, kept in the dark and refrigerated at 4 °C in the University of Toronto Paleoecology Laboratory until sub-sectioning began. The CBC3-01 sediment core was subsampled at contiguous 2-cm intervals. Samples of 6.28 cm3 from every subsection were dried and weighed to constant mass for bulk density measurements.
Radiocarbon, Ambrosia Chronostratigraphy, and 210Pb dating
Radiocarbon dates were obtained from wood samples (N = 9) and plant macrofossils (N = 1; Table 1). Samples were washed with reverse-osmosis water, dried at ∼60 °C to constant mass, and sent to the A.E. Lalonde AMS Laboratory (Ottawa, Ontario, Canada) for radiocarbon dating via accelerator mass spectrometry (AMS). An age-depth model was developed for CBC3-01 at 1 cm increments using Bayesian age-depth modelling in rbacon for R (Version 3.6.3; Goring et al. 2012) to infer rates of vertical accretion (hereafter rates of accretion) accounting for both inorganic and organic sediments. Ages were calibrated using OxCal 4.4 (Bronk Ramsey 2009) with the IntCal20 calibration curve (Reimer et al. 2020), and are expressed as calendar years B.P. in relation to 1950 AD.
Table 1.
| Depth (cm) | Material dated | 14C age (year B.P.) | Calibrated age 2σ (year B.P.) | Median age (year B.P.) | Lab number |
|---|---|---|---|---|---|
| 52–54 | Wood | 145 ± 26 | 281–170 (40 %) 154–126 (10 %) 120–56 (27 %) 47 (19 %) | 140 | UOC-12338 |
| 78–80 | Wood | 463 ± 26 | 537–491 (95 %) | 510 | UOC-15387 |
| 98–100 | Wood | 506 ± 25 | 549–506 (95 %) | 530 | UOC-14899 |
| 126–128 | Wood | 1844 ± 26 | 1826–1704 (95 %) | 1750 | UOC-12339 |
| 216–218 | Wood | 3603 ± 26 | 3976–3844 (95 %) | 3910 | UOC-12340 |
| 270–272 | Wood | 4140 ± 25 | 4823–4745 (31 %) 4734–4572 (65 %) 4538–4535 (<1 %) | 4690 | UOC-12341 |
| 286–288 | Wood | 4301 ± 27 | 4960–4929 (9 %) 4912–4899 (2 %) 4887–4830 (85 %) | 4860 | UOC-12342 |
| 384–386 | Twig | 4692 ± 23 | 5477–5435 (25 %) 5422–5321 (70 %) | 5380 | UOC-12343 |
| 400–402 | Plant macrofossil | 4634 ± 26 | 5462–5375(74 %) 5358–5346 (3 %) 5333–5308 (19 %) | 5410 | UOC-13435 |
| 426–429 | Wood pieces | 4991 ± 27 | 5884–5825 (14 %) 5754–5650 (73 %) 5631–5604 (8 %) | 5710 | UOC-13436 |
Note: Dates were calibrated using OxCal 4.4 with the IntCal20 calibration curve (Bronk Ramsey 2009; Reimer et al. 2020).
Ages for the upper 50 cm of the core were estimated using the Ambrosia pollen rise. Ambrosia pollen grains were counted every 5 cm on average through the CBC3-01 core. A marked rise in Ambrosia pollen is widely interpreted as a signal for widespread land clearance associated with intensification of European settlement (McAndrews and Boyko-Diakonow 1989; Pederson et al. 2005; St. Jacques et al. 2008). Samples were processed for pollen counts using standard acid digestion and sieving (Faegri and Iversen 1989). Pollen grains were identified on a transmitted-light microscope at 400x using the pollen key of (McAndrews et al. 1973). Ambrosia pollen grains were reported as percentages of all palynomorphs.
Lead-210 (210Pb) dating was attempted on the upper sediments. A chronology was developed for the upper 20 cm of the core following measurement by alpha spectroscopy of 210Pb and 226Ra activities in a series of dried, homogenized samples from the core top to a depth of 75 cm. Supported 210Pb activities were inferred by examining 226Ra activities and unsupported 210Pb activities were determined by subtracting the supported 210Pb activities from the total 210Pb activities. Total 210Pb activity was measured via 210Po by alpha spectrometry and supported 210Pb activity (in secular equilibrium with Ra-226) was determined by 222Rn emanation. These analyses were performed by Flett Research Laboratories (Winnipeg, Manitoba).
Elemental analyses and programmed pyrolysis
Dried material from every second 2 cm increment of CBC3-01 was ground to fine powder using a ball mill for elemental analyses and programmed pyrolysis. The first allocation was analyzed for total carbon and total nitrogen (TN; ∼400 mg ground sample) using a LECO CHN628 elemental analyzer in the Radiochronology Laboratory at the Centre for Northern Studies at Université Laval. The second allocation was used for programmed pyrolysis (∼70 mg ground sample) using HAWK TOC analyzer at the Geological Survey of Canada (Calgary, Alberta, Canada) to measure total organic carbon (TOC) content and inorganic carbon (in carbonates), and to characterize organic matter type. Programmed pyrolysis was originally developed for petroleum exploration (LaFargue et al. 1998; Behar et al. 2001), but is also applied to surficial soils for characterizing organic matter, discerning lability, and differentiating organic versus inorganic carbon fractions (Carrie et al. 2012; Hare et al. 2014; Galloway et al. 2018; Kemp et al. 2019). Programmed pyrolysis was selected as it measures the thermal stability of soil organic matter in marsh soils, allowing direct evaluation of the role of organic matter lability in differentiating recent versus long-term rates of organic carbon accumulation. Programmed pyrolysis measures different organic matter fractions, and their thermal stabilities and potential for decomposition (Soucémarianadin et al. 2018; Kanari et al. 2022; Zhang et al. 2023), making it an ideal method to evaluate the effects of organic carbon lability on recent- versus long-term rates of carbon burial in freshwater marsh soils. Spectroscopic methodologies that characterize wetland soil organic matter such as Fourier-Transform Infrared Spectroscopy identify chemical bonds of organic carbon, but were not used in this study because they do not directly quantify labile versus recalcitrant organic carbon, or inorganic carbon fractions.
During pyrolysis, soil samples were subjected to iso-temperature heat at 300 °C for 3 min to determine the total free (labile) hydrocarbon released (S1 fraction). The temperature was then progressively increased to 650 °C at a rate of 25 °C per minute to release, through thermal cracking, thermal-stable hydrocarbons and the oxygen contained in pyrolizable kerogen (S2 fraction, mg HC/g sediment, and S3 fraction, mg CO2/g sediment, respectively). Samples were then automatically transferred to the oxidation oven and heated from 300 to 850 °C with the heating rate of 20 °C per minute to measure the residual inert organic carbon (S4 fraction, mg CO and CO2/g sediment and residual carbon, weight %) and the mineral (inorganic) carbon fraction. TOC is quantified as the sum of the total quantity of organic matter released during the pyrolysis and the oxidation steps. Programmed pyrolysis measurements of TOC statistically correlate with TOC values measured using elemental analysis in other studies (Sanei et al. 2000; Marchand et al. 2003, 2008; Sanei et al. 2005; Gregorich et al. 2015; Soucémarianadin et al. 2018; Zhang et al. 2023). We applied the standard calibration for soil samples as described in Saenger et al. (2013) where TOC = 1.294 × TOCpp – 0.197 (where TOCpp is TOC measured via programmed pyrolysis). Programmed pyrolysis machine algorithms remove possible contributions from inorganic carbon (i.e., siderite or magnesite) in calculation of TOC.
The hydrogen index (HI) is the ratio of S2 to TOC and is proportional to H/C, while the oxygen index (OI) is calculated by normalizing the quantity of the pyrolizable CO2 (S3) to TOC and is proportional to the elemental O/C ratio of organic matter (Lafargue et al. 1998; Behar et al. 2001). The thermal stability of organic matter in the soil samples was examined by identifying the temperatures at which half of the pyrolizable hydrocarbon (S1 and S2) was released during pyrolysis (hereafter T50 measurements; Gregorich et al. 2015). Finally, ratios of “generative” (S1, S2, and S3) and “non-generative” (S4) organic carbon in relation to TOC were calculated to estimate the proportions of pyrolizable versus residual fractions of organic carbon down core in CBC3-01.
Carbon to nitrogen ratios have been used in lake and wetland ecosystems to determine the extent to which herbaceous (C/N < 10; attributed to herbaceous plants that are enriched in lipids and proteins) versus woody (C/N > 20; attributed to terrestrial and vascular plants that are enriched in lignin and cellulose) vegetation, or C3 versus C4 plants contribute to organic carbon preserved in bulk sediments in paleoenvironments (Kim 2003; Khan et al. 2015). Thus, we used C/N values in conjunction with programmed pyrolysis data to characterize the organic matter. Given the significance of inorganic carbon in the sediments of CBC3-01, we calculated C/N values using the ratio of TOC to TN (hereafter TOC/TN).
Organic, inorganic and total carbon densities were calculated for every 2 cm increment using the bulk density measurements and were used in conjunction with rates of accretion to calculate rates of carbon accumulation (e.g., Bao et al. 2011; Drexler 2011; Jones et al. 2014; Delaune et al. 2018). All core data are available in the Supplementary data file.
Results
Chronology and rates of sediment accretion
Basal sediments in CBC3-01 date to 5710 cal. year B.P. (Table 1) and correspond to the Lake Erie highstand of Nipissing I associated with widespread wetland initiation and marsh establishment in coastal zones of the lower Great Lakes (Finkelstein and Davis 2006; Lewis et al. 2012). Ten radiocarbon dates were obtained spanning the core from its base to an upper depth of 52 cm (Table 1; Fig. 2). The age model indicates faster rates of sediment accretion (1.0–2.2 mm/year) in the initial phase of wetland establishment, followed by a decrease (<1 mm/year) into the Late Holocene. Three dates on wood from the upper 100 cm suggest an increase in rates of sediment accretion though this upper section into the post-settlement time period. Ambrosia pollen is present at <1% between 40 and 429 cm depth, but sharply rises to 18% at 23 cm depth (Supplementary data file). We consider the sample at 39 cm, where Ambrosia pollen approaches 3% of the palynomorph assemblage, as a marker for 1850 AD. This is based on historical information provided in Dakin and Skibicki (1994), which indicates widespread and intensive land clearance for agriculture throughout the watershed, and the establishment of several saw mills on Big Creek by this time. The rbacon age model developed with the 10 radiocarbon dates and the Ambrosia rise (Fig. 2) returns an average rate of sediment accretion through the post-settlement horizon of 2.2 mm/year; this rate is elevated relative to the average pre-disturbance Holocene rate, which was 1.0 mm/year (Fig. 3).
Fig. 2.

Fig. 3.
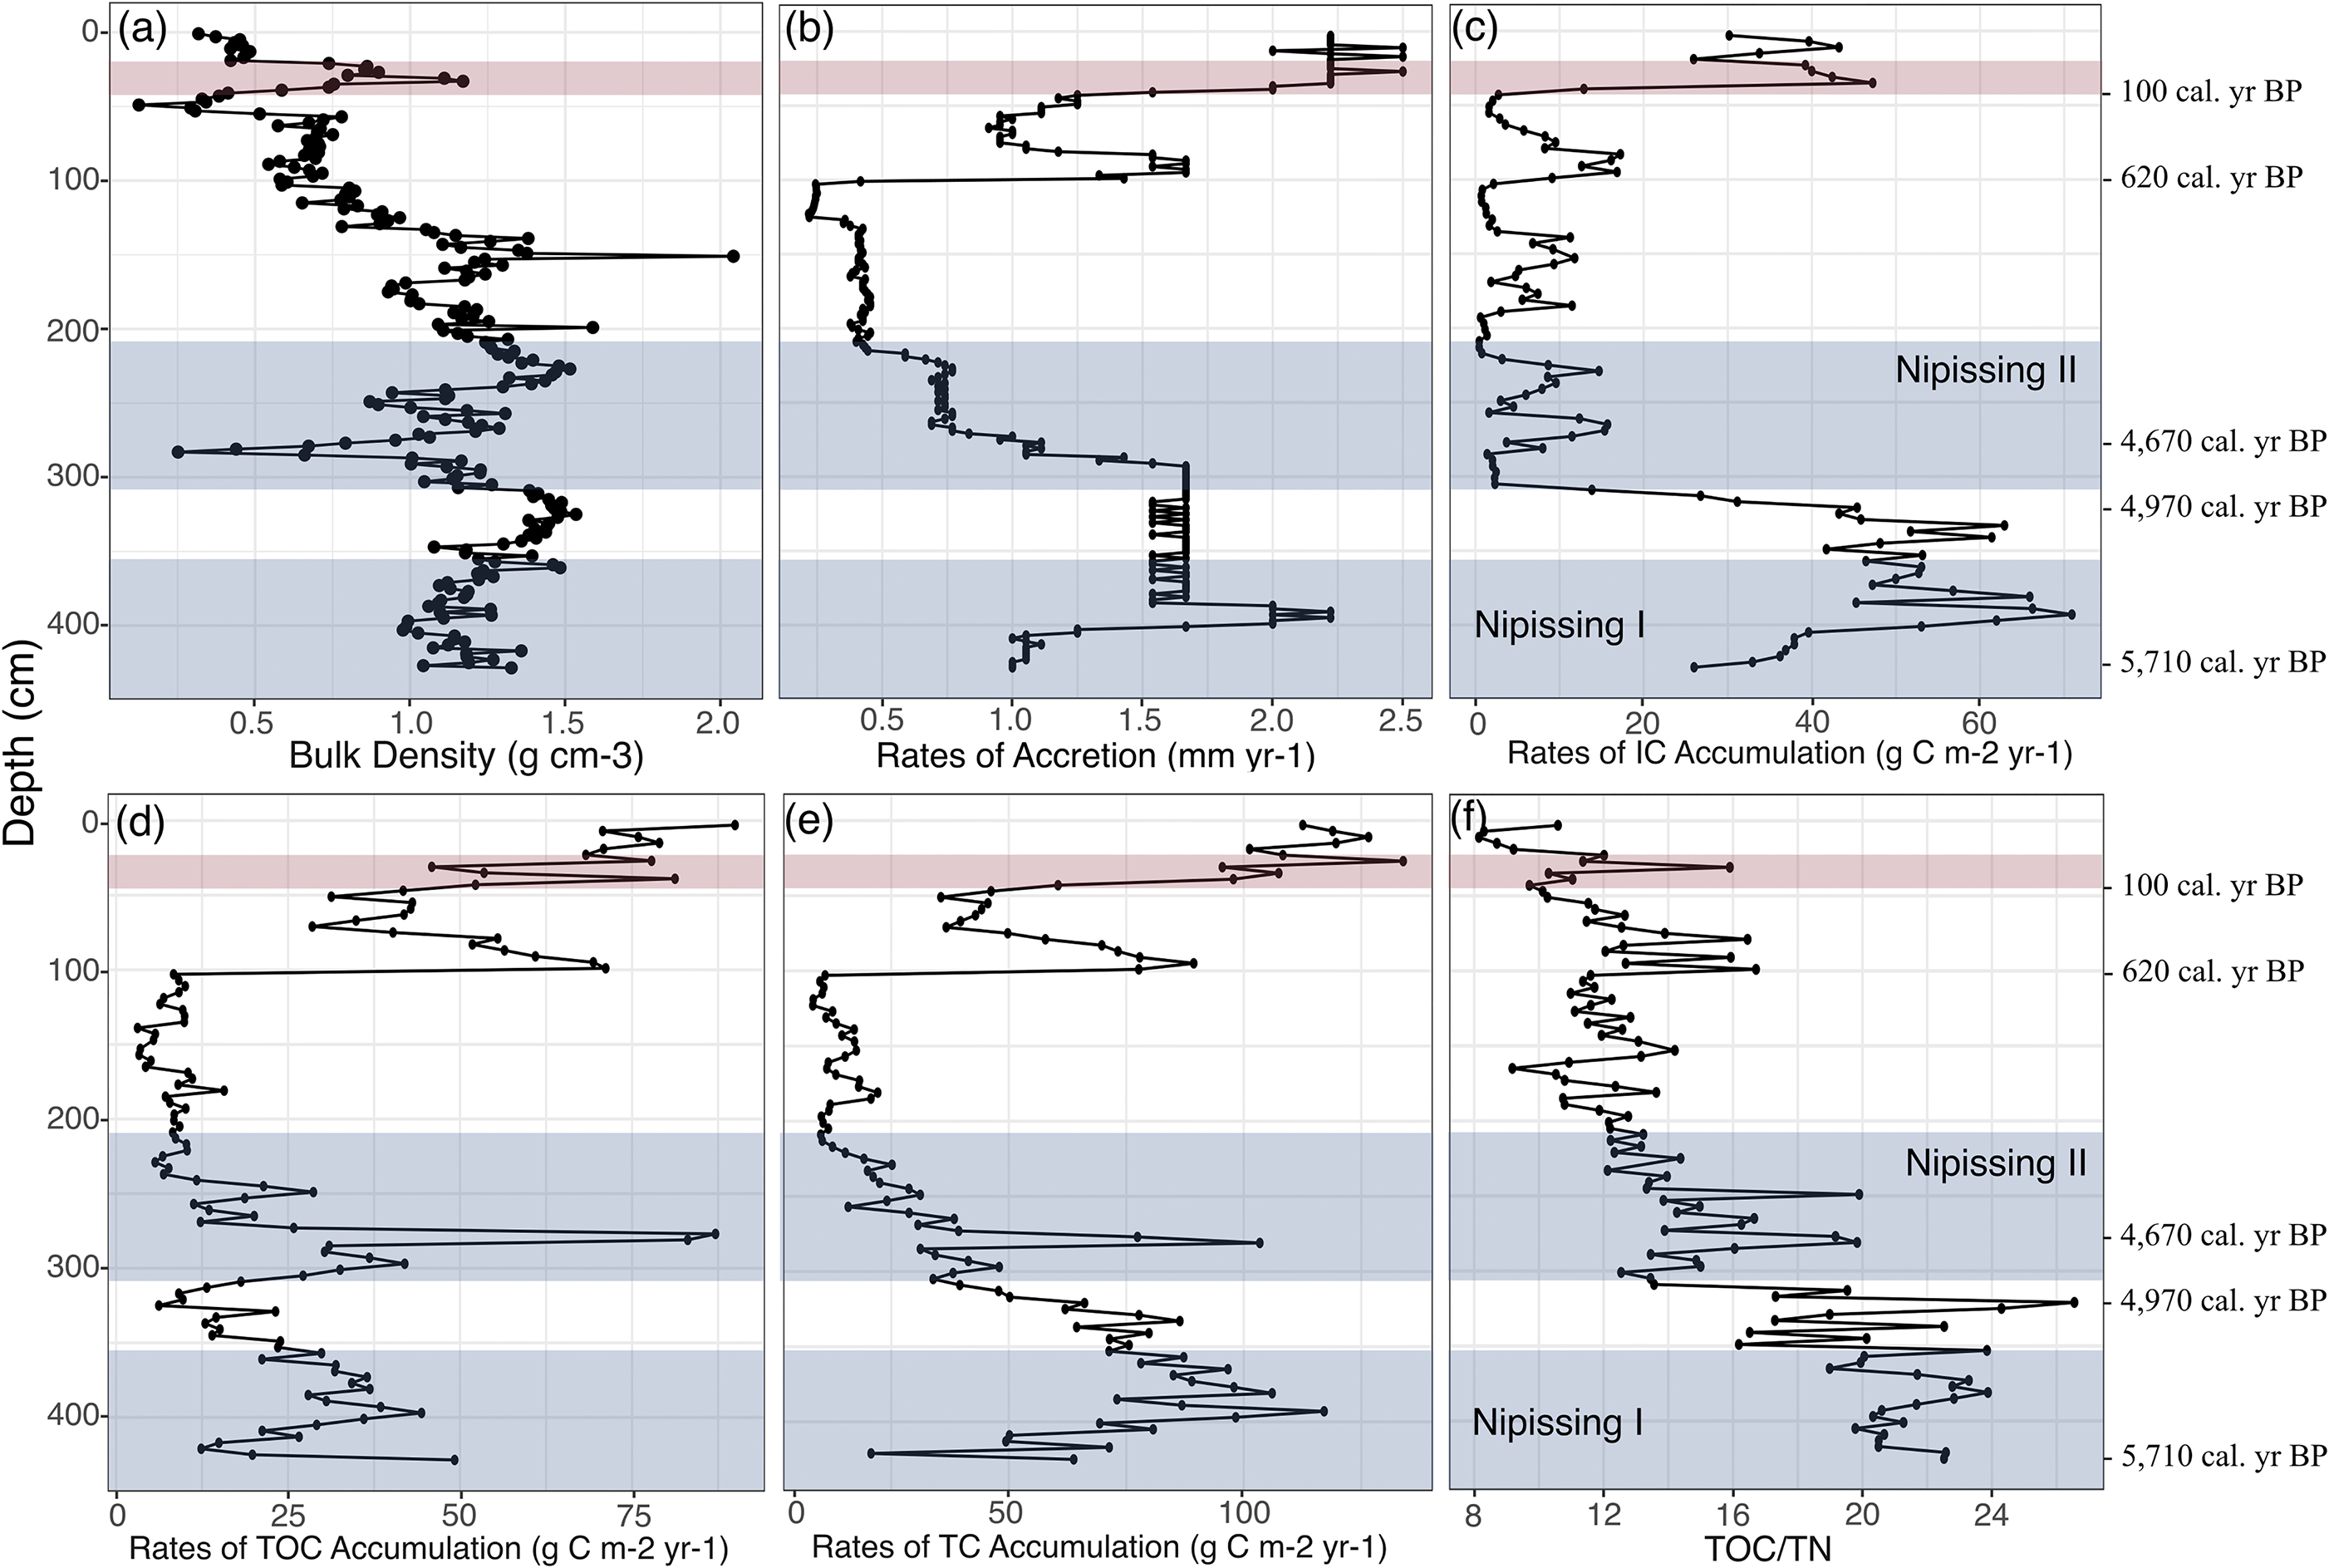
Total 210Pb activities decreases exponentially with depth from 0 cm down to 20 cm in CBC3-01, and are greater than background 210Pb estimated by 226Ra (Supplementary data file). Dry bulk density measurements vary considerably through the 20–40 cm section (Fig. 3). Total 210Pb activities in the samples below 20 cm are lower than or not significantly different than the 226Ra activities and indicate background (supported) levels. The rapid change in bulk density through the 20–40 cm section and the rapid decrease in total 210Pb activity between 18 and 22 cm depths suggest that this record does not contain the continuous 110+ years of accumulated sediment necessary to build the full 210Pb inventory required by the constant rate of supply (CRS) model used to assign ages. Therefore, we do not incorporate 210Pb ages into the calculation of accretion or carbon accumulation rates although ages were estimated for the upper 20 cm using the 210Pb activities in a linear calibration model for comparison only with the age model (details provided in the Supplementary data file). Given the disturbed nature and uncertain depositional processes associated with the top-of-core sediments (particularly in the section spanning 20–40 cm), which prevented a typical application of the CRS model used for 210Pb dating, we focus our interpretation on the radiocarbon and Ambrosia-based chronology.
Rates of carbon accumulation
Organic carbon burial has been occurring at the Central Big Creek Marsh study site since the wetland formed 5710 cal. year B.P. with an average (±standard deviation) long-term rate of organic carbon accumulation of 24 ± 17 g C m−2 year−1 prior to 1850 AD. Rates of inorganic carbon accumulation were notably high following initiation, but declined after 4970 cal. year BP. Since wetland establishment at CBC3, an areal organic carbon stock of 104 kg C m−2 has accumulated.
High rates of organic carbon accumulation were sustained during the Nipissing highstands (Fig. 3). During Nipissing I, rates of organic carbon accumulation in Central Big Creek Marsh reached 44 g C m−2 year−1 and subsequently declined. At the time of Nipissing II, a short-lived peak in organic carbon burial (87 g C m−2 year−1) occurred around 4670 cal. year B.P., which coincided with the approximate time of initiation of marshes in adjacent coastal areas of Lake Erie (e.g., Finkelstein and Davis 2006). Following Nipissing II, rates of organic carbon accumulation dropped and predominantly remained <10 g C m−2 year−1 between 4150 cal. year B.P. and 620 cal. year B.P. Rates of organic, inorganic, and total carbon accumulation increased around 620 cal. year B.P. and remained elevated until present day. Using the age model based on the radiocarbon dates and the Ambrosia pollen rise, recent rates of organic carbon accumulation ranged between 46 and 90 g C m−2 year−1 from 1850 AD until present day.
Although much more uncertain, the 210Pb chronology for the upper 20 cm of the record suggests the possibility of even higher rates of organic carbon accumulation (up to 150 g C m−2 year−1; Supplementary data file). In both age-depth models, the rates of recent carbon accumulation are several times higher than any recorded during the Middle and Late Holocene.
TOC/TN ratios
Between 5710 and 4920 cal. year B.P., TOC/TN ratios varied between 16 and 24, except for an increase to 27 at 4970 cal. year B.P. during the lowstand after Nipissing I (Fig. 3). These are the highest TOC/TN values in the CBC3-01 paleorecord and are driven by low TN contents. Since the Nipissing II and through the Late Holocene, TOC/TN ratios have fluctuated predominantly between 8 and 14. Values of TOC/TN in CBC3-01 are mostly <10 in the uppermost sediments.
Thermal stability of carbon fractions
The S1, S2, and S3 values derived from programmed pyrolysis and TOC content follow each other closely in CBC3-01 (Fig. 4). Samples are predominantly comprised of S2 thermal-stable hydrocarbons (range of 0.13–37.07 mg HC/g soil; mean [±standard deviation] equal to 6.73 ± 7.64 mg HC/g soil), with smaller proportions of S3 pyrolizable organic matter (range of 0.51–18.88 mg CO2/g soil; mean equal to 3.95 ± 3.87 mg CO2/g soil) and more minor proportions of S1 labile hydrocarbons (range of 0.02–5.46 mg HC/g soil; mean equal to 0.79 ± 1.13 mg HC/g soil).
Fig. 4.

Temperature measurements of T50 generally increase down core in CBC3-01 (Fig. 5). Between 5710 and 5120 cal. year B.P., T50 values ranged from 405 (at the basal sediments) to 435 °C. However, T50 values subsequently became highly variable, with temperatures as low as 368 °C (at 325 cm) and 395 °C (at 281 cm), until 4320 cal. year B.P. The rapid decline in T50 values at 281 cm and subsequent up-core variability matches the variability in S1 values (Fig. 5). Overall, T50 values were generally lowest (between 399 and 424 °C) in sediments deposited over the past 620 cal. year B.P.
Fig. 5.
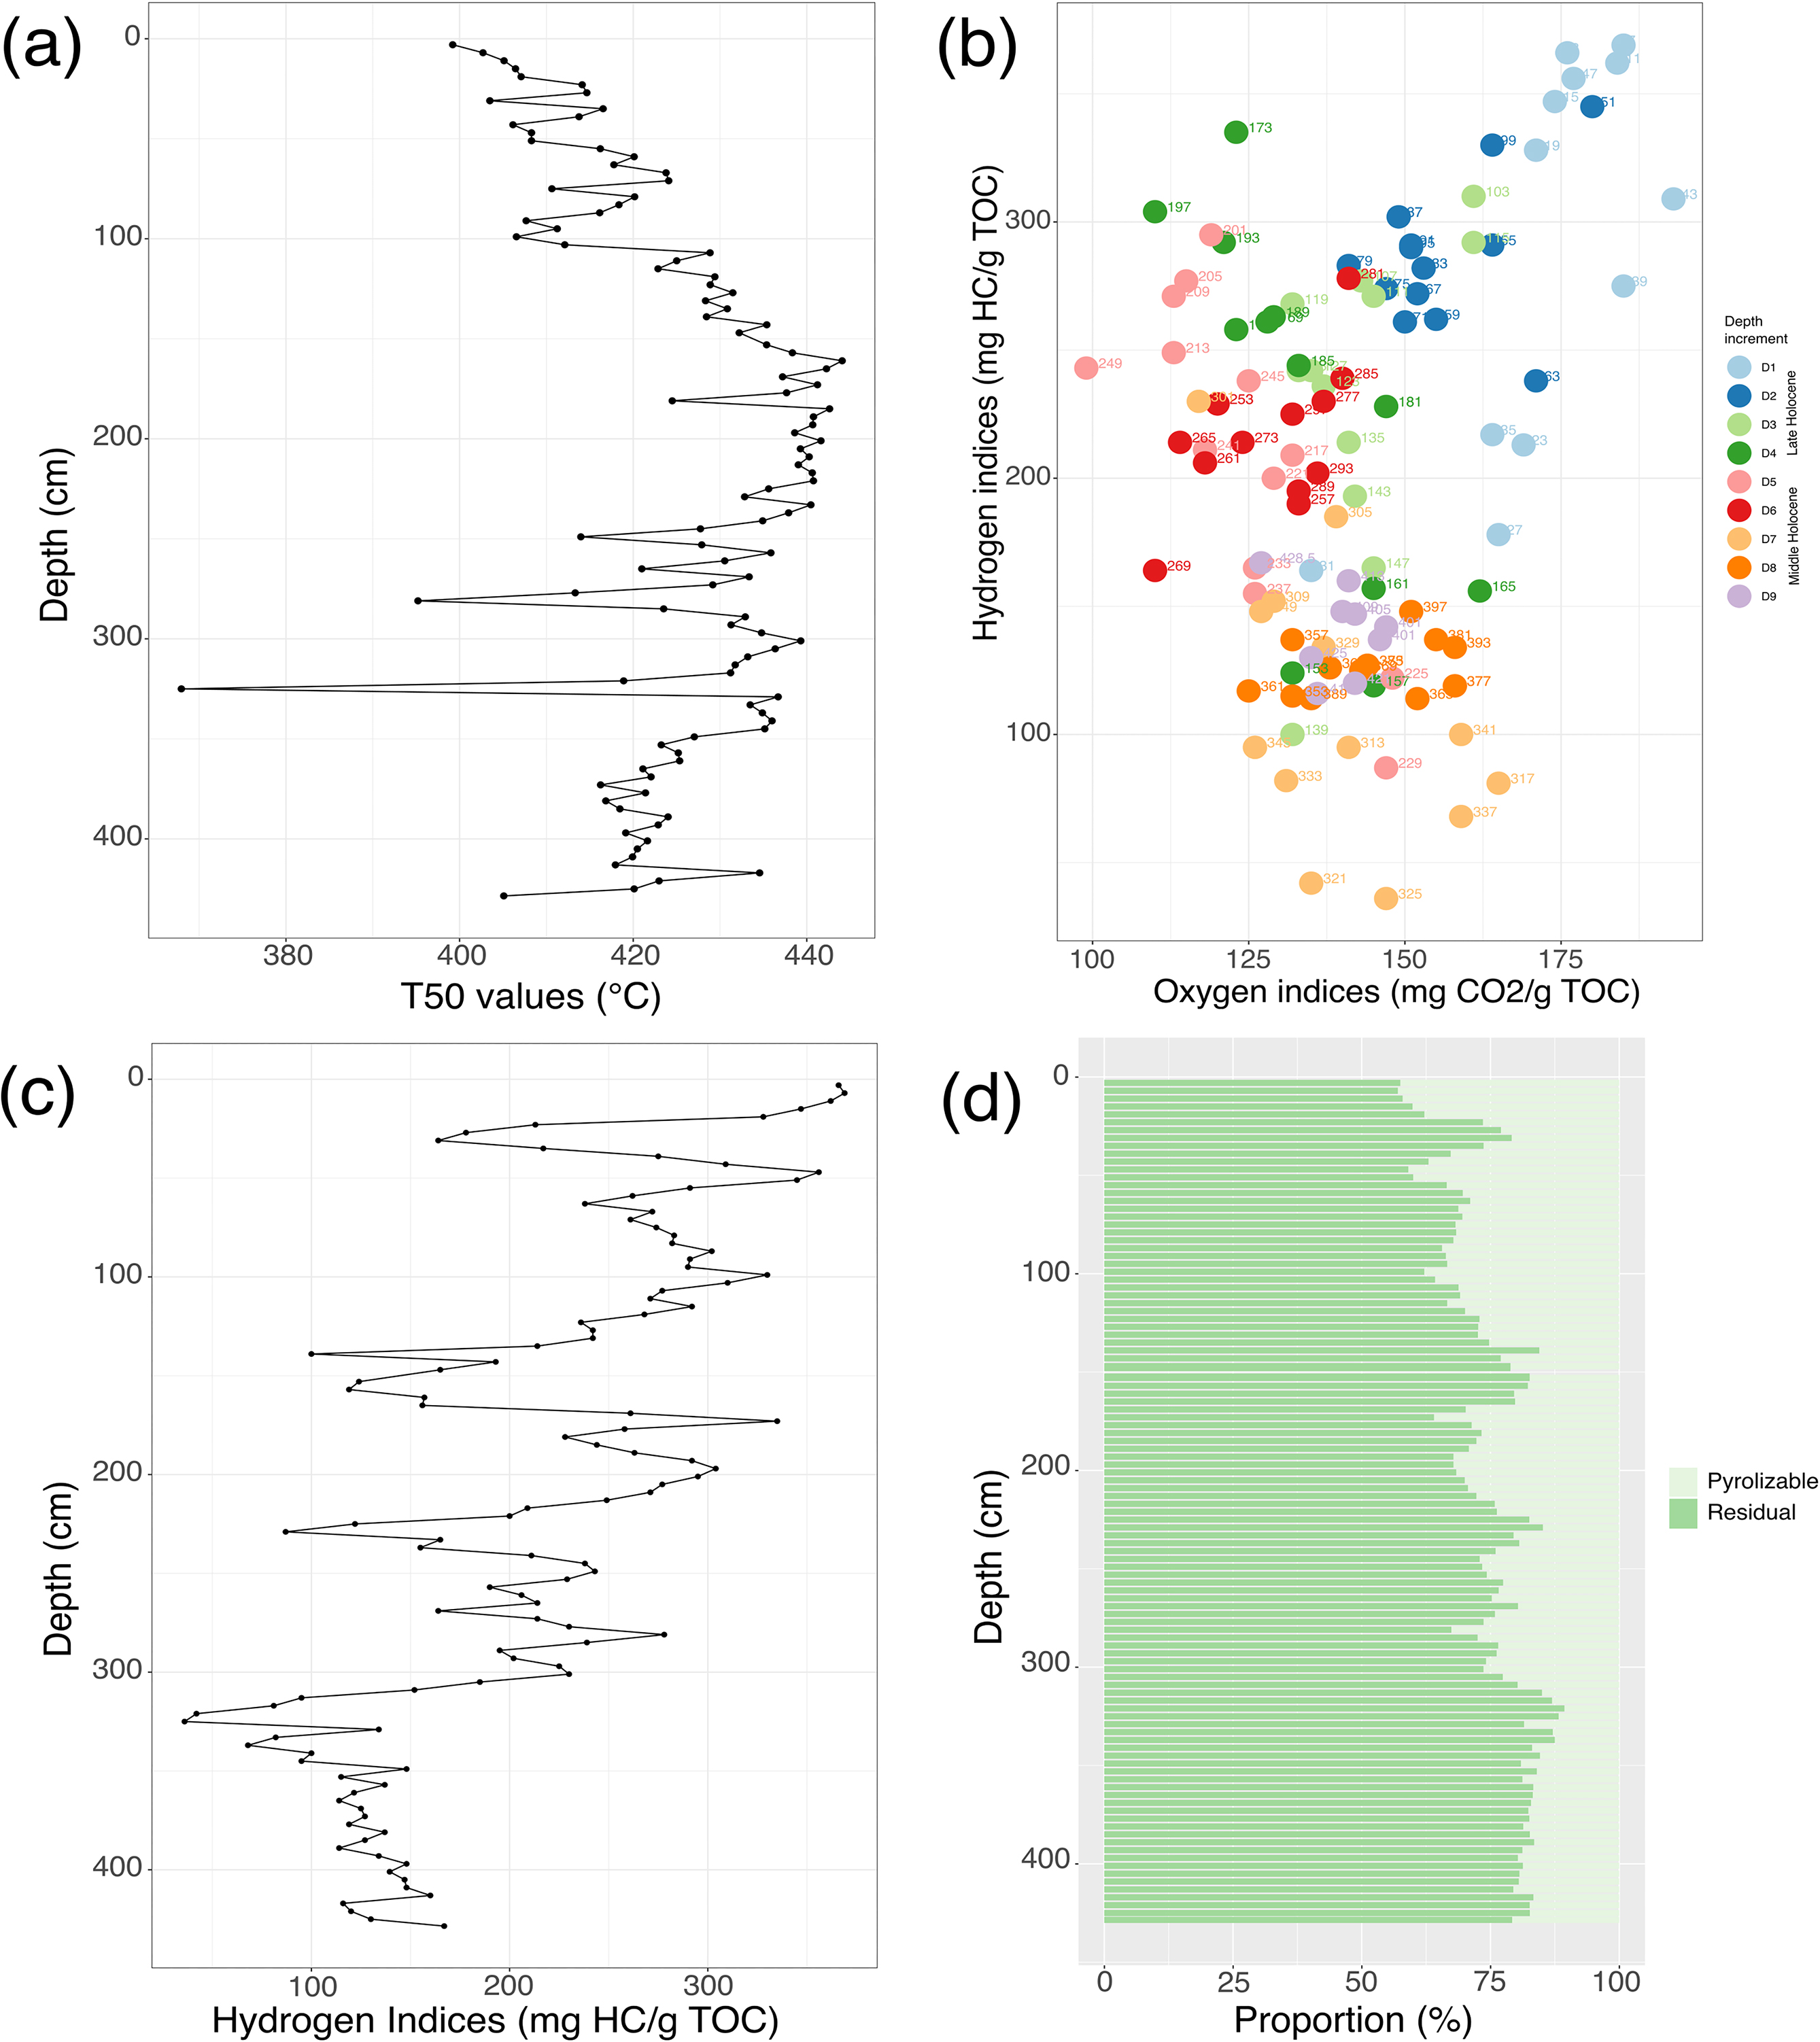
Hydrogen and oxygen indices range between 36 and 369 mg HC/g TOC and 99–193 mg CO2/g TOC, respectively, in CBC3-01 (Fig. 5). Between 5710 and 4850 cal. year B.P. (below 300 cm depth), HI values were typically low (<150 mg HC/g TOC) while OI indices ranged between 125 and 165 mg CO2/g TOC. Between 4850 and 2270 cal. year B.P., OI values were generally lower than in the Middle Holocene soils, while HI values were generally higher through the Late Holocene (top 200 cm of CBC3-01). Hydrogen indices gradually increased between 2270 and 620 cal. year B.P. and thus decrease with depth between 100 and 150 cm. Since 620 cal. year B.P., both HI and OI values were elevated. Recently-deposited sediments in the top 100 cm of CBC3-01 comprise some of the highest HI and OI values up to 369 and 193, respectively, except for disturbed samples between 20 and 40 cm that have the lowest HI values.
Pyrolizable organic carbon generally decreases with depth down core in CBC3-01, although proportions of residual versus pyrolizable organic carbon are variable throughout the paleorecord, as a function of varying paleoenvironmental conditions. The residual fraction, however, predominates overall (between 57% and 89%; Fig. 5). Following wetland initiation and during Nipissing I, the residual fraction of organic carbon was mainly >80%, but began to decline during Nipissing II and reached a minimum of 68%. Proportions of pyrolizable organic carbon have been higher (up to 43%) since 620 cal year B.P., except for lower values in the disturbed sediments between 20 and 40 cm.
Discussion
Composition and origins of organic carbon stocks
Carbon stocks below the top meter of freshwater marsh soils are more rarely considered in soil carbon inventories (Nahlik and Fennessy 2016; Kolka et al. 2018). In this study, we use a paleoenvironmental approach to demonstrate continuous burial of SOC at variable rates on decadal, centennial, and millennial scales at the CBC3 freshwater marsh site, resulting in a profile >4 m thick of both relatively inert and more labile organic carbon fractions. The total areal carbon stock of 104 kg C m−2 is several-fold greater than areal carbon stocks reported at depths <1 m for tidal saline and freshwater inland wetlands in the temperate region of North America (Nahlik and Fennessy 2016; Creed et al. 2022; Pendea et al. 2023). In this record, long-term rates of organic carbon accumulation varied in relation to changing paleoenvironmental conditions, while recent rates are at least an order of magnitude higher, as is recorded elsewhere (Neubauer 2014; Young et al. 2019; Loder and Finkelstein 2020).
Organic carbon stores in Central Big Creek Marsh are largely in the form of the “residual” or inert fraction which is resistant to pyrolysis (Fig. 5). When transported through the sedimentary environment, the residual fraction is often coupled with the mineral fraction in fluvial sediments, and consequently is physically stable and protected from further biological degradation (Mudd et al. 2009; Van de Broek et al. 2018; Repasch et al. 2021). Because the residual fraction is deposited in downstream lowlands (Repasch et al. 2021) and is suited for preservation over hundreds to thousands of years, we deduce that this fraction has a strong, positive influence on long-term rates of organic carbon accumulation in riverine-influenced freshwater marshes. Although the proportion of pyrolizable organic carbon is, nonetheless, considerable throughout the Central Big Creek Marsh paleorecord, pyrolizable carbon decreases with depth relative to the residual fraction of organic carbon, confirming that organic carbon deposits in surface sediments are less thermally stable than deeper deposits due to gradual organic carbon breakdown. We therefore conclude that recent accumulations of SOC in freshwater marshes are susceptible to and undergo biological degradation via microbial processes, and that a more resistant fraction remains with increasing depth. This corroborates the relationships observed between increased thermal stability and the loss of labile organic matter in other environments (e.g., arable versus fallow agricultural fields, surface versus buried organic matter in Arctic hummocks; Gillespie et al. 2014; Gregorich et al. 2015). Even in the absence of human impacts, recent rates are likely to be elevated relative to longer-term rates.
However, our analysis shows important exceptions to this general trend. The most labile organic carbon stores are not only present in the most recent sediments, but are also recorded at deep intervals in mineral-based wetland soils. During the Middle to Late Holocene transition, organic carbon deposits with low thermal stabilities and higher TOC/TN values were buried intermittently among more stable layers of organic carbon, notably at 325 cm (5000 cal. year B.P.), 281 cm (4710 cal. year B.P.), and 249 cm (4320 cal. year B.P.) depths (Figs. 3 and 5). The latter two depths are also characterized by high levels of the most thermolabile fraction of organic carbon (S1 and S2), demonstrating that undecomposed and highly labile material can be preserved in deeper parts of the marsh profile under the right conditions. Deeper soils, thus, cannot be discounted in carbon inventories of mineral-based freshwater marshes given their potential to comprise significant SOC stocks that can readily degrade if disturbed and exposed to oxygen through drainage or land use change.
Ratios of TOC/TN can be used to further assess organic matter quality by estimating, for example, the portion of herbaceous versus woody derived organic matter or the portion of C3 versus C4 plants (Khan et al. 2015). Using programmed pyrolysis in combination with TOC/TN, we suspect that recently deposited sediments comprise more herbaceous vegetative matter than deeper sediments (Carrie et al. 2012; Khan et al. 2015), which could reflect monotypic stands of Phalaris arundinacea in recent years. Conversely, organic matter stores from the Middle Holocene show comparatively higher TOC/TN values overall, implying organic matter sources and material derived from woody vegetation containing more recalcitrant lignin and cellulose (Reddy and Delaune 2008; Carrie et al. 2012). This portion of the organic matter deposited at the CBC3-01 site during the Middle Holocene shows strong long-term preservation in this undisturbed sediment profile.
Implications of hydroclimatic events on organic carbon burial in wetlands
The rise in Lake Erie water levels by several meters during Nipissing I caused inundation and elevated the water table in the coastal zone (Lewis et al. 2021) including at the CBC3-01 site, and ultimately triggered the formation of wetlands here and at other locations along the coast. We found three major shifts in organic carbon composition and burial in the CBC3-01 paleorecord which coincided with past hydroclimatic events. The first occurred around the time of the Nipissing I (Fig. 3) and is characterized by a marked increase in labile organic carbon and higher TOC/TN values than those of the Late Holocene. Central Big Creek Marsh is situated 2 m above lake level at present day; based on estimated rates of glacial isostatic adjustment, the core top of CBC3-01 would have been about 0.5–1 m above lake level during the Middle Holocene (Lewis et al. 2012, 2021). The lowstand of lake water levels following Nipissing I likely caused changes in fluvial regimes, and resulted in reduced inundation and decreased water table levels. Collectively, this resulted in changes in the composition and source of organic matter supplied to the sediments of Central Big Creek Marsh.
The second shift occurred at the time of Nipissing II (4670 cal. year B.P.; 277 cm depth), and is characterized by a marked increase in degradable organic carbon and rates of organic carbon accumulation. Based on regional paleoenvironment reconstructions (Lewis et al. 2012, 2021), the highstand of Nipissing II likely caused inundation, again, and raised the water table at Central Big Creek Marsh. Coupled with warmer temperatures during the Middle Holocene in southern Ontario (Finkelstein et al. 2006), these conditions would have stimulated primary productivity and organic carbon production. We also speculate that Central Big Creek Marsh served as a depositional environment during Nipissing II for rapid influxes of minerogenic sediments upon erosion and flooding from the Big Creek River channel. These minerogenic influxes can help bury and preserve in situ organic carbon by advecting organic matter to deeper sediment layers by rapid rates of accretion, and by reducing the time of exposure to diagenesis at the surface (Mudd et al. 2009; Van de Broek et al. 2016, 2018; Kemp et al. 2019; Spivak et al. 2019).
Following these highstands, there was a prolonged period between 4200 and 620 cal. year B.P. (100–240 cm depth) during which rates of organic carbon accumulation were reduced and less variable. The decline in rates of accretion after Nipissing II coincided with the drop in water levels in Lake Erie (Lewis et al. 2012). In tidal marshes, the long-term accumulation of organic carbon in soils is controlled by sediment supply and is not solely related to local biomass production (Mudd et al. 2009; Van de Broek et al. 2016, 2018). Thus, we conclude that water levels were lower and hydrological inputs reduced in the Central Big Creek Marsh site during this prolonged period, and that these conditions may have led to higher rates of decomposition and lower rates of organic carbon burial. In contrast, the Nipissing highstands in Lake Erie would have enhanced bank erosion of marsh creeks and increased the sediment supply into Central Big Creek Marsh, thereby increasing the potential for burial and preservation of organic carbon (Yu et al. 2017; Van de Broek et al. 2018; Spivak et al. 2019; Repasch et al. 2021).
Lastly, hydroclimatic conditions may have promoted higher rates of organic carbon accumulation and may have been associated with the Little Ice Age. Around 620 cal. year B.P. (100 cm depth), there was a notable increase in rates of accretion and organic carbon accumulation at Central Big Creek Marsh. Peat accumulation began around 650 cal. year B.P. at Lower Big Creek Marsh (Bunting et al. 1997) and a cluster of short paleorecords from four separate sloughs have basal ages of approximately 700 cal. year B.P. at the Rondeau Marshes (Finkelstein and Davis 2006; Fig. 1). All these events are attributed to higher water levels in eastern Lake Erie when conditions were wetter in the eastern Great Lakes region of southern Ontario (Pengelly et al. 1997; Finkelstein and Davis 2006), and collectively may have elevated water levels, rates of accretion and organic carbon accumulation in Central Big Creek Marsh at this time.
Inorganic carbon
Most studies rely only on quantifications of organic carbon or find that the inorganic carbon fraction is negligible in marsh soil samples (Loder and Finkelstein 2020). In our study, we found that both organic and inorganic fractions of carbon drive elevated rates of total carbon accumulation in this mineral-based wetland. The Big Creek watershed is underlain by glacial sediments from the Wentworth and Port Stanley tills (Fig. 1), which are rich in carbonates (mean contents of 36% and 37.0%, respectively). These tills are further underlain by limestone associated with the Dundee Formation (Barnett 1993; Lewis et al. 2012). Through erosional processes and/or water infiltration, these deposits are the major source of carbonates in the Big Creek watershed and contribute to elevated carbonate burial in Central Big Creek Marsh. Coastal ecosystems have recently been recognized for their potential to enhance carbon sequestration because local calcification processes and resultant carbon dioxide (CO2) outputs are minimal, and marine-derived carbonates may be accrued from local lithogenic sources and coral reefs, and undergo dissolution in coastal ecosystems (requiring the removal of CO2; Martin 2017; Saderne et al. 2019; Mueller et al. 2023). More research is required to determine whether carbonate burial could enhance carbon sequestration in freshwater marshes through similar processes that have been identified in marine-influenced wetlands.
Like organic carbon, rates of inorganic carbon burial in the CBC3-01 study site were also likely influenced by hydro-fluvial changes associated with the Nipissing highstands. Higher rates of inorganic carbon accumulation in the bottom 1 m of CBC3-01 are likely attributed to conditions during the Middle Holocene when temperatures were warmer and carbonate concentrations were higher in Lake Erie waters (Lewis et al. 2012). Upon the highstand of Nipissing I and formation of wetland at Central Big Creek, carbonate-rich waters likely inundated and precipitated in situ at CBC3-01 when water residence times were long enough. During Nipissing II, water that inundated Central Big Creek Marsh from Big Creek may have comprised fewer carbonates because the waters in the Lake Erie basin at that time had been transferred from the upper Great Lakes and more northern latitudes, were cooler in temperature and were diluted (Lewis et al. 2012). Alternatively, or in combination with the former, Lake Erie water and its carbonate supply may have been restricted at the mouth of the Big Creek river channel upon formation of the Long Point sand spit (Barnett et al. 1985), thereby reducing carbonate burial.
Recent versus long-term rates of organic carbon accumulation
Recent rates of organic carbon accumulation are high while long-term rates are generally slower in CBC3-01. Nonetheless, both recent and long-term rates in the Central Big Creek Marsh paleorecord are comparable to rates reported in global syntheses on organic carbon burial in salt marshes (e.g., Chmura et al. 2003; Ouyang and Lee 2014) and peatlands (e.g., Gallego-Sala et al. 2018). Furthermore, the organic carbon density of the top 1 m of soils in Central Big Creek Marsh is also comparable to the average carbon density of tidal wetland soils spanning the conterminous United States (Holmquist et al. 2018). This demonstrates that riverine-influenced freshwater marshes with high rates of vertical accretion can provide an important means for SOC storage. Losses of labile fractions over the long-term (as shown in the programmed pyrolysis results) are likely a considerable factor in causing the marked difference between recent and long-term rates of organic carbon accumulation in Central Big Creek Marsh. However, we discern that other factors are also contributing to this difference given the nonlinear variability in organic carbon composition throughout the CBC3-01 paleorecord.
In the more recent record, high rates of accretion, and organic and inorganic carbon accumulation are likely related in part to the major landscape alterations and erosional sedimentation, which has been previously documented in the Big Creek watershed (Bunting et al. 1997). Rates of accretion in Central Big Creek Marsh ranged between 0.2 and 2.2 mm year−1 (Fig. 3), which are similar to rates in other local lacustrine- or riverine-influenced marshes located on or proximal to the shores of the lower Great Lakes including Cootes Paradise (1.0–7.1 mm year−1; Finkelstein et al. 2005) and Lower Big Creek Marsh (1.8 mm year−1; Bunting et al. 1997; Fig. 1). Even when accounting for long-term stratigraphic processes in sedimentary records spanning different lengths of time (“Saddler effects”, Sadler 1981), accretion rates of alluvium (associated with erosion) across North America are shown to have increased 10-fold post-European settlement due major landscape alterations and clearance for agriculture (Kemp et al. 2020). Because subsoils composed of carbonates are increasingly exposed and eroded from landscapes that have experienced intensive farming, carbonate availability and deposition in proximate watersheds has been used as an indicator for tillage erosion (Papiernik et al. 2005; Zamanian et al. 2021). We suspect that elevated recent rates of accretion and inorganic carbon accumulation in Central Big Creek Marsh have resulted in part from increased in erosional soil losses in parts of the Big Creek watershed where intensive agricultural activity continues to take place. In addition, the invasive wetland grass Phalaris arundinacea is producing high yields of biomass in monotypic stands at the coring site in Central Big Creek Marsh and elsewhere (Galatowitsch et al. 1999; Lavergne and Molofsky 2004), and may consequently increase rates of carbon uptake and burial, as well as methane emissions, like other invasive wetland plants (e.g., Phragmites australis, Typha angustifolia, Typha × glauca; e.g., Rothman and Bouchard 2007; Bansal et al. 2019).
Conclusion
Non-tidal freshwater marshes have potential to bury and store considerable amounts of organic and inorganic carbon. We demonstrate that elevated rates of SOC accumulation comprise both labile and inert fractions in non-tidal freshwater marshes in the temperate region, and can be as high as rates reported globally for salt marshes and peatlands when vertical accretion is sustained. These rates fluctuate in relation to major hydroclimatic events that caused water levels in the lower Great Lakes to fluctuate through the Holocene. Furthermore, they could be vulnerable and affected in the recent record by anthropogenic-induced activities (e.g., land use, the presence of invasive species, and nutrient loading) in the temperate region, which have potential to affect recent rates of organic carbon burial.
We show that organic carbon fractions in surface marsh soils are predominantly labile and will be subjected to decay in the ensuing centuries and millennia, thereby lowering long-term rates of organic carbon accumulation. Our finding that recent rates of SOC accumulation are attenuated over hundreds to thousands of years due to long-term decay corroborates findings in the coastal (tidal) wetland and peatland literature, and confirms that the extrapolation of recent rates over centuries and millennia will lead to overestimates of greenhouse gas removals in wetland carbon budgets (Mudd et al. 2009; Bridgham et al. 2014; Young et al. 2019; Gore et al. 2024). Because of long-term decay and variability in organic matter quality throughout the marsh paleorecord, it is critical to consider the entire profile and all carbon fractions when quantifying the climate mitigation potential of freshwater marsh soils and their role as a natural climate solution. Otherwise, high recent rates of SOC accumulation in freshwater marsh soils may provide a false sense of success in mediating the climate crisis if applied as carbon offsets over longer time scales.
Acknowledgements
We gratefully acknowledge funding from the Natural Sciences and Engineering Research Council (NSERC) of Canada through a Postgraduate Doctoral scholarship to ALL and a Discovery Grant to SAF. We thank the Nature Conservancy of Canada (NCC) for providing a research permit (#AG-ON-2018-153246) and site access; Liv Monck-Whipp and Brett Norman of the NCC for logistical support, sharing property information and many insights on Central Big Creek marsh and surroundings; and the Long Point World Biosphere Region Foundation for supporting and promoting research. We thank Dean Hiler, Emily Dazé, and Rosemary Martin for field assistance, and Flett Research Ltd. for discussions and feedback on the interpretation of the 210Pb dates. Lastly, we thank Dr. Mike Lewis and Dr. Jennifer Galloway for providing insightful comments on earlier drafts of this manuscript.
References
Bansal S., Lishawa S.C., Newman S., Tangen B.A., Wilcox D., Albert D., et al. 2019. Typha (Cattail) invasion in North American wetlands: biology, regional problems, impacts, ecosystem services, and management. Wetlands, 39: 645–684.
Bao K., Zhao H., Xing W., Lu X., McLaughlin N.B., Wang G. 2011. Carbon accumulation in temperate wetlands of Sanjiang Plain, Northeast China. Soil Science Society of America Journal, 75: 2386.
Barnett P.J. 1993. Quaternary geology of the Long Point-Port Burwell area. Ontario Geological Survey, Open File Report. 5873.
Barnett P.J., Coakley J.P., Terasmae J., Winn C.E. 1985. Chronology and significance of a holocene sedimentary profile from Clear Creek, Lake Erie shoreline, Ontario. Canadian Journal of Earth Sciences, 22: 1133–1138.
Behar F., Beaumont V., De B. Penteado H.L. 2001. Rock-Eval 6 technology: performances and developments. Oil & Gas Science and Technology—Rev. IFP, 56: 111–134.
Bridgham S.D., Megonigal P.J., Keller J.K., Bliss N.B., Trettin C. 2006. The carbon balance of North American wetlands. Wetlands, 26: 889–916.
Bridgham S.D., Moore T.R., Richardson C.J., Roulet N.T. 2014. Errors in greenhouse forcing and soil carbon sequestration estimates in freshwater wetlands: a comment on Mitsch et al. (2013). Landscape Ecology, 29: 1481–1485.
Bronk Ramsey C. 2009. Bayesian analysis of radiocarbon dates. Radiocarbon 51, Cambridge University Press, 337–360.
Bunting J.M., Warner B.G. 1998. Hydroseral development in southern Ontario: patterns and controls. Journal of Biogeography, 25: 3–18.
Bunting J.M., Duthie H.C., Campbell D.R., Warner B.G., Turner L.J. 1997. A palaeoecological record of recent environmental change at Big Creek Marsh, Long Point, Lake Erie. Journal of Great Lakes Research, 23: 349–368.
Byun E., Finkelstein S.A., Cowling S.A., Badiou P. 2018. Potential carbon loss associated with post-settlement wetland conversion in southern Ontario, Canada. Carbon Balance and Management, 13: 13.
Carrie J., Sanei H., Stern G. 2012. Standardisation of rock–Eval pyrolysis for the analysis of recent sediments and soils. Organic Geochemistry, 46: 38–53.
Chapman L.J., Putnam D.F. 1984. The physiography of Southern Ontario. Ontario Geological Survey, Special Volume 2.
Chmura G.L., Anisfeld S.C., Cahoon D.R., Lynch J.C. 2003. Global carbon sequestration in tidal, saline wetland soils. Global Biogeochemical Cycles, 17: 1111.
Ciais P., Sabine C., Bala G., Bopp L., Brovkin V., Canadell J., et al. 2014. Carbon and other biogeochemical cycles. In Climate change 2013: the physical science basis. Contribution of Working Group I to the Fifth Assessment Report of the Intergovernmental Panel on Climate Change. Edited by T.F. Stocker, Cambridge University Press, Cambridge, UK and New York, NY.
Clymo R.S. 1984. The limits to peat bog growth. Philosophical Transactions of the Royal Society of London Series B, Biological Sciences, 303: 605–654.
Coakley J.P., Lewis C.F.M. 1985. Postglacial lake levels in the Erie basin. In Quaternary evolution of the Great Lakes. Geological Association of Canada Special Paper. Vol. 30. Edited by P.F. Karrow, P.E. Calkin. St. John’s, NL.
Creed I.F., Badiou P., Enanga E., Lobb D.A., Pattison-Williams J.K., Lloyd-Smith P., Gloutney M. 2022. Can restoration of freshwater mineral soil wetlands deliver nature-based climate solutions to agricultural landscapes? Frontiers in Ecology and Evolution, 10: 932415.
Dakin S., Skibicki A. 1994. Human history of the Long Point Area. Long Point Environmental Folio Series (Working Paper 6). Heritage Resources Centre, University of Waterloo.
Delaune R.D., White J.R., Elsey-Quirk T., Roberts H.H., Wang D.Q. 2018. Differences in long-term vs short-term carbon and nitrogen sequestration in a coastal river delta wetland: implications for global budgets. Organic Geochemistry, 123: 67–73.
Dinerstein E., Joshi A.R., Vynne C., Lee A.T.L., Pharand-Deschênes F., França M., et al. 2020. A “Global Safety Net” to reverse biodiversity loss and stabilize Earth’s climate. Science Advances, 6: eabb2824.
Drexler J.Z. 2011. Peat formation processes through the millennia in tidal marshes of the Sacramento–San Joaquin Delta, California, USA. Estuaries and Coasts, 34: 900–911.
Drexler J.Z., de Fontaine C.S., Brown T.A. 2009. Peat accretion histories during the past 6,000 years in marshes of the Sacramento–San Joaquin Delta, CA, USA. Estuaries and Coasts, 32: 871–892.
Ducks Unlimited Canada. 2010. Southern Ontario Wetland Conversion Analysis. Barrie, ON.
Environment and Climate Change Canada. 2021. 1981–2010 Climate normals & averages. Government of Canada. Available from https://climate.weather.gc.ca/climate_normals/index_e.html [accessed April 2022].
Fægri K., Iversen J. 1989. Textbook of Pollen Analysis. 4th ed. John Wiley & Sons, Chichester.
Finkelstein S.A., Davis A.M. 2006. Paleoenvironmental records of water level and climatic changes from the middle to Late Holocene at a Lake Erie coastal wetland, Ontario, Canada. Quaternary Research, 65: 33–43.
Finkelstein S.A., Peros M.C., Davis A.M. 2005. Late Holocene paleoenvironmental change in a Great Lakes coastal wetland: integrating pollen and diatom datasets. Journal of Paleolimnology, 33: 1–12.
Gailis M., Kohfeld K.E., Pellatt M.G., Carlson D. 2021. Quantifying blue carbon for the largest salt marsh in southern British Columbia: implications for regional coastal management. Coastal Engineering Journal, 63: 275–309.
Galatowitsch S.M., Anderson N.O., Ascher P.D. 1999. Invasiveness in wetland plants in temperate North America. Wetlands, 19: 733–755.
Gallego-Sala A.V., Charman D.J., Brewer S., Page S.E., Prentice I.C., Friedlingstein P., et al. 2018. Latitudinal limits to the predicted increase of the peatland carbon sink with warming. Nature Climate Change, 8: 907–913.
Galloway J.M., Swindles G.T., Jamieson H.E., Palmer M., Parsons M.B., Sanei H., et al. 2018. Organic matter control on the distribution of arsenic in lake sediments impacted by ∼65 years of gold ore processing in subarctic Canada. Science of the Total Environment, 622-623: 1668–1679.
Gillespie A.W., Sanei H., Diochon A., Ellert B.H., Regier T.Z., Chevrier D., et al. 2014. Perennially and annually frozen soil carbon differ in their susceptibility to decomposition: analysis of subarctic earth hummocks by bioassay, XANES and pyrolysis. Estuarine, Coastal and Shelf Science, 299: 106–116.
Gore C., Gehrels W.R., Smeaton C., Andrews L., McMahon L., Hibbert F., et al. 2024. Saltmarsh blue carbon accumulation rates and their relationship with sea-level rise on a multi-decadal timescale in northern England. Estuarine, Coastal and Shelf Science, 299: 108665.
Goring S., Williams J.W., Blois J.L., Jackson S.T., Paciorek C.J., Booth R.K., et al. 2012. Deposition times in the northeastern United States during the Holocene: establishing valid priors for bayesian age models. Quaternary Science Reviews, 48: 54–60.
Gregorich E.G., Gillespie A.W., Beare M.H., Curtin D., Sanei H., Yanni SF. 2015. Evaluating biodegradability of soil organic matter by its thermal stability and chemical composition. Soil Biology and Biochemistry, 91: 182–191.
Hare A.A., Kuzyk Z.Z.A., Macdonald R.W., Sanei H., Barber D., Stern G.A., Wang F. 2014. Characterization of sedimentary organic matter in recent marine sediments from Hudson Bay, Canada, by Rock-Eval pyrolysis. Organic Geochemistry, 68: 52–60.
Heimann M., Reichstein M. 2008. Terrestrial ecosystem carbon dynamics and climate feedbacks. Nature, 451: 289–292.
Holmquist J.R., Windham-Myers L., Bliss N., Crooks S., Morris J.T., Megonigal J.P., et al. 2018. Accuracy and precisions of tidal wetland soil carbon mapping in the conterminous United States. Scientific Reports, 8: 9478.
Jones M.C., Bernhardt C.E., Willard D.A. 2014. Late Holocene vegetation, climate, and land-use impacts on carbon dynamics in the Florida Everglades. Quaternary Science Reviews, 90: 90–105.
Kanari E., Cécillon L., Baudin F., Clivot H., Ferchaud F., Houot S., et al. 2022. A robust initialization method for accurate soil organic carbon simulations. Biogeosciences, 19: 375–387.
Kemp A.C., Vane C.H., Khan N.S., Ellison J.C., Engelhart S.E., Horton B.P., et al. 2019. Testing the utility of geochemical proxies to reconstruct holocene coastal environments and relative sea level: a case study from Hungry Bay, Bermuda. Open Quaternary, 5: 1–17.
Kemp D.B., Sadler P.M., Vanacker V. 2020. The human impact on North American erosion, sediment transfer, and storage in a geologic context. Nature Communications, 11: 6012.
Khan N.S., Vane C.H., Horton B.P., Hillier C., Riding J.B., Kendrick C.P. 2015. The application of δ 13 C, TOC and C/N geochemistry to reconstruct holocene relative sea levels and paleoenvironments in the Thames Estuary, UK. Journal of Quaternary Science, 30: 417–433.
Kim J.G. 2003. Response of sediment chemistry and accumulation rates to recent environmental changes in the Clear Lake watershed, California, USA. Wetlands, 23: 95–103.
Kolka R., Trettin C., Tang W., Krauss K., Bansal S., Drexler J., et al. 2018. Chapter 13: terrestrial wetlands. In Second state of the carbon cycle report (SOCCR2): a sustained assessment report. Edited by N. Cavallaro, U.S. Global Change Research Program, Washington, DC.
Lafargue E., Marquis F., Pillot D. 1998. Rock-eval 6 applications in hydrocarbon exploration, production, and soil contamination studies. Revue de l'Institut Français du Pétrole, 53: 421–437.
Lavergne S., Molofsky J. 2004. Reed canary grass (Phalaris arundinacea) as a biolgical model in the study of plant invasions. Critical Reviews in Plant Sciences, 23: 415–429.
Lewis C.F.M., Breckenridge A.J., Teller J.T. 2021. Reconstruction of isostatically adjusted paleo-strandlines along the southern margin of the Laurentide Ice Sheet in the Great Lakes, Lake Agassiz, and Champlain Sea basins. Canadian Journal of Earth Sciences, 59: 826–846.
Lewis C.F.M., Cameron G.D.M., Anderson T.W., Heil C.W., Gareau P.L. 2012. Lake levels in the Erie Basin of the Laurentian Great Lakes. Journal of Paleolimnology, 47: 493–511.
Loder A.L., Finkelstein S.A. 2020. Carbon accumulation in freshwater marsh soils: a synthesis for temperate North America. Wetlands, 40: 1173–1187.
Marchand C., Lallier-Vergès E., Baltzer F. 2003. The composition of sedimentary organic matter in relation to the dynamic features of a mangrove-fringed coast in French Guiana. Estuarine, Coastal and Shelf Science, 56: 119–130.
Marchand C., Lallier-Vergès E., Disnar J.R., Kéravis D. 2008. Organic carbon sources and transformations in mangrove sediments: a Rock-Eval pyrolysis approach. Organic Geochemistry, 39: 408–421.
Marrs R.H., Marsland E.-L., Lingard R., Appleby P.G., Piliposyan G.T., Rose R.J., et al. 2019. Experimental evidence for sustained carbon sequestration in fire-managed, peat moorlands. Nature Geoscience, 12: 108–112.
Martin JB. 2017. Carbonate minerals in the global carbon cycle. Chemical Geology, 449: 58–72.
McAndrews J.H., Berti A.A., Norris G. 1973. Key to the Quaternary Pollen and Spores of the Great Lakes Region. Royal Ontario Museum, Toronto.
McAndrews J.H., Boyko-Diakonow M. 1989. Pollen analysis of varved sediment at Crawford Lake, Ontario: evidence of Indian and European farming. In Quaternary Geology of Canada and Greenland, Geology of Canada. No. 1. Edited by R.J. Fulton. Geological Survey of Canada. pp. 528–530.
McTigue N., Davis J., Rodriguez A.B., McKee B., Atencio A., Currin C. 2019. Sea level rise explains changing carbon accumulation rates in a salt marsh over the past two millennia. Journal of Geophysical Research: Biogeosciences, 124: 2945–2957.
Mitsch W.J., Gosselink J.G. 2015. Wetlands. 5th ed. John Wiley and Sons, Hoboken, NJ.
Mudd S.M., Howell S.M., Morris J.T. 2009. Impact of dynamic feedbacks between sedimentation, sea-level rise, and biomass production on near-surface marsh stratigraphy and carbon accumulation. Estuarine, Coastal and Shelf Science, 82: 377–389.
Mueller P., Kutzbach L., Mozdzer T.J., Jespersen E., Barber D.C., Eller F. 2023. Minerogenic salt marshes can function as important inorganic carbon stores. Limnology and Oceanography, 68: 942–952.
Nahlik A.M., Fennessy M.S. 2016. Carbon storage in US wetlands. Nature Communications, 7: 13835.
National Oceanic and Atmospheric Administration (NOAA). 2022. NOAA Great Lakes Environmental Research Laboratory, Great Lakes Water Level Observations [Dataset]. NOAA. Available from https://www.glerl.noaa.gov/data/wlevels/ [accessed April 2022].
Neubauer S.C. 2014. On the challenges of modeling the net radiative forcing of wetlands: reconsidering Mitsch et al. 2013. Landscape Ecology, 29: 571–577.
Ontario Ministry of Northern Development, Mines, Natural Resources and Forestry. 2012. Quaternary geology of Ontario [Dataset]. Government of Ontario. Available from https://data.ontario.ca/dataset/quaternary-geology-of-ontario [accessed February 2022].
Ouyang X., Lee S.Y. 2014. Updated estimates of carbon accumulation rates in coastal marsh sediments. Biogeosciences, 11: 5057–5071.
Packalen M.S., Finkelstein S.A. 2014. Quantifying Holocene variability in carbon uptake and release since peat initiation in the Hudson Bay Lowlands. The Holocene, 24: 1063–1074.
Papiernik S.K., Lindstrom M.J., Schumacher J.A., Farenhorst A., Stephens K.D., Schumacher T.E., Lobb D.A. 2005. Variation in soil properties and crop yield across an eroded prairie landscape. Journal of Soil and Water Conservation, 60:338–395.
Pederson D.C., Peteet D.M., Kurdyla D., Guilderson T. 2005. Medieval warming, Little Ice Age, and European impact on the environment during the last millennium in the lower Hudson Valley, New York, USA. Quaternary Research, 63: 238–249.
Pendea I.F., Kanavillil N., Kurissery S., Chmura G.L. 2023. Carbon stocks and recent rates of carbon sequestration in nutrient-rich freshwater wetlands from Lake Simcoe watershed (Southern Canada). Journal of Geophysical Research: Biogeosciences, 128: e2023JG007561.
Pengelly J.W., Tinkler K.J., Parkins W.G., McCarthy F.M.G. 1997. 12,600 years of lake level changes, changing sills, ephemeral lakes and Niagara Gorge erosion in the Niagara Peninsula and eastern Lake Erie basin. Journal of Paleolimnology, 17: 377–402.
Peteet D., Nichols J., Pederson D., Kenna T., Chang C., Newton B., Vincent S. 2020. Climate and anthropogenic controls on blue carbon sequestration in Hudson River tidal marsh, Piermont, New York. Environmental Research Letters, 15: 065001.
Petrescu A.M.R., Lohila A., Tuovinen J.P., Baldocchi D.D., Desai A.R., Roulet N.T., et al. 2015. The uncertain climate footprint of wetlands under human pressure. Proceedings of the National Academy of Sciences, 112: 4594–4599.
Pyke M.L., Close P.G., Dobbs R.J., Toussaint S., Smith B., Cox Z., et al. 2021. ‘Clean him up…make him look like He was before’: australian aboriginal management of wetlands with implications for conservation, restoration and multiple evidence base negotiations. Wetlands, 41: 28.
Reddy K.R., Delaune RD. 2008. Biogeochemistry of wetlands. Taylor & Francis Group, Florida.
Reimer P., Austin W., Bard E., Bayliss A., Blackwell P., Bronk Ramsey C., et al. 2020. The IntCal20 Northern hemisphere radiocarbon age calibration curve (0–55 cal kBP). Radiocarbon, 62: 725–757.
Repasch M., Scheingross J.S., Hovius N., Lupker M., Wittmann H., Haghipour N., et al. 2021. Fluvial organic carbon cycling regulated by sediment transit time and mineral protection. Nature Geoscience, 14: 842–848.
Riley JL. 2013. The once and future Great Lakes country: an ecological history. McGill-Queen’s University Press, Montreal, QC.
Rogers K., Kelleway J.J., Saintilan N., Megonigal J.P., Adams J.B., Holmquist J.R., et al. 2019. Wetland carbon storage controlled by millennial-scale variation in relative sea-level rise. Nature, 567: 91–95.
Rothman E., Bouchard V. 2007. Regulation of carbon processes by macrophyte species in a Great Lakes coastal wetland. Wetlands, 27: 1134–1143.
Saderne V., Geraldi N.R., Macreadie P.I., Maher D.T., Middelburg J.J., Serrano O., et al. 2019. Role of carbonate burial in blue carbon budgets. Nature Communications, 10: 1106.
Sadler P.M. 1981. Sediment accumulation rates and the completeness of stratigraphic sections. The Journal of Geology, 89: 569–584.
Saenger A., Cécillon L., Sebag D., Brun J.J. 2013. Soil organic carbon quantity, chemistry and thermal stability in a mountainous landscape: a Rock-Eval pyrolysis survey. Organic Geochemistry, 54: 101–114.
Sanei H., Goodarzi F., Snowdon L.R., Stasiuk L.D., Van Der Flier-Keller E. 2000. Characterizing the recent sediments from Pigeon Lake, Alberta as related to anthropogenic and natural fluxes.Environmental Geosciences, 7: 177–189.
Sanei H., Stasiuk L.D., Goodarzi F. 2005. Petrological changes occurring in organic matter from recent lacustrine sediments during thermal alteration by Rock-Eval pyrolysis. Organic Geochemistry, 36: 1190–1203.
Snell E. 1987. Wetland distribution and conversion in southern Ontario. In Inland waters and lands directorate. No. 48, Environment Canada, Ottawa, ON.
Soucémarianadin L., Cécillon L., Chenu C., Baudin F., Nicolas M., Girardin C., Barré P. 2018. Is Rock-Eval 6 thermal analysis a good indicator of soil organic carbon lability?—A method-comparison study in forest soils. Soil Biology and Biochemistry, 117: 108–116.
Spivak A.C., Sanderman J., Bowen J.L., Canuel E.A., Hopkinson C.S. 2019. Global-change controls on soil-carbon accumulation and loss in coastal vegetated ecosystems. Nature Geoscience, 12: 685–692.
St. Jacques J.M., Cumming B.F., Smol J.P. 2008. A pre-European settlement pollen-climate calibration set for Minnesota, USA: developing tools for palaeoclimatic reconstructions. Journal of Biogeography, 35: 306–324.
Van de Broek M., Temmerman S., Merckx R., Govers G. 2016. Controls on soil organic carbon stocks in tidal marshes along an estuarine salinity gradient. Biogeosciences, 13: 6611–6624.
Van de Broek M., Vandendriessche C., Poppelmonde D., Merckx R., Temmerman S., Govers G. 2018. Long-term organic carbon sequestration in tidal marsh sediments is dominated by old-aged allochthonous inputs in a macrotidal estuary. Global Change Biology, 24: 2498–2512.
Young D.M., Baird A.J., Charman D.J., Evans C.D., Gallego-Sala A.V., Gill P.J., et al. 2019. Misinterpreting carbon accumulation rates in records from near-surface peat. Scientific Reports, 9: 17939.
Yu L., Huang Y., Sun F., Sun W. 2017. A synthesis of soil carbon and nitrogen recovery after wetland restoration and creation in the United States. Scientific Reports, 7: 7966.
Zamanian K., Zhou J., Kuzyakov Y. 2021. Soil carbonates: the unaccounted, irrecoverable carbon source. Geoderma, 384: 114817.
Zhang Y., Gao Y., Zhang Y., Huang D., Li X., McLaughlin N., et al. 2023. Linking rock-Eval parameters to soil heterotrophic respiration and microbial residues in a black soil. Soil Biology and Biochemistry, 178: 108939.
Zoltai S.C. 1988. Chapter 1: wetland environments and classification. In Wetlands of Canada. Polyscience Publications Inc., Montreal, QC.
Supplementary material
Supplementary Material 1 (XLSX / 364 KB).
- Download
- 363.75 KB
Information & Authors
Information
Published In
FACETS
Volume 10 • 2025
Pages: 1 - 14
Editor: Irene Gregory-Eaves
History
Received: 10 April 2024
Accepted: 12 October 2024
Version of record online: 6 February 2025
Copyright
© 2025 Authors Loder, Gillespie, Oviedo, Finkelstein; and The Crown. This work is licensed under a Creative Commons Attribution 4.0 International License (CC BY 4.0), which permits unrestricted use, distribution, and reproduction in any medium, provided the original author(s) and source are credited.
Data Availability Statement
Data generated or analyzed during this study are provided in full within the published article and its supplementary materials.
Key Words
Sections
Subjects
Plain Language Summary
Long-Term Soil Organic Carbon Accumulation in Freshwater Marshes: Insights from the Big Creek Watershed
Authors
Author Contributions
Conceptualization: ALL, SAF
Data curation: ALL
Formal analysis: ALL, AG, OHA, CCO
Funding acquisition: SAF
Investigation: ALL, SAF
Methodology: ALL, AG, OHA, CCO
Supervision: SAF
Visualization: ALL, AG, OHA, SAF
Writing – original draft: ALL, AG, OHA, SAF
Writing – review & editing: ALL, AG, OHA, CCO, SAF
Competing Interests
The authors declare there are no competing interests.
Funding Information
Natural Sciences and Engineering Research Council (NSERC)
Metrics & Citations
Metrics
Other Metrics
Citations
Cite As
Amanda L. Loder, Adam Gillespie, Omid Haeri Ardakani, Cecilia Cordero Oviedo, and Sarah A. Finkelstein. 2025. Drivers of high rates of carbon burial in a riverine-influenced freshwater marsh in the Long Point Walsingham Priority Place of southern Ontario. FACETS.
10: 1-14.
https://doi.org/10.1139/facets-2024-0044
Export Citations
If you have the appropriate software installed, you can download article citation data to the citation manager of your choice. Simply select your manager software from the list below and click Download.
There are no citations for this item