A temporal record of microplastic accumulation in sediment cores of the Great Lakes, North America, reflects macroeconomic and regional influences
Abstract
Documented plastic pollution throughout the Laurentian Great Lakes system prompted investigation of microplastics (MPs) in sediment cores. We examined offshore sediment cores from Lake Huron (LH43) and Lake Ontario (403A) to understand temporal trends and changes in microplastic (MP) pollution in the size range 53 µm to 2 mm. MP abundances varied from 18.1 to 280.1 particles per g of dry weight sediment (N g−1 dw) in LH43, and 8.2–488.4 g−1 dw in core 403A. The 15 cm cores are equivalent to 56 years of accumulation in Lake Huron and 72 years of accumulation in Lake Ontario. Analysis of the two cores shows an increasing trend in MP accumulation from 1964 to 1989, which mirrors the global plastic production rate. Subsequent peaks and troughs in the MP abundance profiles reflect macroeconomic changes and regional controls. These results show how changing abundances of MPs in lake sediment cores can act as proxies for global perturbations in oil supply as well as national economic shifts.
Introduction
Increasing mass production and extensive use and application of plastics have led to their accumulation in terrestrial, marine, and freshwater settings, as well as in the atmosphere. Between 1950 and 2015, the estimated plastic waste generated was 6300 Mt (million metric tonnes), of which only 9% had been recycled (Geyer et al. 2017). This suggests that most plastics are deposited in landfills or in the natural environment. In Canada, ∼4667 kilotonnes (kt) of plastics are introduced into the market annually, and 3268 kt of plastic was discarded as waste (ECCC 2019). An estimated 9% of plastics were recycled, 4% incinerated, 86% landfilled, and 1% escaped into the environment. Microplastics (MPs), plastic particles < 5 mm in their longest dimension, are particularly concerning for aquatic ecosystems and their potential to affect human health (Rochman et al. 2014; Chae and An 2017; Smith et al. 2018; Vethaak and Legler 2021).
The Great Lakes are a valuable global resource, providing roughly 21% of the planet’s fresh water (EPA 2023). Bottom sediment of the Great Lakes has been documented as a significant natural sink for MP accumulation, with concentrations linked to proximity to shoreline and plastic industries, urban land use, and population density (Corcoran et al. 2015; Ballent et al. 2016; Grbić et al. 2020; Lenaker et al. 2020). The transport and settling velocity of MPs in the Great Lakes have been shown to depend on hydrodynamic regimes, sediment grain size, and biofouling (McCormick et al. 2014; Cable et al. 2017; Hoffman and Hittinger 2017). Once deposited in benthic offshore environments, the external physiochemical factors leading to the degradation of MPs are less important due to low temperatures and lack of penetrable light. In addition, high residence times, low energy dynamics, colonization by microorganisms, and clay adsorption can cause buoyant anthropogenic particles to settle to the lake bottom and eventually become buried and preserved in the sedimentary strata (Corcoran 2015; Kane and Clare 2019; Leiser et al. 2021).
An estimated 70% of MPs have accumulated in sediment profiles (Hammer et al. 2012). The vertical distribution of MPs in the sediment column could be a result of steady-state deposition, pore water transport (Courtene-Jones et al. 2020; Waldschläger and Schüttrumpf 2020), and/or bioturbation processes moving both natural and synthetic particles from the water–sediment interface into deeper sediment (Zhang et al. 2010; Rillig et al. 2017; Niu et al. 2021).
This study provides a temporal perspective of MP accumulation in sediment cores sampled from Lake Huron and Lake Ontario of the Laurentian Great Lakes. Our objectives were to (1) characterize MPs by type and composition and (2) evaluate the vertical distribution of MPs within each sediment core to assess temporal trends and fluctuations. Surface sediment, defined as sediment 0–5 cm deep, reflects current contamination levels of poorly sorted detrital material (Filgueiras et al. 2019; Zheng et al. 2020), whereas deep sediment refers to sediment at depths between >5 and 15 cm that represents historic fluctuations of anthropogenic deposits. The results of this study allow for comparisons of plastic production and use with MP accumulation over a multi-decadal period.
Materials and methods
Sample collection and core dating
Two sediment cores from the Laurentian Great Lakes were studied for MP abundances: (1) LH43, collected from offshore Lake Huron in 2017, and (2) 403A, collected from offshore Lake Ontario in 2017 (Fig. 1). The cores were collected using a box corer by Environment and Climate Change Canada (ECCC) as part of their long-term sampling program. The sediment in each box core was subdivided into 7.62 cm push cores, stored at 4° C on the vessel, and transported back to the lab. Each push core was sectioned at 1 cm intervals and frozen for further analyses. One push core from LH43 was sent to the Institut national de la recherche scientifique for 210Pb dating using gamma-ray spectrometry. The 210Pb activity profile of the 15 cm sediment core was used to determine the average sedimentation rate and years represented from the surface down, according to the constant rate of supply (CRS) model. A second push core from LH43 was sent to The University of Western Ontario (London, Ontario, Canada) to be assessed for MP content.
Fig. 1.

A push core from Lake Ontario box core 403A was also sent to The University of Western Ontario for MP investigation. One core sampled in 2006 from the same location as 403A (core 1034) was analyzed by ECCC using the 210Po dating technique with alpha spectrometry. The 210Po activity profile of core 1034 was used to determine the sedimentation rate and years represented from the surface down, according to the CRS model. To account for the missing 210Po data between 2006 (1034) and 2017 (403C), the sedimentation rates were interpolated based on the difference in incremental mass sediment rate between the top two slices of the core. Dating models for cores LH43 and 403A are provided in Table S1.
Sample processing
The laboratory methods used were similar to previous studies that investigated MPs in nearshore and offshore sediment of Lakes Ontario and Erie and in tributary sediment of the Thames River, Ontario (Corcoran et al. 2015, 2020a; Ballent et al. 2016; Dean et al. 2018). Each 1 cm sediment slice was wet sieved using reverse osmosis (RO) water in a 45 µm metal sieve, then transferred into an aluminum pie tray, covered with foil, and dried in an oven at 70 °C. The sediment grain sizes < 45 µm were removed to avoid flocculation during drying in the oven. This step facilitated density separation of MPs and sediment grains but may have resulted in particle count underestimations (Browne et al. 2010; Bergmann et al. 2017). The samples were transferred to glass beakers containing approximately 250 mL of 1.5 g cm−3 sodium polytungstate (SPT) solution and were mixed for 2 min using a magnetic stirrer. The supernatant was decanted into a glass separation funnel where it underwent density settling. Once separation was complete, the non-buoyant sediment was removed and the remaining buoyant material, consisting of MPs entrained in organic matter, was filtered through 25 µm quantitative fast flow filter paper and rinsed through a 53 µm sieve to remove any remaining SPT solution. The remaining particles, with a lower limit of 53 µm and an upper limit of 2 mm, were transferred to a glass Petri dish (60 mm × 10 mm) and placed back into the oven at 70 °C for drying.
Physical and chemical analysis
Anthropogenic (non-natural) particles were identified and classified using a Nikon SMZ1500 stereomicroscope at magnifications of 3.75x to 258x. The particles were classified according to morphology (fibre, fragment, and film), colour, and size. Abundances were reported as number of particles per g of dry weight sediment (N g−1 dw), as opposed to N kg−1 dw which is often used, because the amount of sediment remaining after wet sieving was <1 g (Table 1). Normalizing to number of particles kg−1 dw could therefore result in serious over-extrapolation of MP abundance. The particles were removed from the sample using stainless steel tweezers or dental pick and were placed on double-sided tape that was adhered to a glass slide. Approximately 11% (60 out of 559) of all MP particles were selected for Fourier transform infrared spectroscopy (FTIR) using a random number generator to subtract non-MPs from the pre-FTIR totals. Sixty particles were chosen because of time constraints, as analyzing 559 particles would have taken approximately 55 h. The randomly selected particles were analyzed by FTIR at Surface Science Western, The University of Western Ontario, Canada. Measurements were performed in transmission mode and spectra were collected from 4000 to 600 cm−1 with a resolution of 4 cm−1. Spectra corrections were completed to account for water vapour, carbon dioxide, and the adhesive tape. The spectra were compared with the Bruker spectral library to determine polymer type. The data were calculated and plotted using Microsoft Excel.
Table 1.
| Core | Core slice | 210Pb date | 210Po date | Total MPs (N) | Sample weight (g)* | Microplastics (N g−1 of dw sediment) |
|---|---|---|---|---|---|---|
| LH43 | 1 | 2016 | 35 | 0.483 | 72.5 | |
| LH43 | 2 | 2012 | 39 | 0.432 | 90.4 | |
| LH43 | 3 | 2009 | 25 | 0.377 | 66.3 | |
| LH43 | 4 | 2005 | 33 | 0.483 | 69.4 | |
| LH43 | 5 | 2001 | 19 | 0.679 | 28.0 | |
| LH43 | 6 | 1997 | 27 | 0.223 | 120.9 | |
| LH43 | 7 | 1994 | 36 | 0.206 | 175.1 | |
| LH43 | 8 | 1989 | 54 | 0.323 | 167.0 | |
| LH43 | 9 | 1985 | 51 | 0.182 | 280.1 | |
| LH43 | 10 | 1981 | 25 | 0.039 | 180.2 | |
| LH43 | 11 | 1976 | 27 | 0.157 | 171.5 | |
| LH43 | 12 | 1973 | 21 | 0.207 | 101.4 | |
| LH43 | 13 | 1968 | 22 | 0.270 | 81.4 | |
| LH43 | 14 | 1964 | 14 | 0.812 | 17.2 | |
| LH43 | 15 | 1960 | 11 | 0.607 | 18.1 | |
| 403A | 1 | 2017 | 21 | 0.061 | 344.3 | |
| 403A | 2 | 2014 | 12 | 0.108 | 111.1 | |
| 403A | 3 | 2010 | 21 | 0.043 | 488.4 | |
| 403A | 4 | 2006 | 8 | 0.299 | 26.8 | |
| 403A | 5 | 2002 | 13 | 0.107 | 121.5 | |
| 403A | 6 | 1998 | 10 | 0.504 | 19.8 | |
| 403A | 7 | 1993 | 6 | 0.144 | 41.7 | |
| 403A | 8 | 1989 | 8 | 0.028 | 285.7 | |
| 403A | 9 | 1985 | 7 | 0.052 | 134.6 | |
| 403A | 10 | 1980 | 6 | 0.044 | 136.4 | |
| 403A | 11 | 1974 | 1 | 0.057 | 17.5 | |
| 403A | 12 | 1968 | 2 | 0.173 | 11.6 | |
| 403A | 13 | 1960 | 1 | 0.122 | 8.2 | |
| 403A | 14 | 1952 | 2 | 0.108 | 18.5 | |
| 403A | 15 | 1945 | 2 | 0.130 | 15.4 |
*
53µm to 2 mm grain size fraction only.
Quality assurance and controls
In the laboratory, all surfaces and equipment were wiped down with a cotton rag, and glassware was rinsed with RO water and air-dried before use to prevent airborne contamination. Cotton laboratory coats were worn during all experimental phases. A vacuum was used on tile floors to minimize MP particles in dust. Clean-air precautions in the form of a stereomicroscope with metal enclosure, HEPA air purifiers, and glass fibre filters in vents were used during processing and microscopic examination. Three pre-industrial sediment samples from core 403A (25–27, 27–29, and 29–31 cm) were processed and examined to contain zero particle counts. This indicates that the field sampling, as well as processing and examination stages in the laboratory, did not contribute significantly to airborne contamination. Nonetheless, procedural blanks containing pre-examined sediment were placed on the counter during processing and under the microscope enclosure during examination. Airborne contamination was determined from an average of two blanks from each treatment stage. The results were blue (4), pink (2), and black (1) microfibres, which were subtracted from the totals of each sediment sample.
Results
Microplastics in LH43
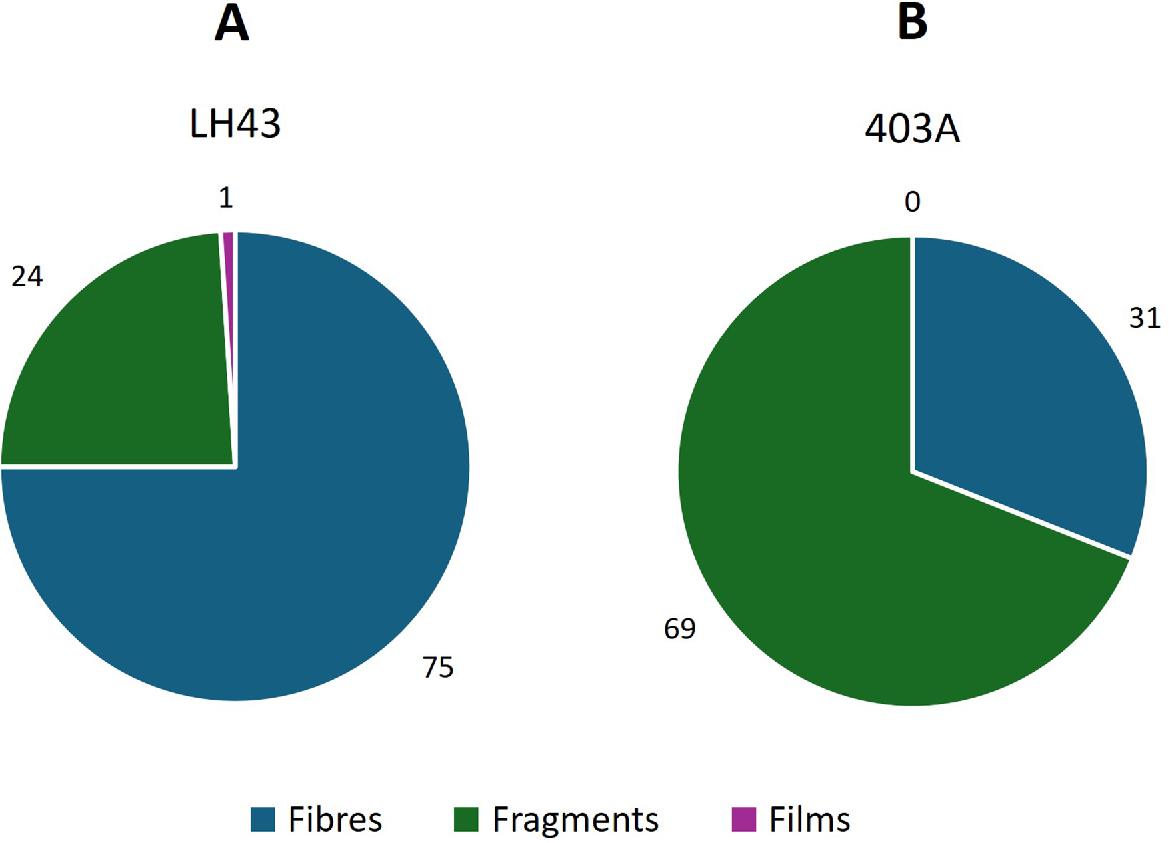
Based on the 210Pb results, an average sedimentation rate for LH43 was calculated to be 0.06 g/cm2/year. This indicates that each core slice represents 3.5 years (Fig. 2A). Following FTIR and blank subtraction, the MP abundances in core LH43 ranged from 17.2 to 280.1 g−1 dw (Table 1). Core LH43 exhibits an increase in MP abundance from 14 to 9 cm (Fig. 2A). There is an accumulation peak at 9 cm with a total of 280.1 g−1 dw sediment, a decrease in MP abundance between 9 and 5 cm, and then a general increase from 5 cm to surface. Sediment at 15 cm depth contained an 80% lower MP abundance than that at 1 cm. Core LH43 contained the greatest MP abundances below the surface sediment (>5 cm depth; Fig. 2A). Of 45 particles analyzed by FTIR, the compositions of 14 could not be determined. Of the remaining 31 particles, 76% were determined to be MPs (Fig. 3A). The average fibre abundance in LH43 was 75%, with average fragment and film abundances of 24% and 1%, respectively (Fig. 4A). The polymer types included polypropylene (PP), polyethylene (PE), polyethylene terephthalate (PET), nylon, polyacrylonitrile (PAN), and “paint related” particles (Fig. 3A). Of the analyzed particles, non-plastics included seven cellulose fibres, three polyamide fibres, and one calcium carbonate grain.
Fig. 2.

Fig. 3.
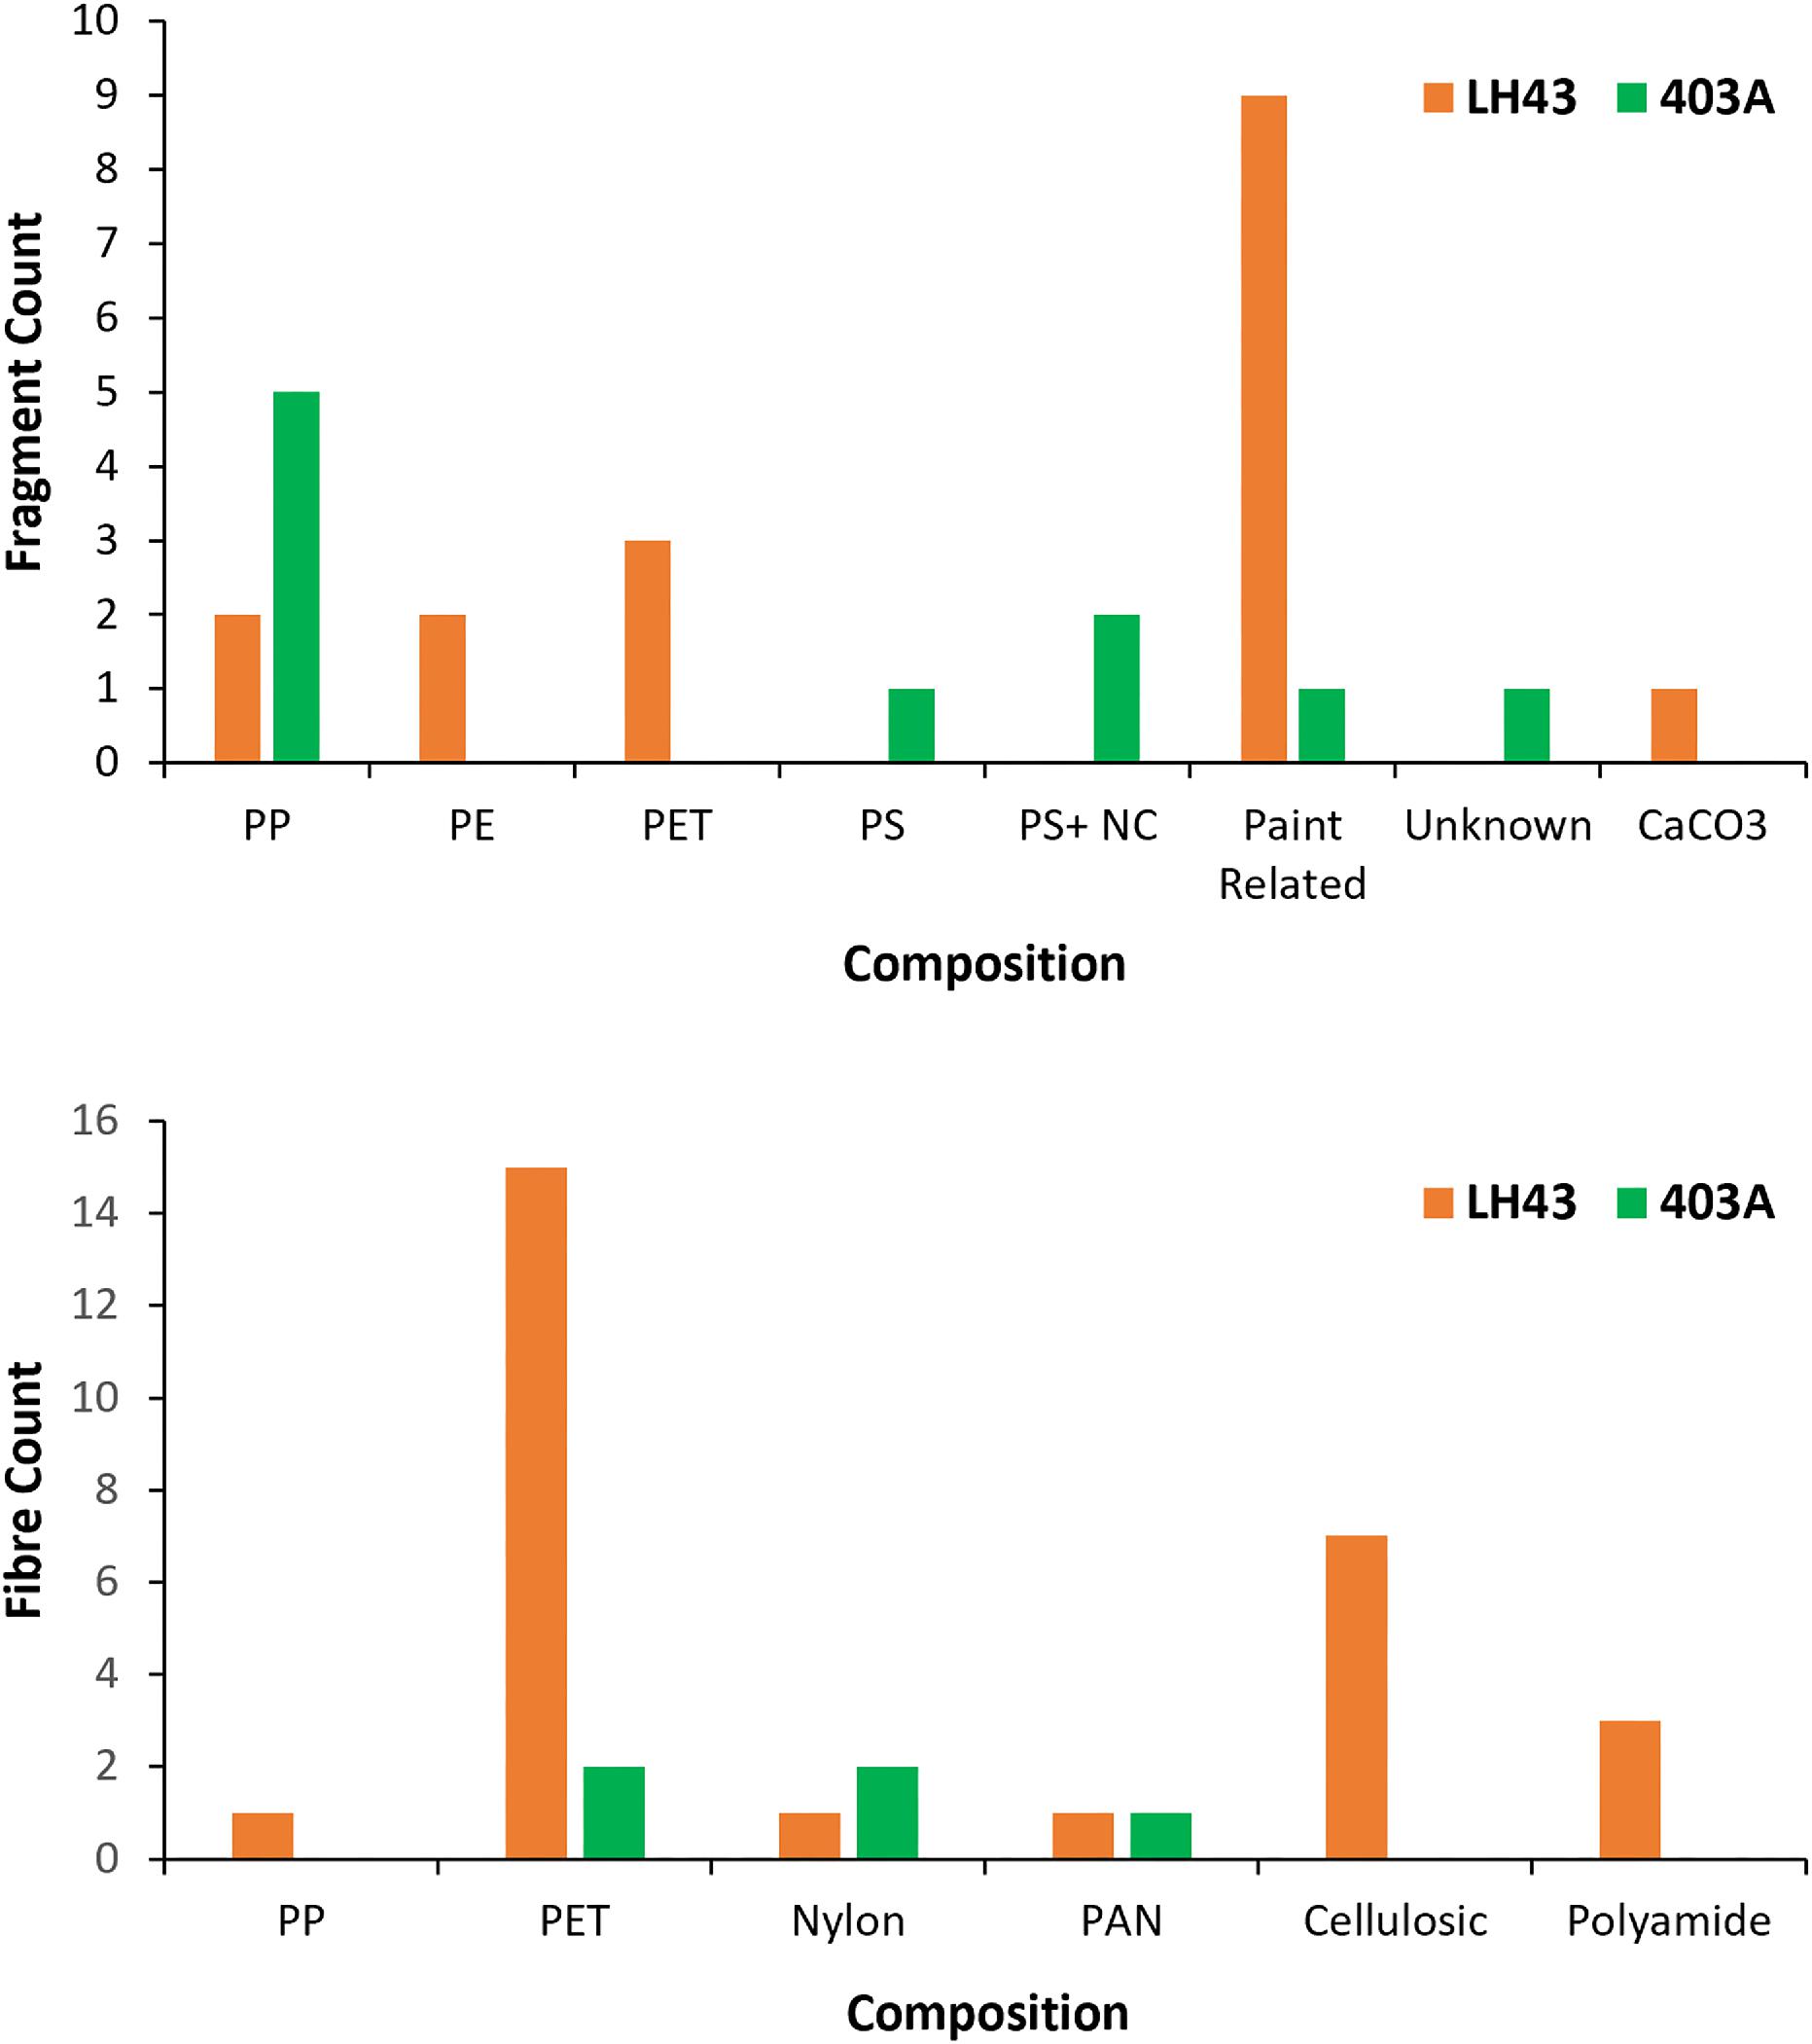
Fig. 4.
Microplastics in 403A
The 210Po results indicate an average sedimentation rate of 0.027 g/cm2/y for core 1034 (403A). Each core slice thus represents 6.5 years (Table 1). Following FTIR and blank subtraction, the MP abundances in core 403A ranged from 8.2 to 488.4 g−1 dw (Table 1; Fig. 2B). Anthropogenic particles were pervasive in all sediment slices down to 15 cm depth (Fig. 2B). Core 403A displays an increasing MP abundance from 13 to 8 cm. There is an accumulation peak at 8 cm with a total of 285.7 g−1 dw sediment, a decrease in MP abundance between 8 and 6 cm and then a general increase from 6 cm to surface. There are, however, two sharp peaks in abundance within the 5 and 3 cm core slices (Fig. 2B). Sediment at 15 cm depth contained a 96% lower MP abundance than that at 1 cm. The majority of MPs in core 403A were found within the surface sediment (<5 cm depth; Fig. 2B). Thirteen percent of the total number of anthropogenic particles in 403A (15 of 120 particles) were analyzed by FTIR, and 93% were determined to be MPs (Fig. 3B). Fragments were the most common anthropogenic particle type, with an average abundance of 69%, whereas average fibre and film abundances were 31% and 0%, respectively (Fig. 4B). The polymer types found in core 403A included PET, nylon, PAN, PP, polystyrene (PS), PS + nitrocellulose (particle containing both polymers), and polyurethane (PU) (Fig. 3B). Of the particles analyzed, one fragment was of unknown composition.
Discussion
Microplastic accumulation and macroeconomic factors
A chronology of MP deposition for each sediment core is shown in Fig. 2. According to our results, MPs have been accumulating in Lake Huron and Lake Ontario for at least 56 and 72 years, respectively (Table 1; Fig. 2). The results of this study were also plotted against global plastic production (Mt yr−1) (Fig. 5). Although the majority of commercial plastics and resins began to be produced in the 1930s, these products did not begin to be widely produced until the 1950s (Fig. 5; blue curve). The breakdown of plastic items into secondary MPs would therefore have lagged several years behind their production, which is supported by the initial significant increase in MPs into offshore sediment of Lake Huron in 1964 (Fig. 5; orange line) and Lake Ontario in 1974 (green line).
Fig. 5.
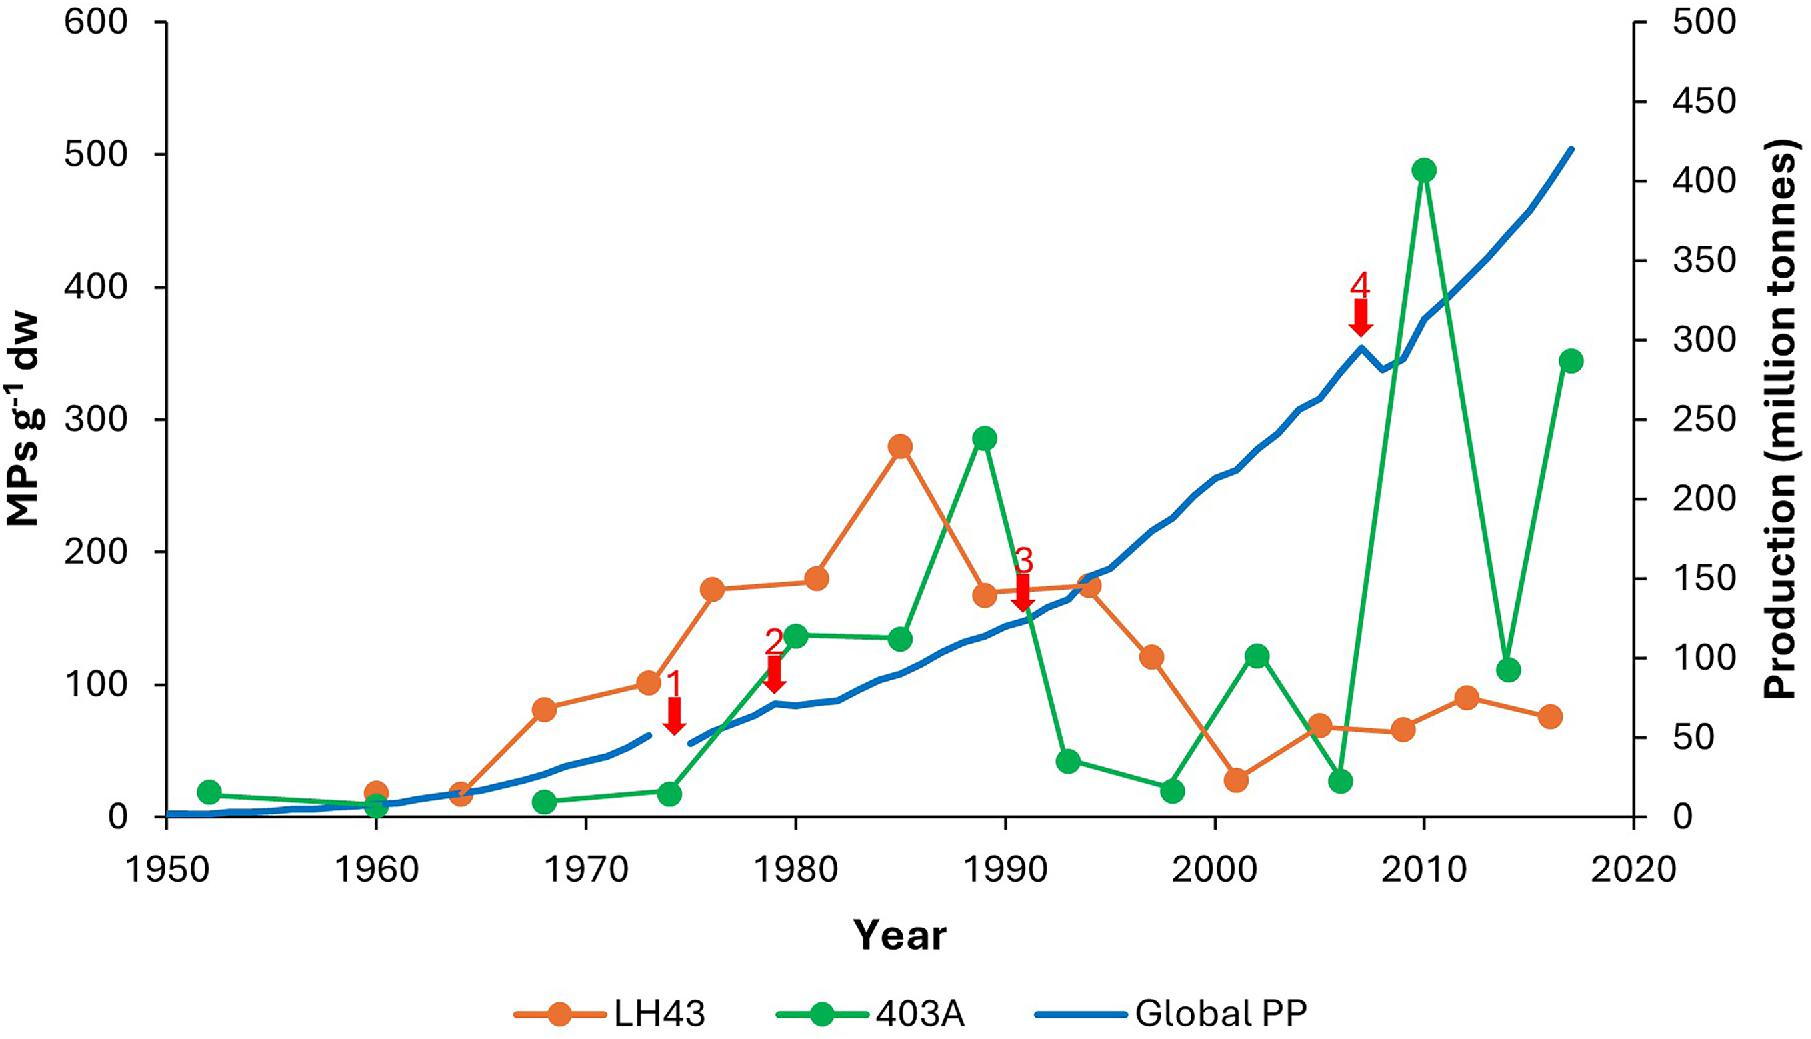
A second lag considered a temporal offset between plastic production and MP accumulation in the environment is evident in Fig. 5. Global plastic production decreased from 51 million tonnes in 1973 to 46 million tonnes in 1975 (Our World in Data 2023). This decrease in plastic production is associated with low global oil supply due to the Arab Oil Embargo (1973–1974). In Canada, plastic product shipments declined during the succeeding 15–20-year period, with a deficit in the trade balance of plastics until 1995 (Government of Canada 2018). A second decrease in plastic production occurred from 1979 (71 million tonnes) to 1980 (70 million tonnes), which can be attributed to the decrease in oil supply during the Iranian Revolution in 1979. In addition, a global economic recession took place from 1991 to 1993. Although this is not evident on the global plastic production curve in Fig. 5, in Canada, the plastic product industry saw a drop in growth trend in the early 1990s (Margeson 2000). This economic recession is considered a result of a rising inflation rate and consequent increase in the Bank of Canada prime rate, in addition to the inception of the Canada–U.S. Free Trade Agreement, which eliminated tariff protection for manufacturing companies. Between 1991 and 1992, average annual growth of employment in the Canadian manufacturing industry fell by 5.7% (Ray et al. 2017), and the gross domestic product (in billions USD) saw a change in growth rate of −2.1% in 1991 (The World Bank 2024).
The effects of the combined periods of decreased plastic production between 1973 and 1993 are represented in Fig. 5 by relatively low abundances of MPs in the cores between 1985 and 2001 (LH43) and 1989 and the mid-2000s (403A). This indicates an approximate temporal offset of 11 years in Lake Huron and 15 years in Lake Ontario between decreased plastic production in the 1970s and later decline of MPs in the environment until the early 2000s. Both cores LH43 and 403A display general increases in MP abundances in the years following 1998–2001, but the profiles are erratic. The abrupt decrease in MP abundance displayed by core 403A in 2010, coupled with the less abrupt decrease in core LH43 in 2012, could possibly represent a third lag effect following the Great Financial Crisis in the years 2007–2009. This global recession, mainly precipitated by a lack of financial supervision by large investment banks and a plunge in U.S. housing markets (Duffie 2019), is clearly seen on the plastic production profile (Fig. 5).
Fluctuations in MP abundances over several decades, such as those identified in the present study, were also found by Turner et al. (2019) in a dated sediment core collected from an urban lake in the U.K. Their results indicate low MP accumulation rates in the 1950s–1960s, then an accumulation peak in the mid to late 1960s, and a subsequent decrease in the 1980s. Regional economic factors have also been shown to have affected MP abundances in sediment cores in China. Mao et al. (2021) identified a rapid increase in MPs between 1978 and 2000 in sediment cores from Wuliangsuhai Lake, China, which they associated with rising industrial levels and significant population growth during that period.
Other investigations of MPs at depth in sediment correlate with worldwide plastic production and population growth. For example, Brandon et al. (2019) identified a substantial increase in MP abundances from 1945 to 2009 in sediment cores from off the coast of Southern California. Similarly, Simon-Sánchez et al. (2022) determined that the mass of MPs increased in sediment cores from the Balearic Sea between 1965 and 2016. Matsuguma et al. (2017) determined that MP pollution has increased over time as recorded in sediment cores from Japan, Thailand, Malaysia, and South Africa.
In a study of freshwater fish from Illinois rivers and Lake Michigan, Hou et al. (2021) quantified MP particles in the digestive tracts of fish caught between 1900 and 2018. In these samples, polyester microfibres were detected but no fibres were identified in fish caught prior to 1950. Averaged fish samples saw a steady increase in MP uptake from 1950 to 2018, which aligns well with general historical trends in cores LH43 and 403A and with global plastics production.
Microplastic accumulation and sedimentological factors
It is possible that the erratic upper parts of the MP profiles, especially for core 403A, could be attributed to the top 6 cm being surface sediment. Although surface sediment in offshore sites is not prone to wave or current reworking, benthic organisms can promote particle mixing through bioturbation. Generally, the displacement of particles through burrowing activities becomes less pronounced at greater depths within a sediment profile (Hülse et al. 2022). Another possibility for the erratic MP abundances in the surface sediment is that smearing could have occurred. Chant and Cornett (1991) experimentally tested the smearing, or mixing of sediment between adjacent core sections, by studying the redistribution of isotopic tracers attached to plastic microspheres during core manipulations. The authors found that 96% of the tracer activity was detected in the upper 2 cm. At depths > 4 cm, tracer activity was <0.1% of the activity in the overlying slices. Adjacent push cores subsampled from individual box core samples were used for the present study, and thus, it is possible that some smearing of the upper slices may have taken place.
Corcoran et al. (2015) studied a core sampled from Lake Ontario in 2013 (403), collected proximal to 403A in the present study. The authors determined that, based on published sediment accumulation rates, MPs had been accumulating in Lake Ontario bottom sediment since ca. 1977. The authors, however, examined sediment ranging from 500 µm to 3 mm in size. In the present study, the MPs examined ranged from 53 µm to 2 mm in size, and this may account for the greater abundances and longer accumulation histories presented herein.
Sources of microplastics
MP abundances in the top 5 cm of core LH43 account for 20% of the total abundance, whereas core 403A contains 61% of its MP abundance in the top 6 cm. These results suggest that over a 15–20-year period (1998–2017), MPs were accumulating at greater rates in Lake Ontario offshore sediment than in Lake Huron. This may be a result of higher inputs from the plastics industry sector, wastewater treatment plants, stormwater drains, and a greater number of people surrounding Lake Ontario (Ballent et al. 2016; Corcoran et al. 2020b; Grbić et al. 2020) (Fig. 1). This regional industry mix effect is supported by a visual inventory of plastic producers and manufacturers that showed 782 plastics-associated companies within 100 km of Lake Ontario, and only 193 within 100 km of Lake Huron (University of Toronto Art Centre 2021).
Anthropogenic particle morphologies differed between cores overall, with LH43 containing 75% fibres and 403A containing 69% fragments (Fig. 3). The average fibre abundance in the top 5 cm of LH43 was lower than the average fibre abundance in the subsurface slices, with 53.2 g−1 dw and 126.5 g−1 dw, respectively, whereas the opposite was seen in core 403A (60.4 g−1 dw in top 5 cm; 24.8 g−1 dw in subsurface slices). The causes of these morphological and depth discrepancies between cores are unknown, but the results suggest that the main sources of MPs and their timing of deposition into each lake differed. This suggests that controls such as population growth, waste water treatment plant development, inception of recycling programs, and plastic industry growth could have been responsible for regional variations in MP abundances over time.
The globally produced polymers, PE, PP, PET, PS, PAN, and nylon are used in a wide variety of plastic products and therefore, their presence in the sediment cores does not indicate specific sources. However, paint-related MPs (epoxy, PU, alkyds, and industrial coatings) compose 40% of all fragments randomly analyzed by FTIR in this study. Some paints are composed of PS and PET, possibly making the percentage even higher in our samples. Paint microchips in lake bottom sediment could be derived from antifouling paints used on boats to deter the encrustation of organisms on hulls. Boucher and Friot (2017) consider marine vessel coatings as one of the main categories of ocean plastic pollution. In addition, a review by Gaylarde et al. (2021) indicates that paint chips are prevalent in global waters, such as the Southern and Atlantic oceans, the Mediterranean and East China seas, and even in Arctic Ocean ice. In the late 1960s, tributyltin (TBT) began to be widely used in antifouling paints, causing serious side effects to non-targeted organisms (Yang and Maguire 2000). Regulations were introduced in Canada in 1989 to limit the use of TBT-containing paints on vessels. Anti-fouling paints containing TBTs were to be removed or encapsulated by 2008 (ECCC 2018), and by 2012, TBT was banned for use and sale in Canada. Nonetheless, the long residence time of TBT in sediment means that paint microchips may remain a threat to aquatic species in the Great Lakes. Bottom sediment samples from the Great Lakes watershed in North America have been shown to contain paint microparticles (Corcoran et al. 2020a; Belontz et al. 2022), and combined with the results of the present study, indicate that paints and other coatings are a significant source of MP pollution.
Conclusions
The sediment cores from offshore Lake Huron and Lake Ontario display an increasing trend in MP abundance from 1964 to 1989, which is consistent with the global plastic production rate, as well as with results from other investigations of MPs in sediment cores across the globe. Positive and negative anomalies in the MP abundance profiles appear to closely follow macroeconomic activities, such as the initial mass production of plastics and the occurrence of global recessions. The chronological patterns produced within the top 6 cm may however be a function of core smearing and bioturbation.
The range in MP abundances in each core, particularly since 2000, indicates that more plastic debris has been entering Lake Ontario than Lake Huron. This difference reflects the higher population density and plastic industry mix around the former lake compared to the latter. In addition, although agriculture characterizes parts of both watersheds, there are significantly more natural areas surrounding Lake Huron.
Although source apportionment of common polymers in microscopic form is notoriously challenging, we were able to attribute a minimum of 40% of the MP fragments analyzed by FTIR as paint-related particles. These particles are prominent in water bodies across the globe and may be derived from the hulls of vessels (ocean-based source) or from land-based vehicles, buildings, and other structures on which paints and coatings are used.
The results of this study indicate that MPs in offshore sediment cores can be considered future proxies for economic-related perturbations over time. If studied at finer scales (e.g., 0.5 cm thick core slices), the signals of regional factors may better appear in the core profiles. Regional factors may include varying recycling rates in different watersheds and changing inputs of plastic debris types through time, depending on production rates dictated by market demands. Finer scale variations in sediment-based MP pollution could also provide information concerning the timing of certain land-use practices, such as agriculture, transportation, and industry.
Acknowledgements
This project was supported by the Ontario Ministry of the Environment, Conservation and Parks (MECP) through the Ontario Great Lakes Strategy/Canada-Ontario Agreement on Great Lakes Water Quality and Ecosystem Health (project ID#2406). We express appreciation to Debbie Burniston and the staff of the Great Lakes field unit for providing sediment samples and dating information. We also thank the staff at INRS for providing isotopic data for the Lake Huron core. Finally, we would like to acknowledge Rebecca Sarazen from Surface Science Western for her assistance in FTIR training and interpretation.
References
Ballent A., Corcoran P.L., Madden O., Helm P.A., Longstaffe F.J. 2016. Sources and sinks of microplastics in Canadian Lake Ontario nearshore, tributary and beach sediment. Marine Pollution Bulletin, 110(1): 383–395.
Belontz S.L., Corcoran P.L., de Haan Ward J., Helm P.A., Marvin C. 2022. Factors driving the spatial distribution of microplastics in nearshore and offshore sediment of Lake Huron, North America. Marine Pollution Bulletin, 179: 113709.
Bergmann M., Wirzberger V., Krumpen T., Lorenz C., Primpke S., Tekman M.B., et al. 2017. High quantities of microplastic in Arctic deep-sea sediment from the HAUSGARTEN observatory. Environmental Science & Technology, 51(19): 11000–11010.
Boucher J., Friot D. 2017. Primary microplastics in the oceans: a global evaluation of sources. IUCN, Gland, Switzerland. 43p.
Brandon J.A., Jones W., Ohman M.D. 2019. Multidecadal increase in plastic particles in coastal ocean sediments. Science Advances, 5(9): 1–7.
Browne M.A., Galloway T.S., Thompson R.C. 2010. Spatial patterns of plastic debris along estuarine shorelines. Environmental Science & Technology, 44(9): 3404–3409.
Cable R.N., Beletsky D., Beletsky R., Wigginton K. 2017. Distribution and modeled transport of plastic pollution in the Great Lakes, the world’s largest freshwater resource. Frontiers in Environmental Science, 5: 1–18.
Chae Y., An Y.J. 2017. Effects of micro- and nanoplastics on aquatic ecosystems: current research trends and perspectives.Marine Pollution Bulletin, 124(2): 624–632.
Chant L.A., Cornett R.J. 1991. Smearing of gravity core profiles in soft sediments. Limnology & Oceanography, 36(7): 1492–1498.
Corcoran P.L. 2015. Benthic plastic debris in marine and freshwater environments. Environmental Science: Processes & Impacts, 17(8): 1363–1369.
Corcoran P.L., Norris T., Ceccanese T., Walzak M.J., Helm P.A., Marvin C.H. 2015. Hidden plastics of Lake Ontario, Canada and their potential preservation in the sediment record. Environmental Pollution, 204: 17–25.
Corcoran P.L., Belontz S.L., Ryan K., Walzak M.J. 2020a. Factors controlling the distribution of microplastic particles in benthic sediment of the Thames River, Canada. Environmental Science & Technology, 54(2): 818–825.
Corcoran P.L., de Haan Ward J., Arturo I.A., Belontz S.L., Moore T., Hill-Svehla C.M., et al. 2020b. A comprehensive investigation of industrial plastic pellets on beaches across the Laurentian Great Lakes and the factors governing their distribution. Science of The Total Environment, 747: 141227.
Courtene-Jones W., Quinn B., Ewins C., Gary S.F., Narayanaswamy B.E. 2020. Microplastic accumulation in deep-sea sediment from the Rockall Trough. Marine Pollution Bulletin, 154: 111092.
Dean B.Y., Corcoran P.L., Helm P.A. 2018. Factors influencing microplastic abundances in nearshore, tributary and beach sediment along the Ontario shoreline of Lake Erie. Journal of Great Lakes Research, 44(5): 1002–1009.
Duffie D. 2019. Prone to fail: the pre-crisis financial system. Journal of Economic Perspectives, 33(1): 81–106. Available from https://www.jstor.org/stable/26566978.
ECCC. 2018. Compendium of Canada’s engagement in international environmental agreements and instruments. In International Convention on the Control of Harmful Anti-fouling Systems on Ships (AFS). Available from https://publications.gc.ca/collections/collection_2019/eccc/en4-381/En4-381-1-16-2018-eng.pdf [accessed November 2023].
ECCC. 2019. Economic study of the Canadian plastic industry, markets and waste: summary report to Environment and Climate Change Canada [online]. Environment and Climate Change Canada. Available from https://publications.gc.ca/collections/collection_2019/eccc/En4-366-1-2019-eng.pdf.
Environmental Protection Agency. 2023. Facts and figures about the Great Lakes [online]. Available from https://www.epa.gov/greatlakes/facts-and-figures-about-great-lakes [accessed October 2023].
Filgueiras A.V., Gago J., Campillo J.A., León V.M. 2019. Microplastic distribution in surface sediment along the Spanish Mediterranean continental shelf. Environmental Science and Pollution Research, 26: 21264–21273.
Gaylarde C.C., Baptista Neto J.A., Monteiro da Fonseca E. 2021. Paint fragments as polluting microplastics: a brief review. Marine Pollution Bulletin, 162, 111847.
Geyer R., Jambeck J.R., Law K.L. 2017. Production, use, and fate of all plastics ever made. Science Advances, 3(7): 25–29.
Government of Canada. 2018. Sector profile—Canadian plastics processing sector overview. Available from https://natural-resources.canada.ca/energy/efficiency/industry/technical-info/benchmarking/plastics/5221 [accessed November 2023].
Grbić J., Helm P., Athey S., Rochman C.M. 2020. Microplastics entering northwestern Lake Ontario are diverse and linked to urban sources. Water Research, 174.
Hammer J., Kraak M.H.S., Parsons J.R. 2012. Preface. In Reviews of environmental contamination and toxicology.
Hoffman M.J., Hittinger E. 2017. Inventory and transport of plastic debris in the Laurentian Great Lakes. Marine Pollution Bulletin, 115(1–2): 273–281.
Hou L., McMahan C.D., McNeish R.E., Munno K., Rochman C.M., Hoellein T.J. 2021. A fish tale: a century of museum specimens reveal increasing microplastic concentrations in freshwater fish. Ecological Applications, 31(5): 1–14.
Hülse D., Vervoort P., van de Velde S.J., Kanzaki Y., Boudreau B., Arndt S., et al. 2022. Assessing the impact of bioturbation on sedimentary isotopic records through numerical models. Earth-Science Reviews, 234: 104213.
Kane I.A., Clare M.A. 2019. Dispersion, accumulation, and the ultimate fate of microplastics in deep-marine environments: a review and future directions. Frontiers in Earth Science, 7: 80.
Leiser R., Schumann M., Dadi T., Wendt-Potthoff K. 2021. Burial of microplastics in freshwater sediments facilitated by iron-organo flocs. Scientific Reports, 11: 24072.
Lenaker P.L., Corsi S.R., Mason S.A. 2020. Spatial distribution of microplastics in surficial benthic sediment of Lake Michigan and Lake Erie. Environmental Science & Technology, 55(1): 373–384.
Mao R., Song J., Yan P., Ouyang Z., Wu R., Liu S., Guo X. 2021. Horizontal and vertical distribution of microplastics in the Wuliangsuhai Lake sediment, northern China. Science of the Total Environment, 754: 142426.
Margeson J. 2000. Canadian plastic product industry. Industry Canada, Plastics. Available from https://publications.gc.ca/collections/collection_2021/isde-ised/iu44/Iu44-153-2000-eng.pdf [accessed January 2024].
Matsuguma Y., Takada H., Kumata H., Kanke H., Sakurai S., Suzuki T., et al. 2017. Microplastics in sediment cores from Asia and Africa as indicators of temporal trends in plastic pollution. Archives of Environmental Contamination and Toxicology, 73: 230–239.
McCormick A., Hoellein T.J., Mason S., Schluep J., Kelly J.J. 2014. Microplastic is an abundant and distinct microbial habitat in an urban river. Environmental Science & Technology, 48(20): 11863–11871.
Niu L., Li Y.Y., Li Y.Y., Hu Q., Wang C., Hu J., et al. 2021. New insights into the vertical distribution and microbial degradation of microplastics in urban river sediment. Water Research, 188.
Our World in Data. 2023. Global plastics production. Available from https://ourworldindata.org/grapher/global-plastics-production [accessed November 2023].
Ray D.M., MacLachlan I., Lamarche R., Srinath K.P. 2017. Economic shock and regional resilience: continuity and change in Canada’s regional employment structure, 1987–2012. Environment and Planning, 49: 952–973.
Rillig M.C., Ziersch L., Hempel S. 2017. Microplastic transport in soil by earthworms. Scientific Reports, 7: 1–6.
Rochman C.M., Lewison R.L., Eriksen M., Allen H., Cook A.M., Teh S.J. 2014. Polybrominated diphenyl ethers (PBDEs) in fish tissue may be an indicator of plastic contamination in marine habitats. Science of the Total Environment, 476–477: 622–633.
Simon-Sánchez L., Grelaud M., Lorenz C., Garcia-Orellana J., Vianello A., Liu F., et al. 2022. Can a sediment core reveal the plastic age? Microplastic preservation in a coastal sedimentary record. Environmental Science & Technology, 56(23): 16780–16788.
Smith M., Love D.C., Rochman C.M., Neff R.A. 2018. Microplastics in seafood and the implications for human health. Current Environmental Health Reports, 5: 375–386.
The World Bank. 2024. GDP growth (annual %)—Canada. World Bank Group. Available fromhttps://data.worldbank.org/indicator/NY.GDP.MKTP.KD.ZG?locations=CA [accessed January 2024].
Turner S., Horton A.A., Rose N.L., Hall C. 2019. A temporal sediment record of microplastics in an urban lake, London, UK. Journal of Paleolimnology, 61: 449–462.
University of Toronto Art Centre. 2021. Plastic heart: surface all the way through. Poster. All of the Known Plastic Producers in the Great Lakes Region, Toronto, Ontario, Canada. Available from https://artmuseum.utoronto.ca/exhibition/plastic-heart/ [accessed January 2024].
Vethaak A.D., Legler J. 2021. Microplastics and human health. Science, 371(6530): 672–674.
Waldschläger K., Schüttrumpf H. 2020. Infiltration behavior of microplastic particles with different densities, sizes, and shapes—from glass spheres to natural sediment. Environmental Science & Technology, 54(15): 9366–9373.
Yang F., Maguire R.J. 2000. Occurrence and seasonal variation of tributyltin in Marinas on Lake Ontario, Canada. Water Quality Research Journal, 35(4): 681–692.
Zhang W., Morales V.L., Cakmak M.E., Salvucci A.E., Geohring L.D., Hay A.G., et al. 2010. Colloid transport and retention in unsaturated porous media: effect of colloid input concentration.Environmental Science & Technology, 44(13): 4965–4972.
Zheng Y., Li J., Cao W., Jiang F., Zhao C., Ding H., et al. 2020. Vertical distribution of microplastics in bay sediment reflecting effects of sedimentation dynamics and anthropogenic activities. Marine Pollution Bulletin, 152: 110885.
Supplementary material
Supplementary Material 1 (DOCX / 27.1 KB).
- Download
- 27.12 KB
Information & Authors
Information
Published In
FACETS
Volume 9 • 2024
Pages: 1 - 10
Editor: Christoph E. Geiss
History
Received: 4 April 2023
Accepted: 5 February 2024
Version of record online: 18 June 2024
Copyright
© 2024 The Author(s). This work is licensed under a Creative Commons Attribution 4.0 International License (CC BY 4.0), which permits unrestricted use, distribution, and reproduction in any medium, provided the original author(s) and source are credited.
Data Availability Statement
The following Supplementary Material is available with the article through the journal website: Supplementary Material Table 1.
Full details of the microplastic particles in cores LH43 and 403A are available in the appendices from the Ph.D. dissertation of SLB: https://ir.lib.uwo.ca/cgi/viewcontent.cgi?article=10306&context=etd.
Key Words
Sections
Subjects
Plain Language Summary
Relating microplastic counts in sediment cores to macroeconomic variations within the last century
Authors
Author Contributions
Conceptualization: SLB, PLC, PAH, CM
Data curation: CM
Formal analysis: SLB, LK
Funding acquisition: PLC, PAH
Investigation: SLB, PLC, LK, PAH, CM
Methodology: SLB, LK, CM
Project administration: PLC, PAH
Resources: PLC, PAH, CM
Software: PLC
Supervision: PLC, PAH
Validation: PLC, LK
Visualization: PLC
Writing – original draft: SLB
Writing – review & editing: PLC, PAH, CM
Competing Interests
The authors declare there are no competing interests.
Funding Information
Ontario Ministry of the Environment, Conservation and Parks
Metrics & Citations
Metrics
Other Metrics
Citations
Cite As
Sara L. Belontz, Patricia L. Corcoran, Linda Kimpe, Paul A. Helm, and Chris Marvin. 2024. A temporal record of microplastic accumulation in sediment cores of the Great Lakes, North America, reflects macroeconomic and regional influences. FACETS.
9: 1-10.
https://doi.org/10.1139/facets-2023-0057
Export Citations
If you have the appropriate software installed, you can download article citation data to the citation manager of your choice. Simply select your manager software from the list below and click Download.
Cited by
1.
2. Potential role of microplastic in sediment as an indicator of Anthropocene
3. Plastics and the anthropocene