Open access

A pilot bioavailable strontium isotope baseline map of Southern British Columbia, Canada

Publication: FACETS
24 July 2024

Abstract

Strontium isotopes are used for provenience and mobility studies in archaeology, ecology, and forensic studies, and rely on accurate baseline maps that are used to compare and interpret human and animal strontium ratios. Here, we present a bioavailable 87Sr/86Sr map, also called an isoscape, for southern British Columbia derived from modern plant samples’ 87Sr/86Sr ratios. We sampled 67 medium root depth plants over a 900 km transect from the southern BC coast to inland BC to capture the natural 87Sr/86Sr ratios of plants along the four major geological belts in British Columbia. Non-parametric Kruskal–Wallis and pairwise Wilcox tests were used to examine whether the geological belts had statistically significant mean differences. It was found that the province could be effectively divided into east and west, with the Coastal–Intermontane and Omineca–Foreland regions having statistically different means from each other. 87Sr/86Sr ratios had statistically significant relationships with salt deposition, volcanic deposition, and mean age of the underlying lithology. Generally, 87Sr/86Sr ratios increased with distance from the coast as the atmospheric input of radiogenic strontium from marine-derived rainwater decreased and the input of radiogenic strontium isotopes from the underlying geology of the Rockies in the far east of the province increased.

Introduction

Strontium isotope analysis has become an increasingly useful technique in geology, ecology, archaeology, and forensic science (Price et al. 2002; Hodell et al. 2004; Evans et al. 2010; Copeland et al. 2011; Makarewicz and Sealy 2015; Bataille et al. 2018; Emery et al. 2018; Holt et al. 2021; Kramer et al. 2022). Often, strontium analysis is used to study the geographic origin of materials or individuals (Bentley 2006; Holt et al. 2021), and uses the 87Sr/86Sr ratio, which is the ratio of the heavier and more rare strontium-87 to the lighter and more abundant strontium-86 (Holt et al. 2021). The method compares the local bioavailable 87Sr/86Sr ratios to the 87Sr/86Sr ratios of human or animal tissues, usually enamel, to infer whether they were local or non-local, and where they may have migrated from (see Bentley (2006), Coelho et al. (2017), and Holt et al. (2021) for comprehensive reviews).
In archaeology, 87Sr/86Sr ratios have been used to predict whether an individual is local or non-local to a region (whether their 87Sr/86Sr ratio is similar to the bioavailable 87Sr/86Sr ratios where they were buried) (Bentley 2006; Holt et al. 2021). In forensic science, it can be used to estimate a person’s mobility or to exclude possible countries of origin on a global scale (Bartelink and Chesson 2019). It has been used in food forensics to authenticate and provenance food (Kramer et al. 2022). Lastly, for ecology, it has been used to study the migration of animals throughout a landscape (Wooller et al. 2021).

The strontium cycle

87Sr is an isotope created through the radiogenic decay of 87Rb, with a half-life of 9.23 × 10⁹ years (Coelho et al. 2017). Therefore, the bedrock 87Sr/86Sr is predictable based on lithology and age of the unit (Bataille and Bowen 2012; Holt et al. 2021). However, 87Sr/86Sr ratios of soil and subsequent materials are also influenced by bedrock weathering, fertilizers, soil composition, rivers/streams, and, importantly, atmospheric input (rain and dust) (Böhlke and Horan 2000; Probst et al. 2000; Price et al. 2002; Bentley 2006; Maurer et al. 2012; Hartman and Richards 2014; Makarewicz and Sealy 2015; Bataille et al. 2020; Holt et al. 2021). Strontium is introduced to an environment through the weathering of rocks (Capo et al. 1998). Strontium is introduced to the ocean by rivers and streams, and has a 87Sr/86Sr ratio of ˜0.7092 (Capo et al. 1998; McArthur et al. 2001). Once in the ocean, strontium is cycled through the formation of oceanic carbonates or into the atmosphere through evaporation (Capo et al. 1998). As Sr is weathered from rocks into soil and brought by atmospheric deposition, plants absorb the element, where it is then introduced to the food chain (Capo et al. 1998). Once in the food chain, there is a slight fractionation between consumer and diet; however, during the data normalization, this fractionation is lost in the correction (Knudson et al. 2010; Lewis et al. 2017).

Strontium isotopes and provenience

Bedrock 87Sr/86Sr ratios may not represent the total strontium isotopes available to plants and animals. Thus, the distinction is made between geological bedrock strontium isotope ratios and “bioavailable” strontium which is total strontium isotopes from all sources available to plants and animals (Bentley 2006). Bioavailable strontium is the 87Sr/86Sr ratio of the available strontium in an environment that is incorporated into living organisms (Probst et al. 2000; Price et al. 2002; Bentley 2006). Due to its similar atomic size and properties, strontium is incorporated into living tissues in place of calcium (Price et al. 2002; Bentley 2006). An organism’s 87Sr/86Sr ratio is the average of all strontium sources available to it within its environment (bedrock weathering, rain, fertilizers, and dust). Mass-dependant fractionation occurs in nature for strontium; however, it is significantly smaller relative to light elements like carbon or nitrogen (Fietzke and Eisenhauer 2006; Knudson et al. 2010; Lewis et al. 2017). As the fractionation between consumer-diet is lost during data normalization, plant 87Sr/86Sr ratios can provide a valuable baseline for studying the provenience of materials and individuals (Knudson et al. 2010; Lewis et al. 2017). Baseline maps are often produced using bioavailable strontium as it is more applicable to ecology, archaeology, and the forensic sciences. However, using geological strontium, water strontium, and strontium from other sources are often complementary (Hodell et al. 2004).
Advanced models such as random forest regression permit more complex statistical analysis to better predict bioavailable 87Sr/86Sr ratios (Bataille et al. 2020; Holt et al. 2021). 87Sr/86Sr maps, or “isoscapes,” have been developed to predict the bioavailable 87Sr/86Sr ratios throughout the globe (Bataille et al. 2020). While these models have a high degree of accuracy for readily sampled regions, more data from underrepresented regions—such as Canada—increase their accuracy. As highlighted in Holt et al. 2021, these models incorporate data from many sources, which can reduce its applicability to some disciplines. The global 87Sr/86Sr map created by Bataille et al. (2020) includes datasets likely impacted by contemporary fertilization, which may decrease its applicability to archaeology (Holt et al. 2021). Here, we attempt to provide a more neutral baseline by sampling plants in national and provincial parks to reduce the potential anthropogenic impact so that this map may be valid for both modern and archaeological studies.

Strontium mapping methods

Strontium isoscapes have been made using primarily three different methods: domain mapping, Bayesian continuous approach, and machine learning (Bataille et al. 2018; Holt et al. 2021). Domain mapping, or the nominal approach, uses the average 87Sr/86Sr ratios for discrete geological areas to create isoscapes (Bataille et al. 2018; Holt et al. 2021). Geostatistical methods often include inverse distance weight and kriging (Holt et al. 2021). These models use geostatistics to extrapolate from 87Sr/86Sr ratios of sampling locations to continuous distributions across the landscape (Holt et al. 2021). A problem with these models, which is relevant for this study, is the smoothing of 87Sr/86Sr ratios over complex lithological zones (Holt et al. 2021). As British Columbia has a complex geological history, with hundreds of discrete geological zones, data smoothing will be a source of error when considering this map for provenience application. Machine learning methods, usually random forest, have become a powerful tool for the development of isoscapes, permitting the use of categorical and continuous variables to be used in the prediction of the map (Holt et al. 2021). However, these models often require large datasets that may not be relevant or appropriate for different research questions (Holt et al. 2021).

Why strontium in BC

British Columbia is an ideal location to study 87Sr/86Sr ratios spatially as it has complex underlying geology, geology dating from the Cenozoic to the Proterozoic, and many mountain ranges impacting weather patterns. It is anticipated that there will be a large variability for 87Sr/86Sr plant ratios, which would provide a useful baseline for the increasing number of archaeological, ecological, and forensic investigations of provenience within the province.

Materials and methods

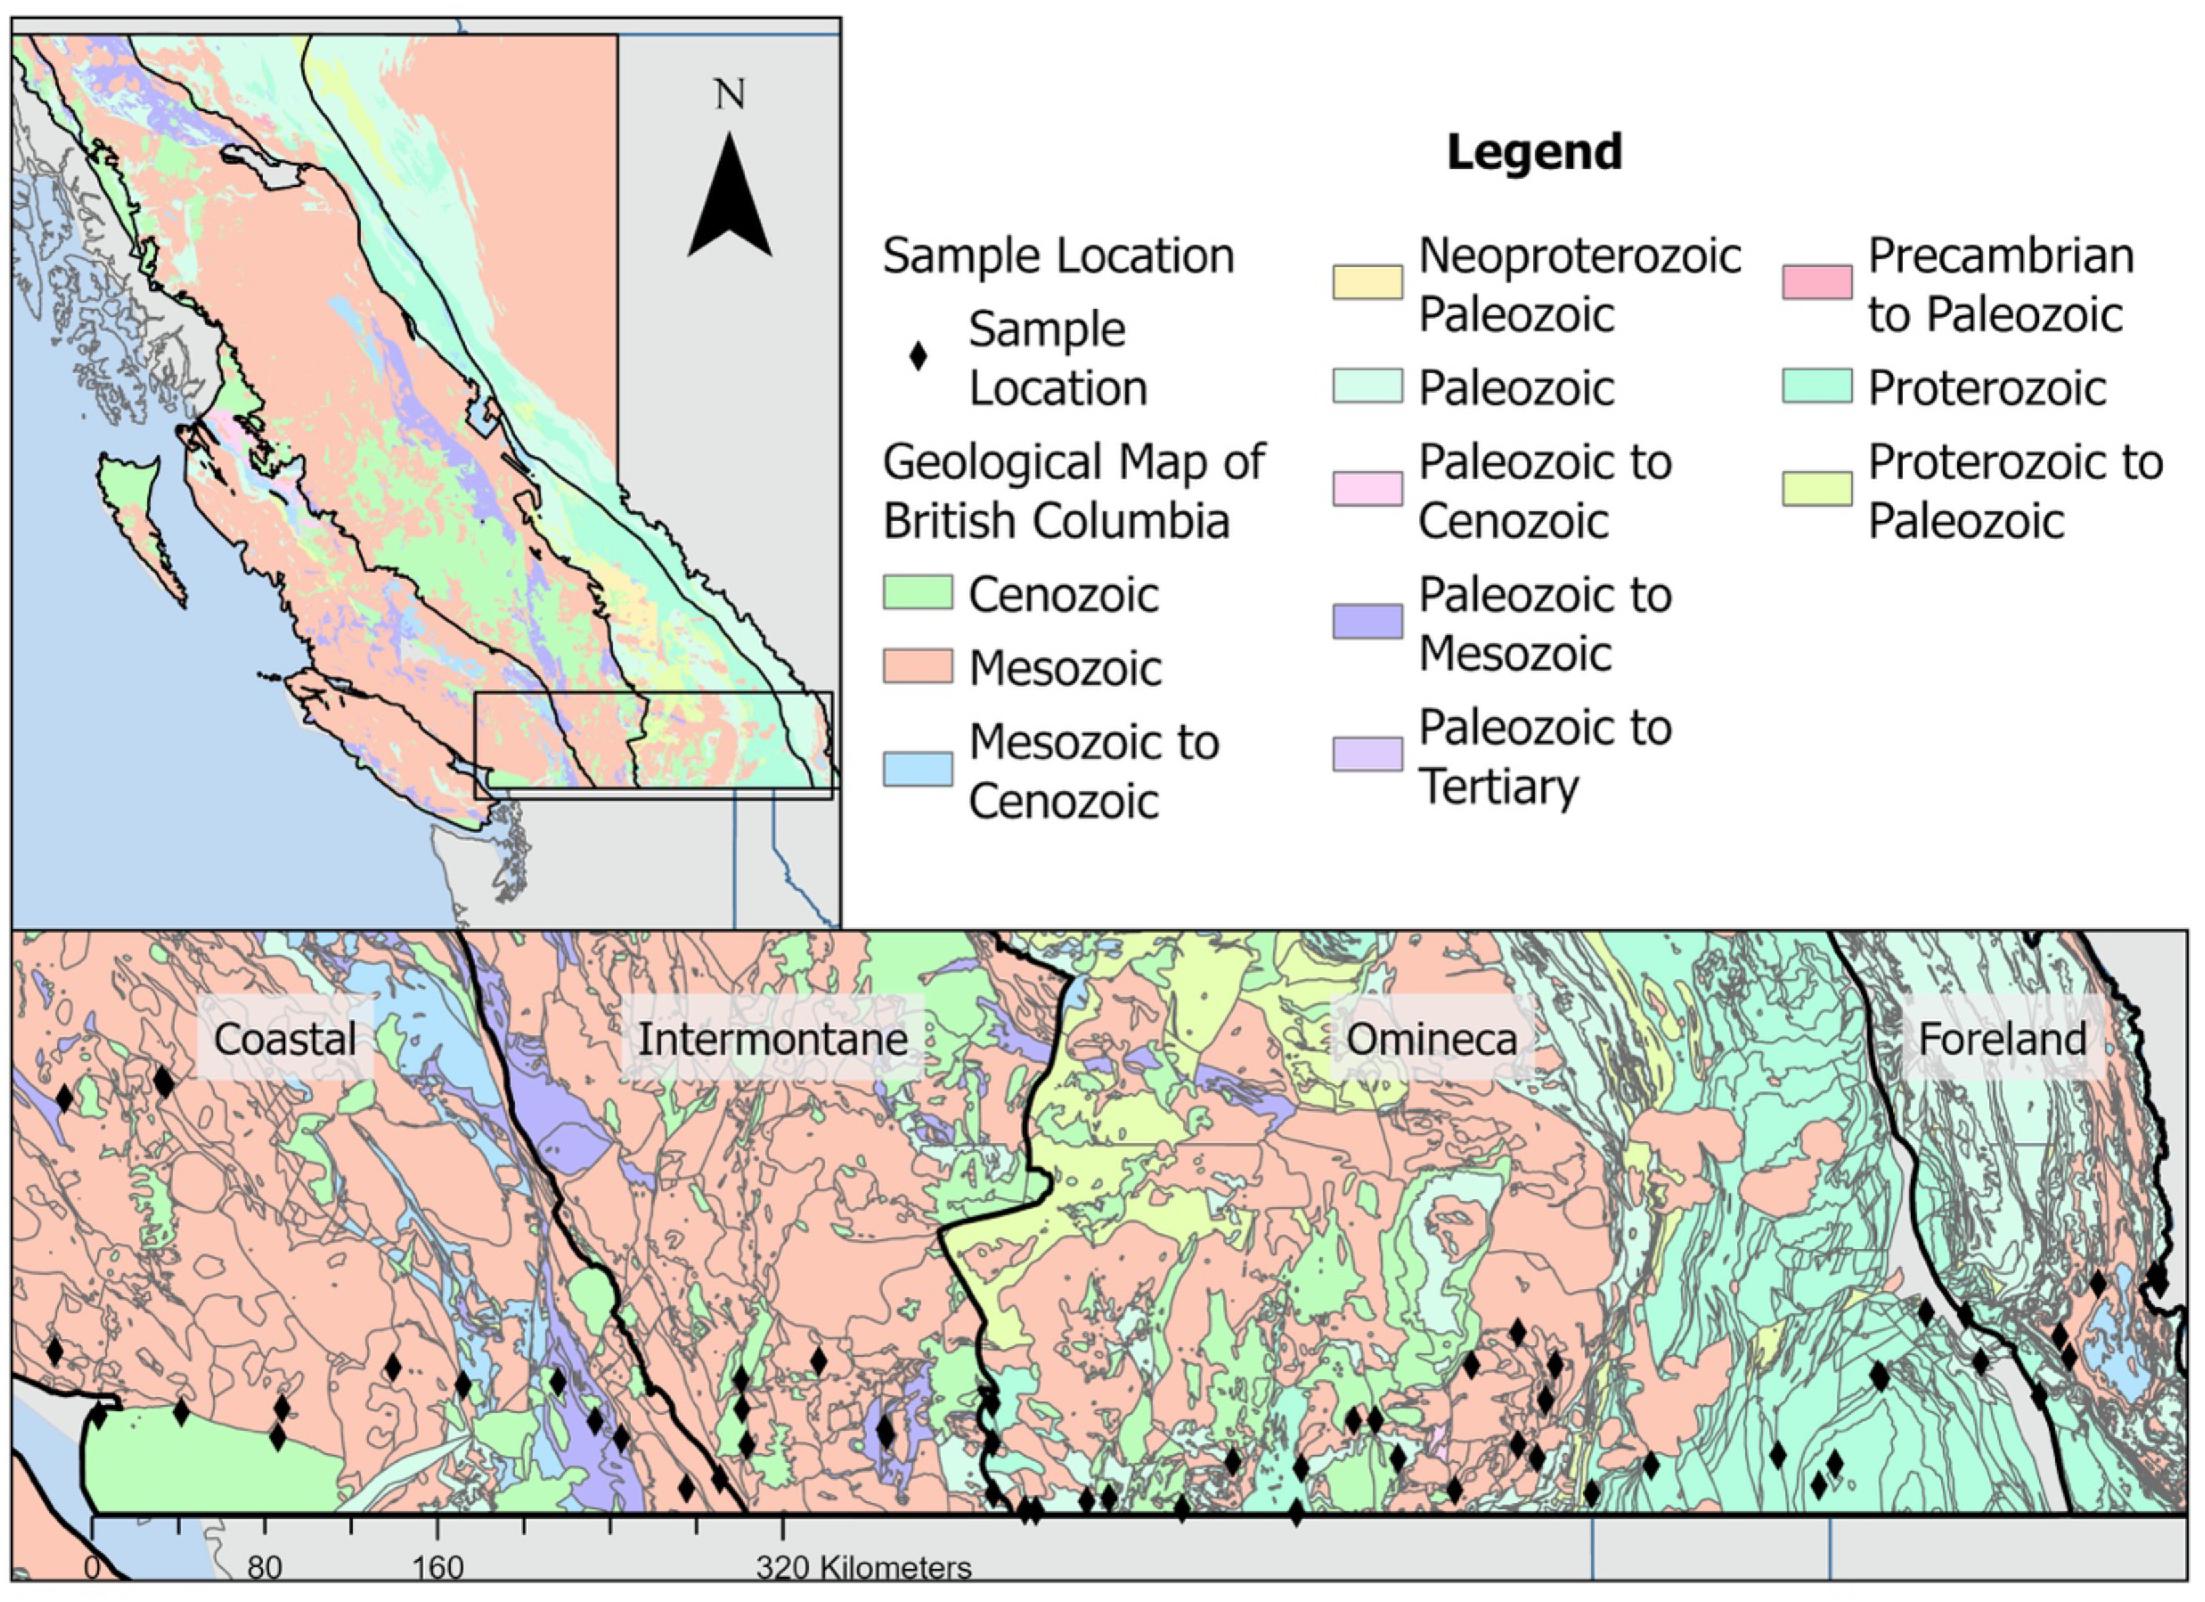
This study uses plants with medium root lengths, such as shrubs or bushes (see Supplementary material A for plant species collected (R)). Medium root depth was selected because these plants were consistently available throughout the sampling region and reflected 87Sr/86Sr influences from bedrock weathering and atmospheric input (Probst et al. 2000; Bentley 2006; Hartman and Richards 2014). Samples analyzed were mainly found in provincial parks to decrease the likelihood of modern fertilizers influencing the 87Sr/86Sr ratios (see Fig. 1 and Suplementary material A for sampling locations, and Tables 14 for underlying geology at sampling locations). While this map may be useful for archaeology, ecology, and forensic sciences as it uses plants that likely have less impact from contemporary fertilizers, it may have decreased accuracy for modern populations.
Fig. 1.
Fig. 1. A map of the age of British Columbia’s bedrock geology, with the Coastal, Intermontane, Omineca, and Foreland belts, and sampling locations. Open access data from the British Columbia geological survey, version 2019-12-19 (Cui et al. 2017). Base layers (world and administrative boundaries from https://www.naturalearthdata.com/).

Sampling locations and British Columbia’s geologic history

A simplified overview of the bedrock geology of British Columbia is given in Fig. 1. A detailed review of the province’s bedrock geologies and physiography is outside this paper’s scope. For more detailed discussions, please see Church and Ryder (2010) and the references therein.
To briefly summarize the geology of British Columbia, the province can be divided into five geological belts, Insular (Vancouver Island and Haida Gwaii); Coastal (the coastal mountain range); Intermontane (the plateau between the coastal and Omineca/Foreland mountains); Omineca (the western mountain ranges parallel to the rocky mountains); and the Foreland belt (the rocky mountain range) (see Fig. 1 for the belts within the study region) (Church and Ryder 2010; Cannings et al. 2011; Pattison et al. 2020).

Coastal belt

The Coastal belt is primarily comprised of intrusive igneous rocks (dioritic, granodioritic, and quartz diorite) and foliated metamorphic (greenstone, greenschist metamorphic rocks, and orthogneiss metamorphic) rocks with smaller outcrops of faulted and folded lava and sedimentary rocks in the northeast of the province (Church and Ryder 2010; Cui et al. 2017). Along the southern border within this study area, the Intermontane belt is predominantly intrusive igneous (granodioritic intrusive rocks and dioritic intrusive rocks) with small outcrops of faulted and folded sedimentary (Church and Ryder 2010; Cui et al. 2017).

Intermontane belt

The intermontane belt is dominated by plateaus of flat-lying lava and faulted and folded lava (basalt, andesite, and rhyolite) and sedimentary rocks (limestone, marble, calcareous sedimentary rocks, mudstone, siltstone, and shale) (Church and Ryder 2010; Cui et al. 2017).

Omineca

In the mountainous regions of the Omineca belt, the rocks are typically faulted and folded sedimentary rocks (limestone, marble, calcareous sedimentary, mudstone, siltstone, shale fine clastic sedimentary, quartzite, and quartz arenite sedimentary rocks), with small outcrops of intrusive igneous and foliated metamorphic (Church and Ryder 2010).

Foreland

The Foreland belt is composed of faulted and folded sedimentary rocks (dolomitic carbonate rocks, mudstone, siltstone, shale fine clastic sedimentary rocks, slate, siltstone, and argillite) with outcrops of limestone in the Rocky Mountains, while the Alberta plateau is flat-lying sedimentary (Church and Ryder 2010). We expect that the Rocky mountain ranges will have the most elevated 87Sr/86Sr ratios as the rocks that formed into the mountain range are dated to the Proterozoic. In contrast, the majority of the other bedrocks within the province were formed during the Mesozoic and Cenozoic.

Sample preparation and strontium isotope analysis

The plant samples were cleaned with purified (using a milliQ) water in an ultrasonic bath, rinsed three times with deionized H2O (18.3 mol/LΩ), and dried overnight at 105 °C. All glassware used for sample pretreatment and calcining was leached overnight in 5% ultrapure HNO3. A target mass of 0.4 g for Pinus, 0.05 g for Juniperus, Ephedra, and Purshia, and 0.25 g for any other genus was isolated and ground in an agate mortar. The samples were then calcined at 650 °C for 6 h and transferred in plastic tubes.
Prior to dissolution, the samples were dried at 105 °C overnight, transferred in a PFA vial (Savillex), and weighed. Acid digestions were achieved using a 2 mL 14 N HNO3 Optima and 1 mL 24 N HF trace metal grade solution heated at 110 °C for 24 h. The solutions were evaporated at 90 °C overnight and the dried residues redissolved in 1 mL 14 N HNO3 Optima. Solutions were evaporated before the strontium extraction. The strontium was extracted using EiChrom Sr-SpecTM following a protocol adapted from De Muynck et al. (2009). The strontium isotope analysis was conducted on a Nu Plasma II (Nu Instruments) multi collector—inductively coupled plasma—mass spectrometer in operation at Missouri University Research Reactor (MURR). The reference material SRM987 was run multiple times at the beginning of each session and after every other sample. All solutions were prepared to obtain approximately 150 ppb Sr. Ratios were corrected for mass bias and mass interferences of 84Kr, 86Kr, and 87Rb. The ratios measured in the samples were further corrected by standard bracketing using the recommended ratios for SRM 987 and SRM 1400 (Thirlwall 1991; De Muynck et al. 2009). The ratios obtained for the SRM987 (n = 73) are 0.71026 ± 3 (2SD). To further evaluate the reproducibility of the data, the reference material SRM1400 (bone ash) was measured multiple times (n = 14) together with the samples at the beginning and at the end of each analytical session. The ratios obtained for SRM1400 are 0.71312 ± 3 (2SD), which corresponds to the range of ratios measured at MURR (Burlot et al. 2022) and by De Muynck et al. (2009).

Statistical analysis

Descriptive and statistical analysis was completed using RStudio version Version 2023.12.0 + 369. Domain mapping was not selected for this study as British Columbia has a complex geological history, and even if each sample represented a geologic zone, it would be a fraction of the total geologic zones within the province. Random forest models were also not selected due to the limited data set. As this is an initial exploration of bioavailable 87Sr/86Sr ratios in British Columbia, more sophisticated models will be developed as more data become available. Thus, the isoscape was developed using the continuous Bayesian approach, specifically the Empirical Bayesian Kriging function in ArcGIS Pro Version 3.1, which was selected because it permitted a standard error map to be generated alongside the isoscape.
Importantly, Empirical Bayesian Kriging runs simulations of semi-variograms to adjust the parameters at each subset (or polygon) (Krivoruchko and Gribov 2019); in this model, we ran 1000 simulations with a subset size of 20. This calculates variograms at each polygon, permitting the estimated processes to be more locally defined. As our data follows a 900 km transect with a low sampling density, using locally defined data rather than the entire dataset yielded a more accurate predictive model. Therefore, there is no single nugget value, semi-variogram shape, or other attributes to explain the model; instead, they are re-predicted at each subset for a more accurate prediction of local values (Krivoruchko and Gribov 2019). This permits the model to highlight where spatial autocorrelation may effectively visualize data and where it cannot. Areas with increased error could be due to increased 87Sr/86Sr isotope ratio variability within a polygon, where spatial auto correlation fails to effectively predict strontium isotope ratios. As our data were non-normal, we transformed the data using the empirical transformation and used the K-Bessel semi-variogram with minimum neighbors set to 10 and maximum to 15. Importantly, kriging assumes spatial autocorrelation, which results in data smoothing along the landscape, which may incorrectly reflect 87Sr/86Sr ratios as geologic zones are often sharply delineated (Holt et al. 2021).
Strontium ratios were correlated with distance from the coast, salt deposition, and the mean age of the underlying lithology (see Supplementary material B, and Table 5). Logarithmic transformations were done on salt deposition, the mean age of the underlying lithology, and volcanic deposition as they had non-normal distributions. Kendall’s Tau was chosen as the association test because it can handle monotonic transformations (such as logarithmic).
Table 1.
Table 1. Description of underlying geology where samples were collected in the Coastal Belt, including the sample ID, the geological belt, the primary rock class and description, and the era of the geological zone.
SampleBeltRock classRock descriptionEra
BC-M-1CoastIntrusiveGranodioritic intrusive rocksCenozoic
BC-M-2CoastVolcanicMalfic Basalt Volcanic RocksPaleozoic to Mesozoic
BC-M-3CoastSedimentaryUndivided sedimentary rocks; basaltic volcanic rocks; granodioritic intrusive rocks;Paleozoic to Mesozoic
BC-M-4CoastSedimentaryUndivided sedimentary rocksMesozoic
BC-M-5CoastSedimentaryCoarse clastic sedimentary rocks; tonalite intrusive rocksMesozoic
BC-M-21CoastVolcanicMalfic Basalt Volcanic RocksPaleozoic to Mesozoic
BC-M-57CoastVolcanicAndesitic volcanic rocksMesozoic
BC-M-58CoastIntrusiveQuartz dioritic intrusive rocksMesozoic
BC-M-59CoastSedimentaryUndivided sedimentary rocksCenozoic
BC-M-60CoastSedimentaryMarine sedimentary and volcanic rocksMesozoic
BC-M-61CoastSedimentaryMarine sedimentary and volcanic rocksMesozoic
BC-M-63CoastSedimentaryUndivided sedimentary rocksCenozoic
BC-M-64CoastIntrusiveQuartz dioritic intrusive rocksMesozoic
BC-M-64RBCoastIntrusiveQuartz dioritic intrusive rocksMesozoic
BC-M-65CoastIntrusiveGranodioritic intrusive rocksMesozoic
BC-M-66CoastSedimentaryUndivided sedimentary rocksCenozoic
WH-M-3CoastVolcanicAndesitic volcanic rocksMesozoic
WH-M-4CoastVolcanicAndesitic volcanic rocksMesozoic

Note: See Supplementary material A for more information and 87Sr/86Sr ratios for samples. Open data from Cui et al. (2017).

Table 2.
Table 2. Description of underlying geology where samples were collected in the Intermontane Belt, including the sample ID, the geological belt, the primary rock class and description, and the era of the geological zone.
SampleBeltRock classRock descriptionEra
BC-M-6IntermontaneVolcanicMafic basaltic volcanic rocksMesozoic
BC-M-7IntermontaneVolcanicAndesitic volcanic rocks (locally mafic and felsicCenozoic
BC-M-8IntermontaneSedimentaryUndivided sedimentary rocks; undivided volcanic rocksCenozoic
BC-M-9IntermontaneIntrusiveQuartz dioritic intrusive rocksMesozoic
BC-M-10IntermontaneSedimentaryChert, siliceous argillite, siliciclastic rocksPaleozoic to Mesozoic
BC-M-11IntermontaneSedimentaryChert, siliceous argillite, siliciclastic rocks; marine sedimentary and volcanic rocksPaleozoic to Mesozoic
BC-M-12IntermontaneSedimentaryChert, siliceous argillite, siliciclastic rocksPaleozoic to Mesozoic
BC-M-13IntermontaneSedimentaryChert, siliceous argillite, siliciclastic rocksPaleozoic to Mesozoic
BC-M-15IntermontaneIntrusiveGranodioritic intrusive rocks; greenstone, greenschist metamorphic rocksMesozoic

Note: See Supplementary material A for more information and 87Sr/86Sr ratios for samples. Open data from Cui et al. (2017).

Table 3.
Table 3. Description of underlying geology where samples were collected in the Omineca Belt, including the sample ID, the geological belt, the primary rock class and description, and the era of the geological zone.
SampleBeltRock classRock descriptionEra
BC-M-17OminecaIntrusiveGranite, alkali feldspar granite intrusive rocksMesozoic
BC-M-18OminecaIntrusiveGranite, alkali feldspar granite intrusive rocksMesozoic
BC-M-19OminecaMetamorphicGreenstone, greenschist metamorphic rocksPaleozoic
BC-M-20OminecaSedimentaryMudstone, siltstone, shale fine clastic sedimentary rocks; syenitic to monzonitic intrusiveCenozoic
BC-M-22OminecaVolcanicUndivided volcanic rocksCenozoic
BC-M-23OminecaVolcanicUndivided volcanic rocks; undivided sedimentary rocksCenozoic
BC-M-24OminecaMetamorphicParagneiss metamorphic rocksProterozoic
BC-M-25OminecaIntrusiveGranite, alkali feldspar granite intrusive rocksMesozoic
BC-M-26OminecaIntrusiveGranite, alkali feldspar granite intrusive rocksMesozoic
BC-M-27 BOminecaIntrusiveSyenitic to monzonitic intrusive rocksCenozoic
BC-M-28 BOminecaIntrusiveSyenitic to monzonitic intrusive rocksCenozoic
BC-M-29OminecaSedimentaryMudstone, siltstone, shale fine clastic sedimentary rocks; basaltic volcanic rocksMesozoic
BC-M-30OminecaIntrusiveGranite, alkali feldspar granite intrusive rocksMesozoic
BC-M-31OminecaSedimentaryDolomitic carbonate rocks; argillite, greywacke, wacke, conglomerate turbiditesProterozoic
BC-M-32OminecaSedimentaryLimestone, slate, siltstone, argillitePaleozoic
BC-M-39 BOminecaSedimentaryArgillite, greywacke, wacke, conglomerate turbiditesProterozoic
BC-M-40OminecaSedimentaryDolomitic carbonate rocks; argillite, greywacke, wacke, conglomerate turbiditesProterozoic
BC-M-41OminecaSedimentaryArgillite, greywacke, wacke, conglomerate turbiditesProterozoic
BC-M-42OminecaSedimentaryArgillite, greywacke, wacke, conglomerate turbiditesProterozoic
BC-M-43OminecaSedimentaryArgillite, greywacke, wacke, conglomerate turbiditesProterozoic
BC-M-45OminecaSedimentaryArgillite, greywacke, wacke, conglomerate turbiditesProterozoic
BC-M-46OminecaSedimentaryQuartzite, quartz arenite sedimentary rocks; granodioritic intrusive rocksProterozoic
BC-M-47OminecaVolcanicBasaltic volcanic rocks; feldspar porphyritic intrusive rocks (mafic)Mesozoic
BC-M-48OminecaSedimentaryLimestone, slate, siltstone, argilliteMesozoic
BC-M-49OminecaIntrusiveGranodioritic intrusive rocksMesozoic
BC-M-50OminecaVolcanicBasaltic volcanic rocks (mafic)Mesozoic
BC-M-51OminecaIntrusiveGranodioritic intrusive rocks; limestone, slate, siltstone, argilliteMesozoic
BC-M-52OminecaMetamorphicParagneiss metamorphic rocksProterozoic
BC-M-53OminecaMetamorphicParagneiss metamorphic rocksProterozoic
BC-M-27 AOminecaIntrusiveSyenitic to monzonitic intrusive rocksCenozoic
BC-M-28 AOminecaIntrusiveSyenitic to monzonitic intrusive rocksCenozoic
BC-M-39 AOminecaSedimentaryArgillite, greywacke, wacke, conglomerate turbiditesProterozoic

Note: See Supplementary material A for more information and 87Sr/86Sr ratios for samples. Open data from Cui et al. (2017).

Table 4.
Table 4. Description of underlying geology where samples were collected in the Foreland Belt, including the sample ID, the geological belt, the primary rock class and description, and the era of the geological zone.
SampleBeltRock classRock descriptionEra
BC-M-33ForelandSedimentaryUndivided sedimentary rocksProterozoic
BC-M-34ForelandSedimentaryUndivided sedimentary rocksMesozoic
BC-M-35ForelandSedimentaryUndivided sedimentary rocksMesozoic
BC-M-36ForelandSedimentaryUndivided sedimentary rocks; mudstone, siltstone, shale fine clastic sedimentary rocksMesozoic
BC-M-37ForelandSedimentaryDolmitic carbonate rocks; dolmitic carbonate rocks; mudstone, siltstone, shale fine clastic sedimentary rocksPaleozoic
BC-M-38ForelandSedimentary Proterozoic
AB-M-1ForelandSedimentary Paleozoic
AB-M-2ForelandSedimentary Paleozoic

Note: See Supplementary material A for more information and 87Sr/86Sr ratios for samples. Open data from Cui et al. (2017).

Table 5.
Table 5. Raster variables used in study and source.
VariablesDescriptionSource
r.meanageGLiM age attribute (Myrs)Hartmann and Moosdorf (2012)
r.saltSalt deposition (kg.ha −1.yr −1)Vet et al. (2014)
r.distanceDistance from the ocean (km)Bataille et al. (2021)
r.volcVolcanic depositionBrahney et al. (2015)

Results and discussion

Descriptive statistics

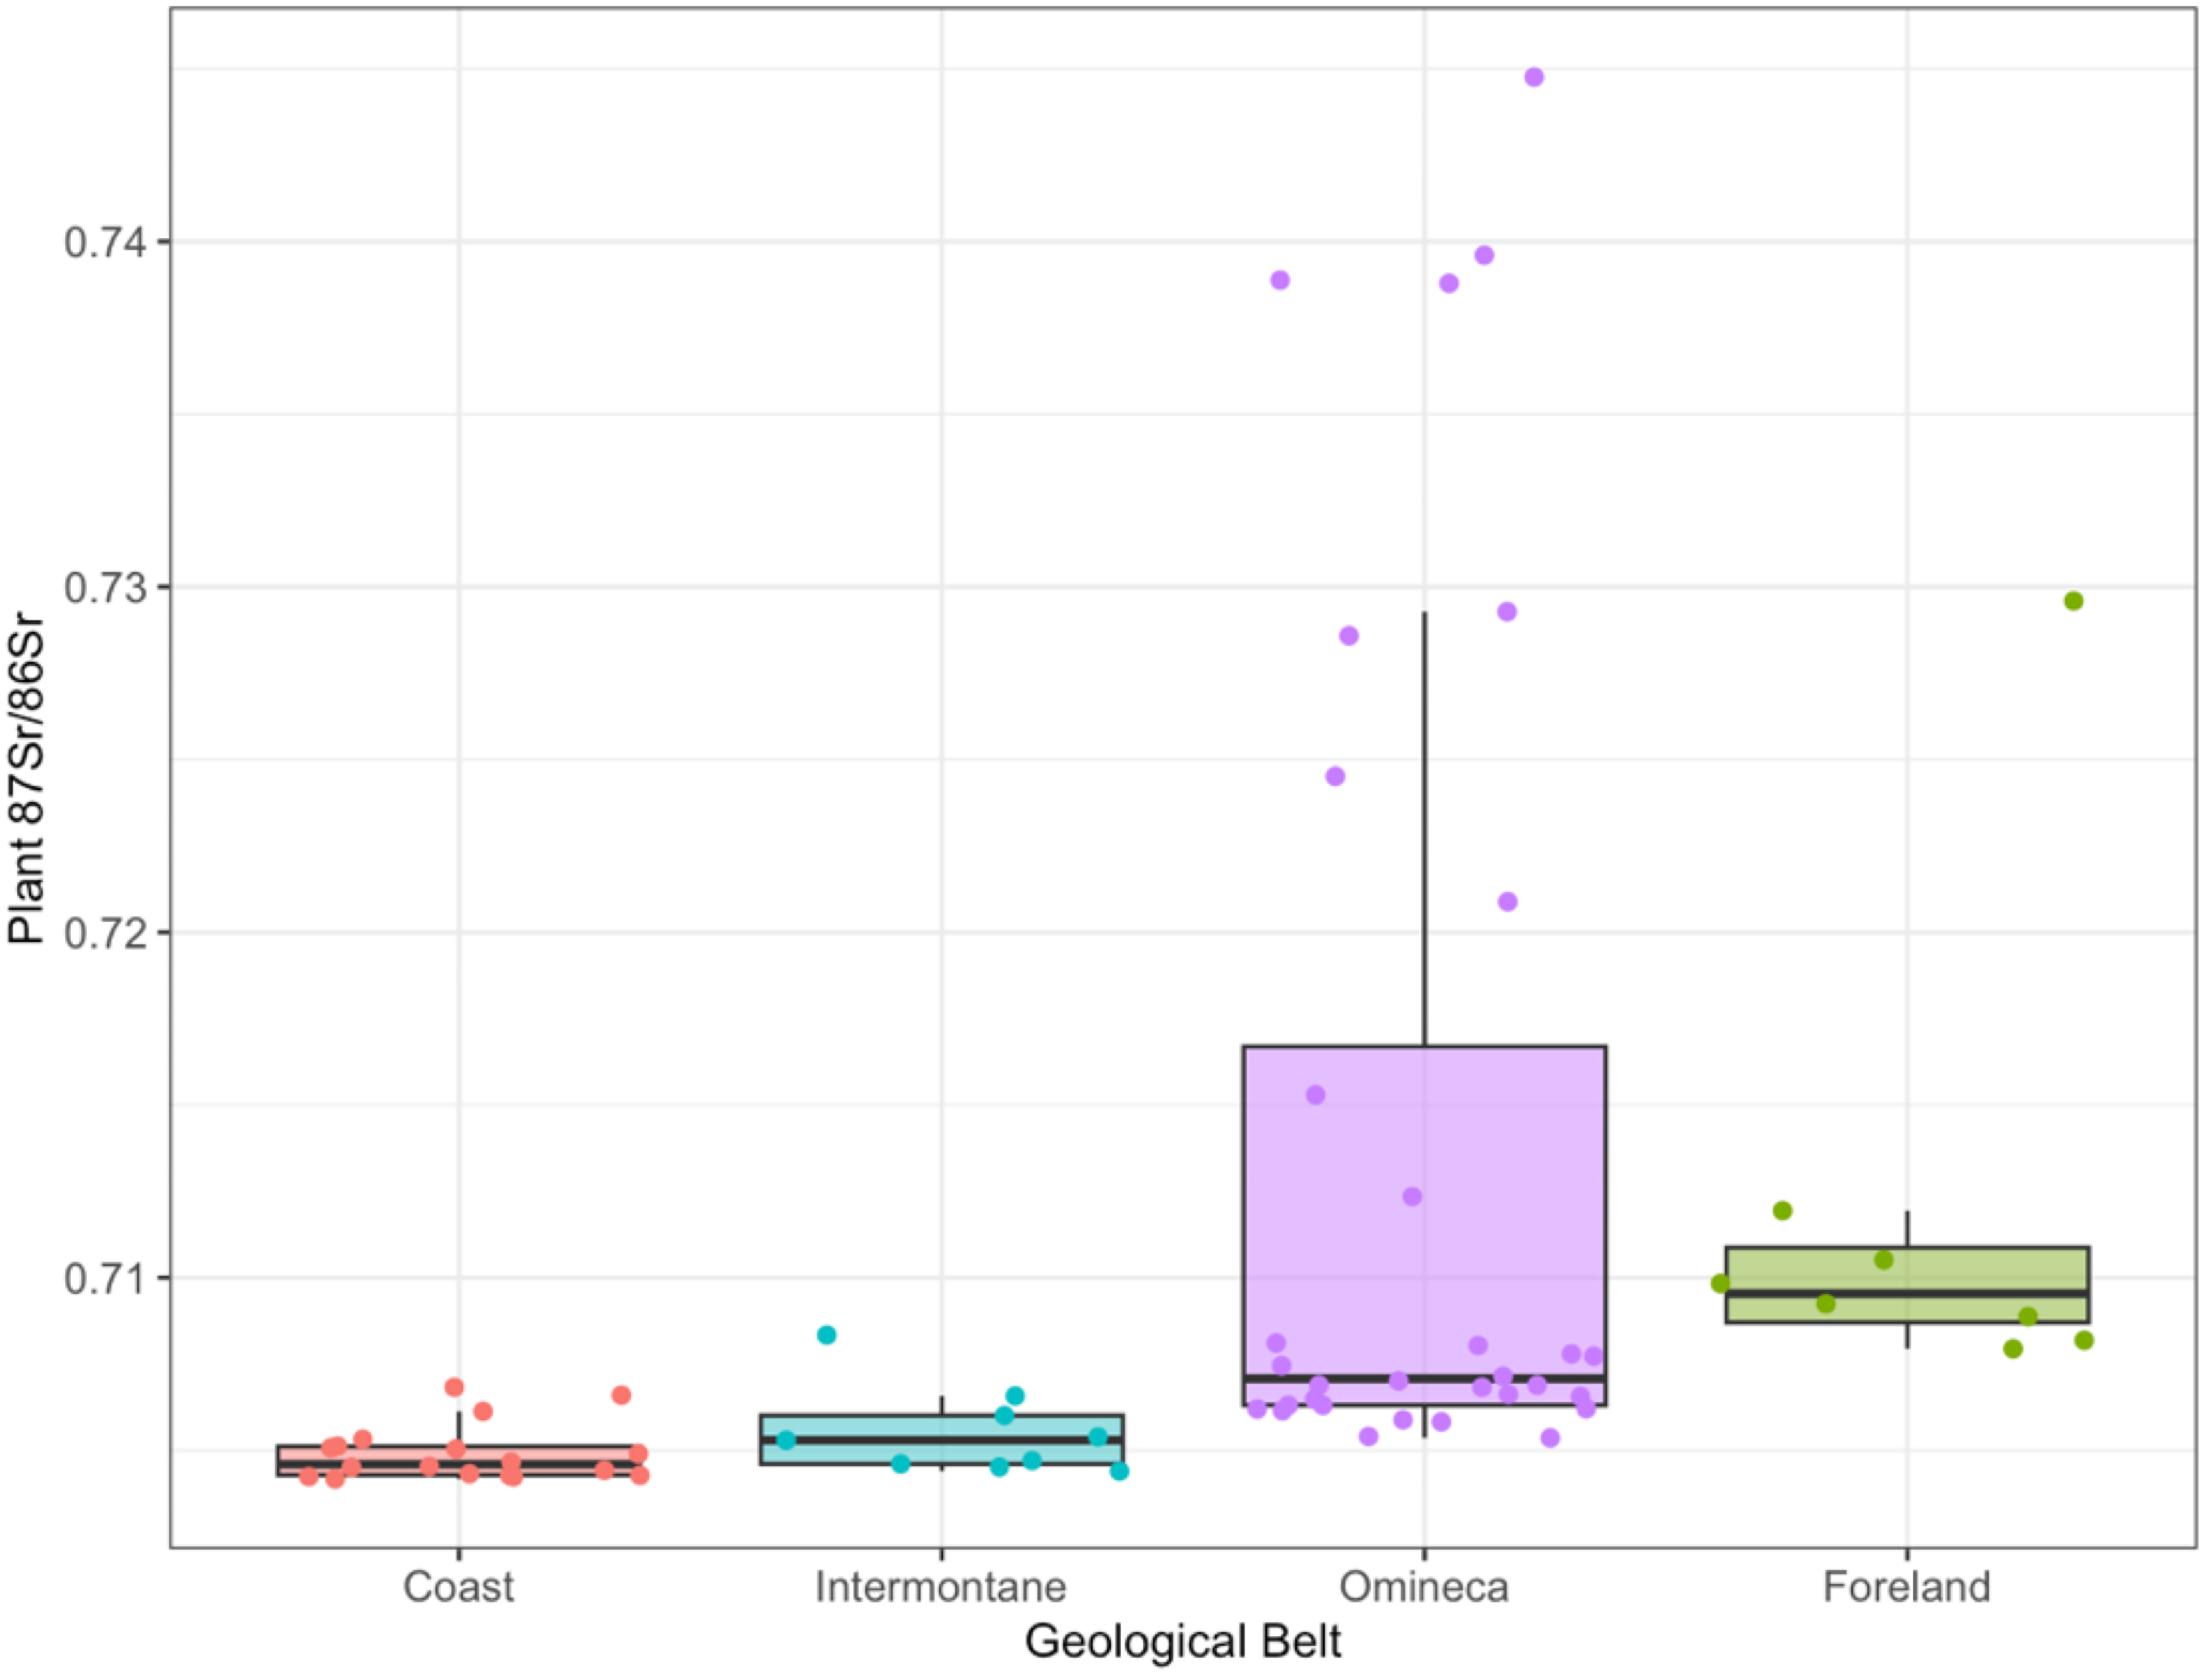
The mean 87Sr/86Sr ratio was 0.71007, ranging from 0.70417 to 0.74475 (see Table 6). The lowest ratios were found in the Coastal belt, the youngest geology in the province. The highest ratios were found in the Omineca belt, which is from the Columbia mountain range.
Table 6.
Table 6. Descriptive statistics, including n, the mean, standard error, minimum, median, and maximum of 87Sr/67Sr ratios for entire data set and the separate geological belts.
BeltnMean±MinimumMedianMaximum
All670.710070.000020.704170.706550.74475
Coastal180.704920.000020.704170.704600.70683
Intermontane90.705530.000020.704400.705290.70834
Omineca320.713750.000010.705310.707070.74475
Foreland80.712010.000020.707940.709530.72959
Kruskal–Wallis and pairwise Wilcox tests were run to determine whether the means between belts were statistically different (Copeland et al. 2011; Marchionni et al. 2016). The Kruskal–Wallis test determined statistically significant differences in the mean 87Sr/86Sr ratios between belts (Kruskal–Wallis χ2 test = 39.051, df = 3, p = 1.693e-08). Then, a pairwise Wilcox with a Bonferroni correction was run to determine which belts were statistically different from each other (Table 7). We found that Coastal and Intermontane were indistinguishable, and Omineca and Foreland were not statistically different. However, Coastal and Intermontane were statistically different from Omineca and Foreland. Dividing the province east versus west; however, this may be due to the low quantity of samples taken in the Intermontane and Foreland belts. Future sampling may provide statistically different means for all belts.
Table 7.
Table 7. Pairwise Wilcox test with Bonferroni correction of 87Sr/86Sr ratios of the geological belts; statistically significant relationship are colored green.
Geological beltCoastForelandIntermontane
Foreland7.7e-6
Intermontane0.78630.0020
Omineca1.2e-80.48940.0024
Figure 2 is a boxplot of 87Sr/86Sr ratios of the four geological belts. Importantly, the Omineca belt shows the greatest variation, which is due to the increased radiogenic 87Sr/86Sr from the Columbia mountain range that runs parallel to the Rocky mountain range. The rocks forming these ranges are dated to the Proterozoic (Cui et al. 2017). The Columbia Mountains and northern Omineca Mountains are composed of faulted and folded sedimentary rocks formed during the Proterozoic, with small outcrops of igneous, sedimentary, and foliated metamorphic rocks usually formed during the Mesozoic. Meanwhile, the foothills and highlands are dominated by intrusive igneous, foliated metamorphic, and limestone (Church and Ryder 2010). As 87Sr is formed by the radiogenic decay of 87Rb, we anticipated that the mountainous regions of the Omineca belt would have elevated 86Sr/87Sr ratios relative to the foothill and highland regions (Bentley 2006; Church and Ryder 2010). Furthermore, as the Omineca belt had significantly more samples collected, the decreased variation seen in the other belts may be due to the lower quantity of samples in those belts.
Fig. 2.
Fig. 2. Box plot of the 87Sr/86Sr ratios of the geological belts in British Columbia. Points are jittered within the plot to demonstrate 87Sr/86Sr ratios variation within each belt.

Relationships with salt deposition, distance from the ocean, and mean age of lithology
The plant 87Sr/86Sr ratios had a statistically significant relationship with the mean age of lithology (Kendall’s Tau: z = 4.5588, p = 5.144e-06, tau = 0.4) (see Supplementary material B for graphs). A tau value of 0.4 indicates a weak–moderate monotonic relationship between the mean age of the lithology and the plant 87Sr/86Sr ratios. This suggests that other environmental variables may influence the 87Sr/86Sr ratios of plants within British Columbia. We investigated whether marine salt deposition, distance from the ocean, or ash deposition may explain these 87Sr/86Sr ratios.
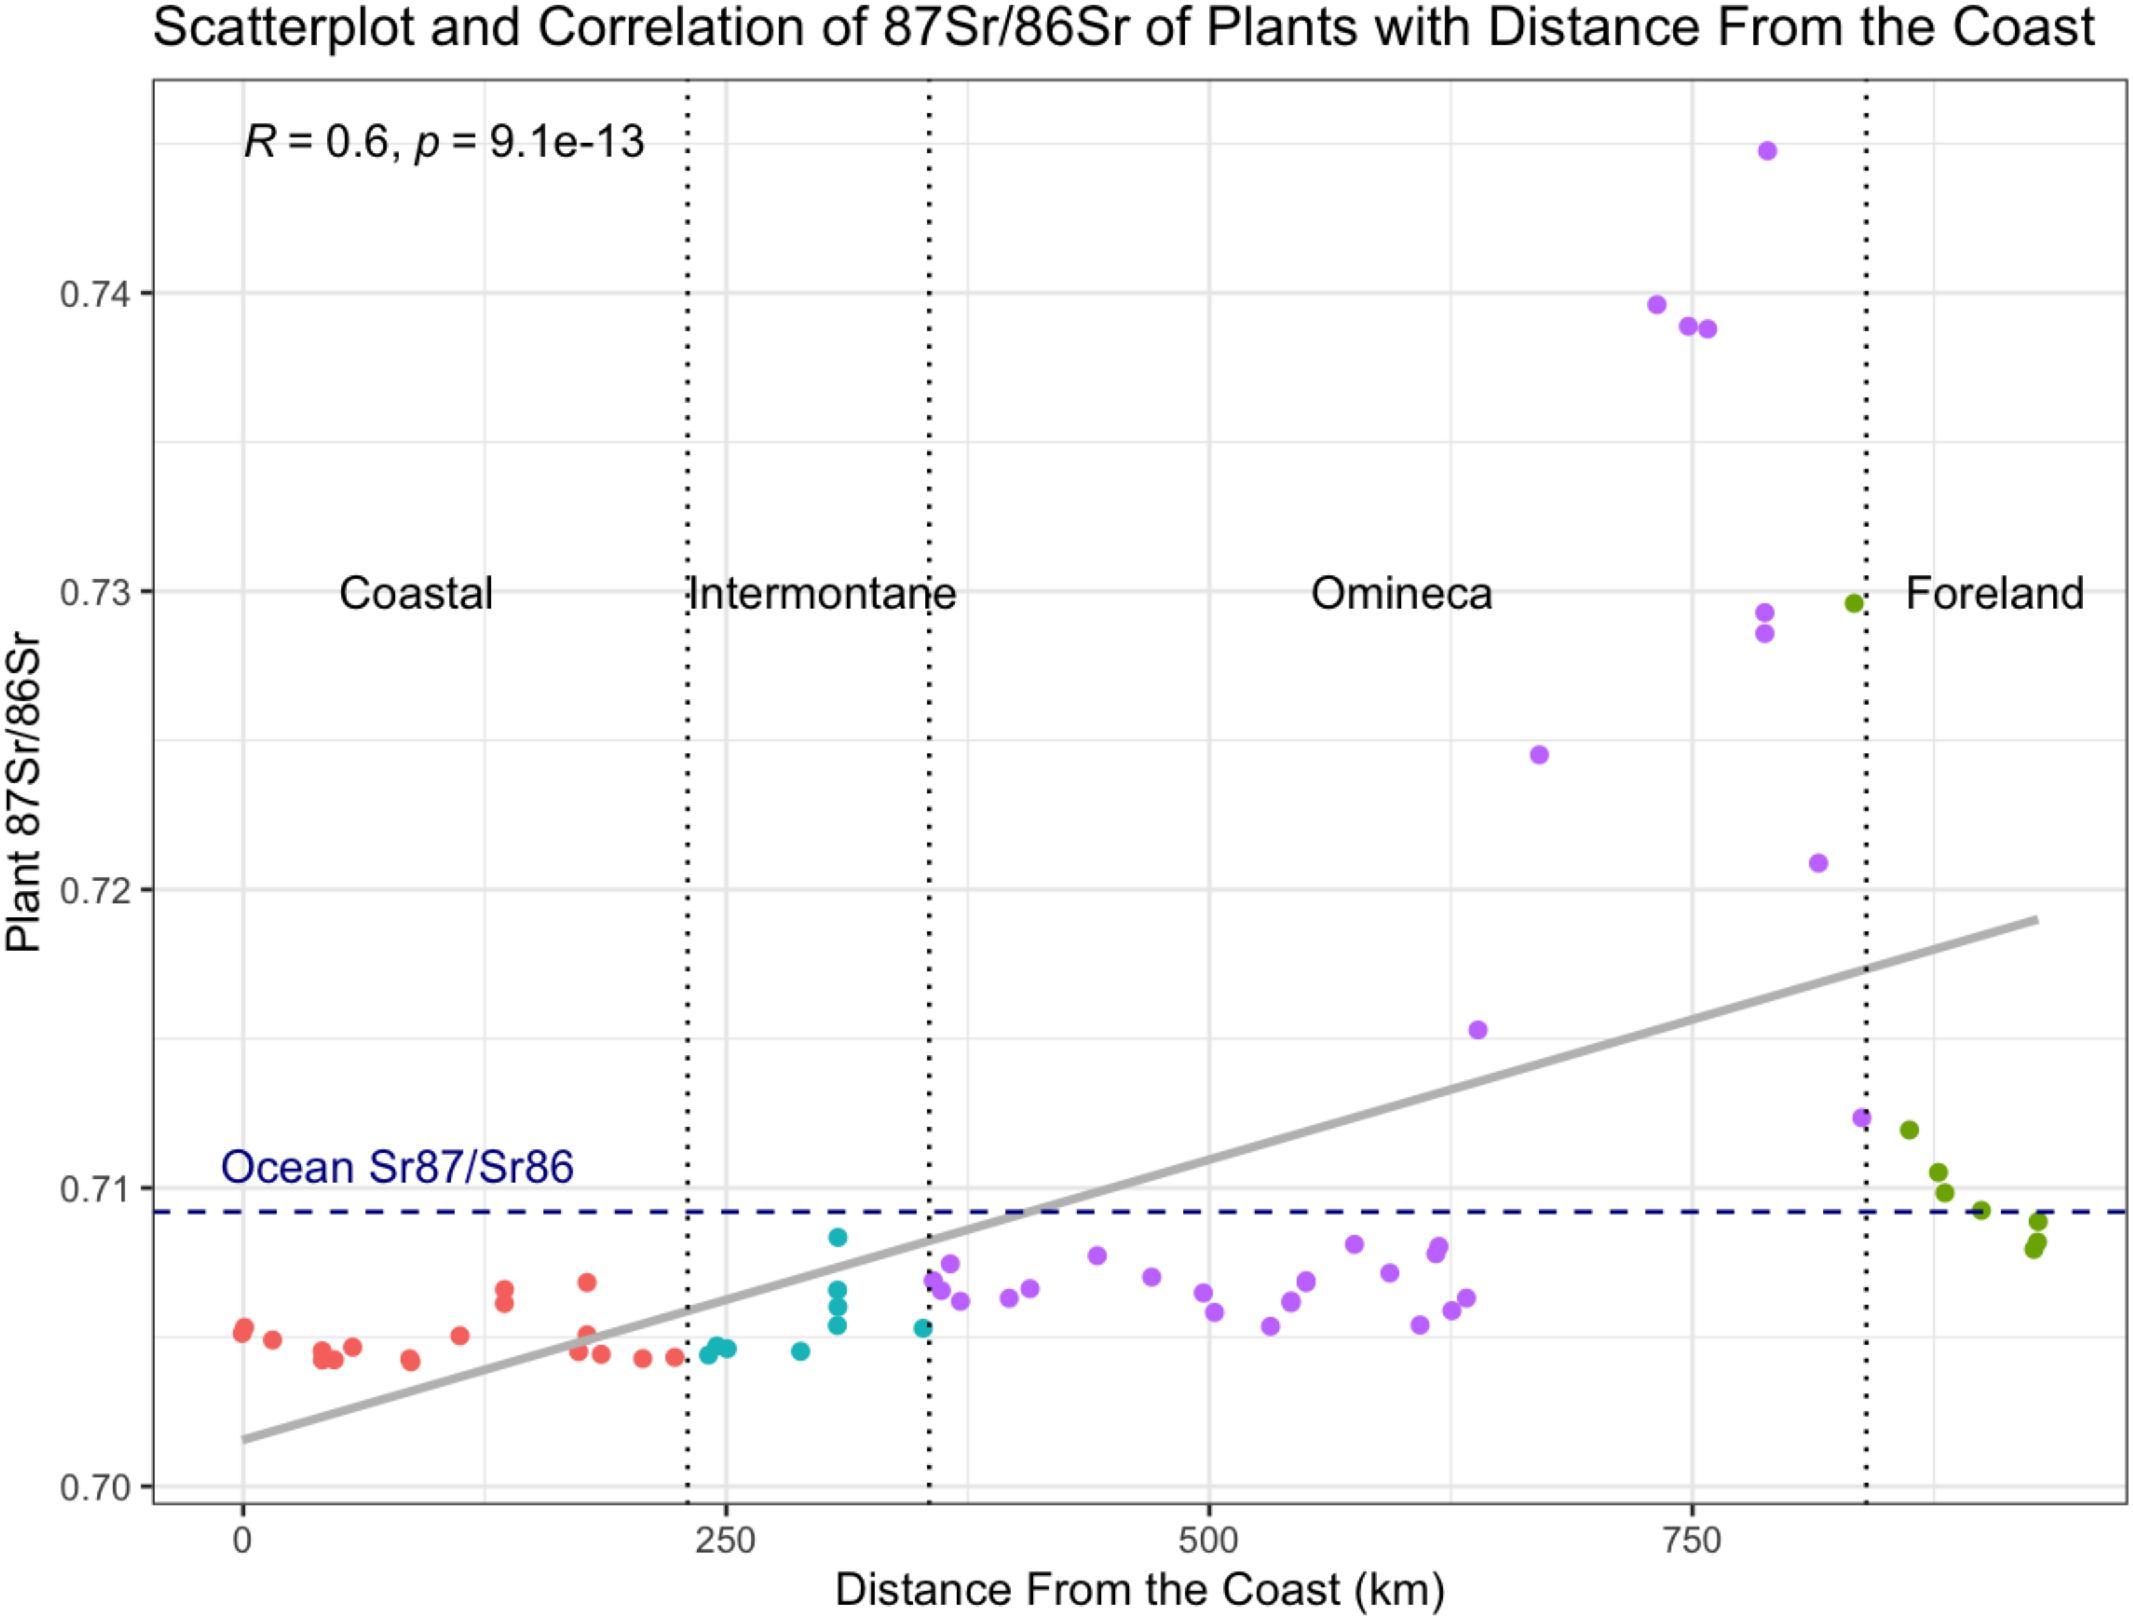
There was a strong relationship for distance from the coast (Kendall’s Tau: z = 7.1435, tau = 0.6, and p = 9.0973e-13). As the geology in British Columbia generally gets older the further inland, this suggests that the mean age of lithology can be a stronger predictor of strontium isotope ratio with increasing distance from the coast.
Notably, the samples within the Coastal belt have ratios that are much less than marine 87Sr/86Sr ratios (see Fig. 3). This may be due to large amounts of marine 87Sr/86Sr ratios being rained out over Vancouver Island/Insular Belt (not in this study), before reaching the Coastal Belt. For salt deposition, we also found a statistically significant monotonic relationship (Kendall’s Tau: z = −7.0894, tau = −0.59, p = 1.347e-12) (see supplementary material B for graphs), suggesting that as 87Sr/86Sr ratios increase, salt deposition decreases. This supports the hypothesis that marine deposition impacts plant bioavailable 87Sr/86Sr ratios; however, the average of 0.70492 for the Coastal belt is considerably lower than marine strontium ratios.
Fig. 3.
Fig. 3. Scatterplot of 87Sr/86Sr ratios and distance from the ocean, with vertical intersects for each geological belt and a horizontal intersect for the marine strontium isotope ratio. A Kendall’s Tau was calculated for the relationship between distance from the coast and plant 87Sr/86Sr ratios.
Fig. 4.
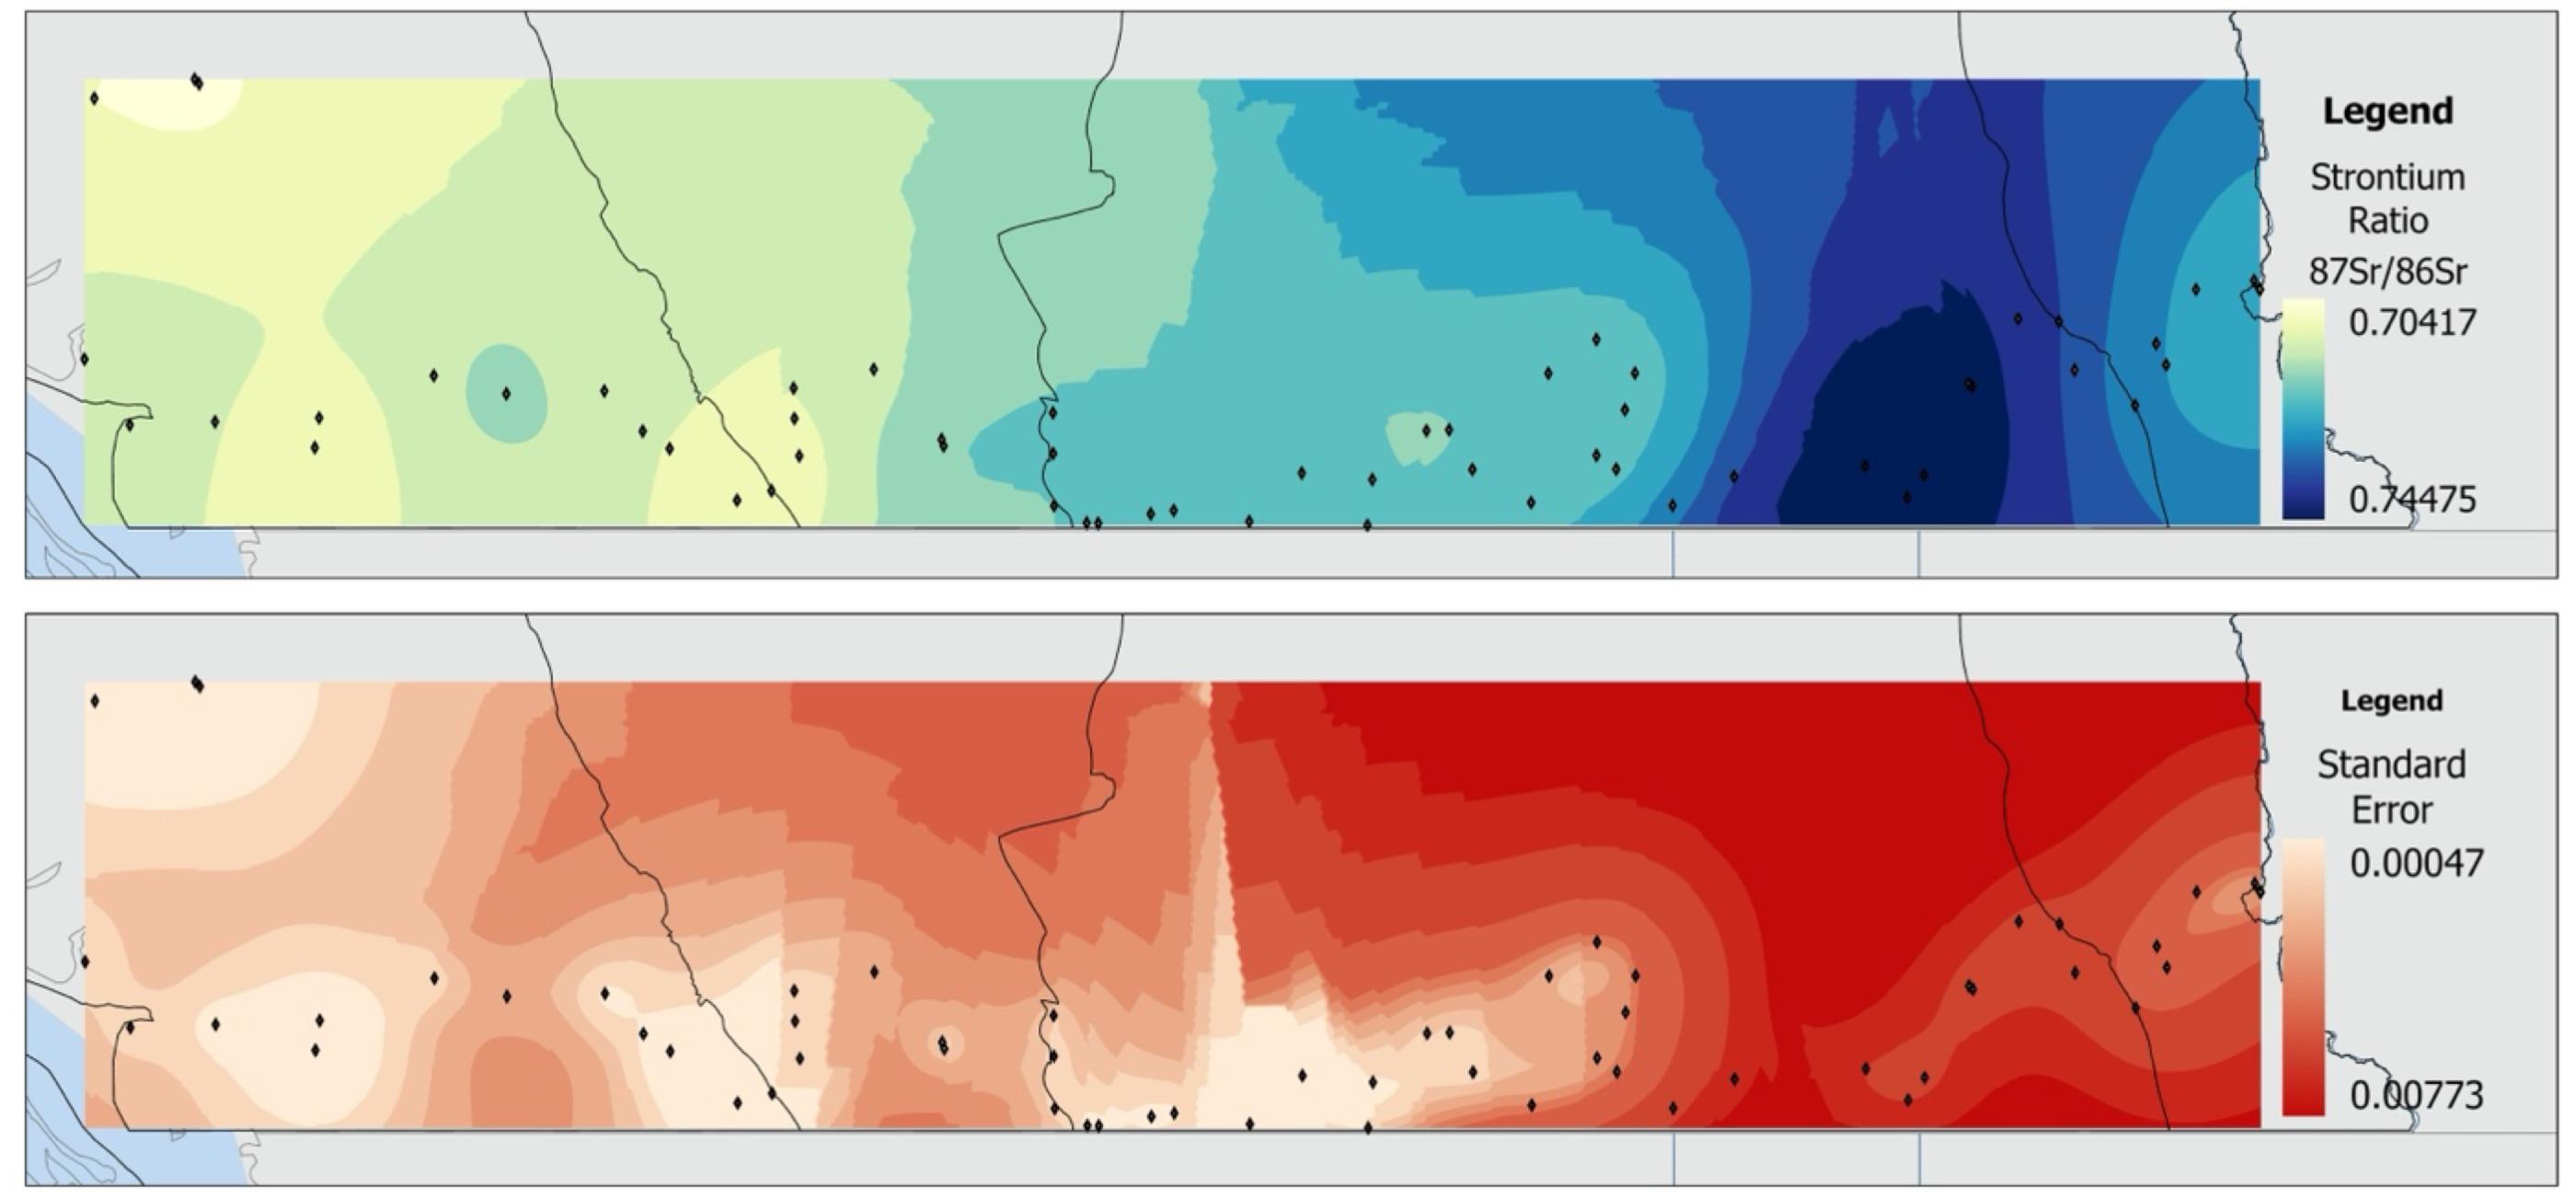
Fig. 4. Bioavailable isoscape of the southern border of British Columbia. Empirical Bayesian Kriging in ArcPro Version 3.1. Base layers (world and administrative boundaries from https://www.naturalearthdata.com/).
Lastly, volcanic deposition had a statistically significant relationship with plant 87Sr/86Sr ratios (Kendall’s tau: z = −5.1392, tau = −0.54, p = 2.729e-06) (See Supplementary material B for graphs). As the oldest geology and highest 87Sr/86Sr ratios are inland by over 600 km, it is understandable that there would be a negative association with atmospheric input, which would be more strongly correlated with coastal regions. As noted by Serna et al. (2020), the western coast of North America has received a significant quantity of ashfall over thousands of years, likely explaining the strong relationship between volcanic deposition and 87Sr/86Sr ratios. Future analysis with a larger sample and random forest regression may provide clearer results for the relationship between easterly and younger geological zones.

Isoscape

The Empirical Bayesian Kriging function permitted the creation of the isoscape and a standard error map for the predictions (Fig. 4). This analysis had an average continuous ranked probability score of 0.00119 and an average standard error of 0.00351. Importantly, the low-density sampling across complex geological zones results in a high degree of data smoothing, which may not reflect the actual 87Sr/86Sr ratios across the province. Furthermore, the low number of samples in the Intermontane and Foreland belts results in less accuracy for these lithogenic zones. As a K-Bessel model permits more flexibility based on the local polygons, it is evident that in the eastern half of the province there is more significant strontium isotope variability as this area has a greater influence from more radiogenic strontium, which results in the related error increasing dramatically. Therefore, this isoscape should be used judiciously as the standard error area increases dramatically the further the sample is from the main sampling strip and in the regions where 87Sr/86Sr ratios are more variable. The 87Sr/86Sr ratios increase as the bioavailable strontium becomes more radiogenic in the eastern parts of the province. As British Columbia’s geological history extends from the Proterozoic to the Cenozoic, predominantly from east to west, it was anticipated that the highest 87Sr/86Sr ratios would be in the Eastern Omineca and Foreland belt, while the Intermontane and Coastal would have lower ratios.

Conclusion

This study presents 87Sr/86Sr isotopic ratios of plants and a related predictive strontium ratio isoscape along southern British Columbia, Canada. Strontium isotope ratios increased further east in the province as the bedrock geology increased in age. We examined the relationships between the mean age of the lithology, salt deposition, and volcanic deposition and found statistically significant relationships in all three. Distance from the coast had the strongest association with 87Sr/86Sr ratios. As the age of the geology had the weakest association with 87Sr/86Sr ratios, we suggest that 87Sr/86Sr ratios of plants in the Coastal and Intermontane belt likely received greater influence from volcanic ash and marine deposition than the belts further inland. Through a Kruskal–Wallis test and pairwise Wilcox, we demonstrated that the mean 87Sr/86Sr ratios of the Coastal and Intermontane belts were statistically different from the Omineca and the Foreland Belts, effectively dividing the province into two (east and west) regions.

Acknowledgements

We would like to thank the two anonymous reviews and especially the editor Dr. Clement Bataille for their helpful comments and insights on the original manuscript. This research was funded by the Social Sciences and Humanities Research Council of Canada (SSHRC) through an Insight Grant to MR (435-2015-1131) and a Canada Graduate Scholarship to DT and by the Natural Sciences and Engineering Council of Canada (NSERC) through a Discovery Grant to MR (2021-03678). The acquisition of the Nu Plasma II MC-ICP-MS was funded by the National Science Foundation (grant #BCS-0922374). The Archaeometry Laboratory is supported by the National Science Foundation (grant #BCS-2208558).

References

Bartelink E.J., Chesson L.A. 2019. Recent applications of isotope analysis to forensic anthropology. Forensic Sciences Research, 4(1): 29–44.
Bataille C.P., Bowen G.J. 2012. Mapping 87Sr/86Sr variations in bedrock and water for large scale provenance studies. Chemical Geology, 304–305: 39–52.
Bataille C.P., Crowley B.E., Wooller M.J., Bowen G.J. 2020. Advances in global bioavailable strontium isoscapes. Palaeogeography, Palaeoclimatology, Palaeoecology, 555: 109849.
Bataille C.P., Holstein I.C.C.V., Laffoon J.E., Willmes M., Liu X.-M., Davies G.R. 2018. A bioavailable strontium isoscape for Western Europe: a machine learning approach. PLoS ONE, 13(5): e0197386.
Bataille C.P., Jaouen K., Milano S., Trost M., Steinbrenner S., Crubézy É., Colleter R. 2021. Triple sulfur-oxygen-strontium isotopes probabilistic geographic assignment of archaeological remains using a novel sulfur isoscape of western Europe. PLoS ONE, 16(5): e0250383–e0250383.
Bentley A. 2006. Strontium isotopes from the Earth to the archaeological skeleton: A review. Journal of Archaeological Method and Theory, 13(3): 135–187.
Böhlke J.K., Horan M. 2000. Strontium isotope geochemistry of groundwaters and streams affected by agriculture, Locust Grove, MD. Applied Geochemistry, 15(5): 599–609.
Brahney J., Mahowald N., Ward D.S., Ballantyne A.P., Neff J.C. 2015. Is atmospheric phosphorus pollution altering global alpine Lake stoichiometry? Global Biogeochemical Cycles, 29(9): 1369–1383.
Burlot J., Schollmeyer K., Renson V., Brenner-Coltrain J., Werlein A., Ferguson J.R. 2022. Defining isotopic signatures of potential procurement sources: a case study in the Mesa Verde Region of the US Southwest. Journal of Archaeological Sciences: Reports, 41: 103334.
Cannings S.G., Nelson J.O.A.L., Cannings R.J. 2011. Geology of British Columbia: a journey through. New ed., Updated ed. desLibris. Books collection. Greystone Books, Vancouver [B.C.].
Capo R.C., Stewart B.W., Chadwick O.A. 1998. Strontium isotopes as tracers of ecosystem processes: theory and methods. Geoderma, 82(1): 197–225.
Church M., Ryder J. 2010. Physiography of British Columbia. In Compendium of forest hydrology and geomorphology in British Columbia. Land management handbook 66. Edited by R.G. Pike, Redding T.E., Moore R.D., Winkler R., Bladon K. Ministry of Forests and Range, Victoria, B.C.
Coelho I., Castanheira I., Bordado J.M., Donard O., Silva J.A.L. 2017. Recent developments and trends in the application of strontium and its isotopes in biological related fields. TrAC Trends in Analytical Chemistry, 90: 45–61.
Copeland S.R., Sponheimer M., Ruiter D.J., Lee-Thorp J.A., Codron D., Roux P.J., et al. 2011. Strontium isotope evidence for landscape use by early hominins. Nature, 474(7349): 76–78.
Cui Y., Miller D., Schiarizza P., Diakow L.J. 2017. British Columbia digital geology. British Columbia Ministry of Energy, Mines and Petroleum Resources, British Columbia Geological Survey Open File 2017-8. 9p. Data version 2019-12-19.
De Muynck D., Huelga-Suarez G., Van Heghe L., Degryse P., Vanhaecke F. 2009. Systematic evaluation of a strontium-specific extraction chromatographic resin for obtaining a purified Sr fraction with quantitative recovery from complex and Ca-rich matrices. Journal of Analytical Atomic Spectrometry, 24: 1498–1510.
Emery M.V., Stark R.J., Murchie T.J., Elford S., Schwarcz H.P., Prowse T.L. 2018. Mapping the origins of imperial Roman workers (1st–4th century CE) at Vagnari, Southern Italy, using 87Sr/86Sr and δ18O variability. American Journal of Physical Anthropology,166(4): 837–850.
Evans J.A., Montgomery J., Wildman G., Boulton N. 2010. Spatial variations in biosphere 87 Sr/86 Sr in Britain. Journal of the Geological Society, 167(1):1–4.
Fietzke J., Eisenhauer A. 2006. Determination of temperature-dependent stable strontium isotope (88Sr/86Sr) fractionation via bracketing standard MC-ICP-MS. Geochemistry, Geophyiscs, Geosystems, 7(8).
Hartman G., Richards M. 2014. Mapping and defining sources of variability in bioavailable strontium isotope ratios in the Eastern Mediterranean. Geochimica et Cosmochimica Acta, 126: 250–264.
Hartmann J., Moosdorf N. 2012. The new global lithological map database GLiM: a representation of rock properties at the Earth surface. Geochemistry, Geophysics, Geosystems, 13(12): [accessed 7 January 2024].
Hodell D.A., Quinn R.L., Brenner M., Kamenov G. 2004. Spatial variation of strontium isotopes (87Sr/86Sr) in the Maya region: a tool for tracking ancient human migration. Journal of Archaeological Science, 31(5): 585–601.
Holt E., Evans J.A., Madgwick R. 2021. Strontium (87Sr/86Sr) mapping: a critical review of methods and approaches. Earth-Science Reviews, 216: 103593.
Knudson K.J., Williams H.M., Buikstra J.E., Tomczak P.D., Gordon G.W., Anbar A.D. 2010. Introducing δ88/86Sr analysis in archaeology: a demonstration of the utility of strontium isotope fractionation in paleodietary studies. Journal of Archaeological Science, 37(9): 2352–2364.
Kramer R.T., Kinaston R.L., Holder P.W., Armstrong K.F., King C.L., Sipple W.D.K., et al. 2022. A bioavailable strontium (87Sr/86Sr) isoscape for Aotearoa New Zealand: implications for food forensics and biosecurity. PLoS ONE, 17(3): e0264458.
Krivoruchko K., Gribov A. 2019. Evaluation of empirical Bayesian kriging. Spatial Statistics, 32: 100368.
Lewis J., Pike A.W.G., Coath C.D., Evershed R.P. 2017. Strontium concentration, radiogenic (87Sr/86Sr) and stable (δ88Sr) strontium isotope systematics in a controlled feeding study. STAR: Science & Technology of Archaeological Research, 3(1): 45–57.
Makarewicz C.A., Sealy J. 2015. Dietary reconstruction, mobility, and the analysis of ancient skeletal tissues: expanding the prospects of stable isotope research in archaeology. Journal of Archaeological Science, 56: 146–158.
Marchionni S., Buccianti A., Bollati A., Braschi E., Cifelli F., Molin P., et al. 2016. Conservation of 87Sr/86Sr isotopic ratios during the winemaking processes of ‘Red’ wines to validate their use as geographic tracer. Food Chemistry, 190: 777–785.
Maurer A.-F., Galer S.J.G., Knipper C., Beierlein L., Nunn E.V., Peters D., et al. 2012. Bioavailable 87Sr/86Sr in different environmental samples—effects of anthropogenic contamination and implications for isoscapes in past migration studies. Science of the Total Environment, 433: 216–229.
McArthur J.M., Howarth R.J., Bailey T.R. 2001. Strontium isotope stratigraphy: LOWESS version 3: best fit to the marine Sr-isotope curve for 0–509 ma and accompanying look-up table for deriving numerical age. The Journal of Geology, 109(2): 155–170.
Pattison D.R.M., Moynihan D.P., McFarlane C.R.M., Simony P.S., Cubley J.F. 2020. Field guide to the geology, metamorphism and tectonics of the Foreland and Omineca belts of SW Alberta and SE British Columbia [accessed 1 August 2023].
Price T.D., Burton J.H., Bentley R.A. 2002. The characterization of biologically available strontium isotope ratios for the study of prehistoric migration. Archaeometry, 44(1): 117–135.
Probst A., El Gh'mari A., Aubert D., Fritz B., McNutt R. 2000. Strontium as a tracer of weathering processes in a silicate catchment polluted by acid atmospheric inputs, Strengbach, France. Chemical Geology, 170(1): 203–219.
Serna A., Prates L., Mange E., Salazar-García D.C., Bataille C.P. 2020. Implications for paleomobility studies of the effects of quaternary volcanism on bioavailable strontium: a test case in North Patagonia (Argentina). Journal of Archaeological Science, 121: 105198.
Thirlwall M.F. 1991. Long-term reproducibility of multicollector Sr and Nd isotope ratio analysis. Chemical Geology, 94: 85–104.
Vet R., Artz R.S., Carou S., Shaw M., Ro C.-U.N., Aas W., et al. 2014. A global assessment of precipitation chemistry and deposition of sulfur, nitrogen, sea salt, base cations, organic acids, acidity and pH, and phosphorus. Atmospheric Environment, 93: 3–100.
Wooller M.J., Bataille C., Druckenmiller P., Erickson G.M., Groves P., Haubenstock N., et al. 2021. Lifetime mobility of an Arctic woolly mammoth. Science, 373(6556): 806–808.

Supplementary material

Supplementary Material 1 (XLSX / 21.0 KB).
Supplementary Material 2 (DOCX / 313 KB).
Supplementary Material 3 (R / 6.59 KB).

Information & Authors

Information

Published In

cover image FACETS
FACETS
Volume 9Number 1January 2024
Pages: 1 - 11
Editor: Clément Bataille

History

Received: 2 October 2023
Accepted: 15 March 2024
Version of record online: 24 July 2024

Data Availability Statement

All isotope data are available within the supplementary materials. Data for the geology of British Columbia can be found at the British Columbia Geological Survey.

Key Words

  1. strontium
  2. isotope analysis
  3. bioavailable
  4. British Columbia
  5. Canada

Sections

Subjects

Plain Language Summary

Strontium Isotope Ratio Map of Southern British Columbia, Canada for Mobility and Migration Studies

Authors

Affiliations

Department of Archaeology, Simon Fraser University, 8888 University Drive West, Burnaby, BC V5A 1S6, Canada
Author Contributions: Investigation, Methodology, Visualization, Writing – original draft, and Writing – review & editing.
Joe Hepburn
Department of Archaeology, Simon Fraser University, 8888 University Drive West, Burnaby, BC V5A 1S6, Canada
Author Contributions: Data curation, Formal analysis, Investigation, Writing – original draft, and Writing – review & editing.
Virginie Renson
University of Missouri Research Reactor, Columbia, MO 65211, USA
Author Contributions: Formal analysis, Investigation, Methodology, Resources, Writing – original draft, and Writing – review & editing.
Michael Richards
Department of Archaeology, Simon Fraser University, 8888 University Drive West, Burnaby, BC V5A 1S6, Canada
Author Contributions: Conceptualization, Data curation, Formal analysis, Funding acquisition, Investigation, Methodology, Project administration, Resources, Supervision, Writing – original draft, and Writing – review & editing.

Author Contributions

Conceptualization: MR
Data curation: JH, MR
Formal analysis: JH, VR, MR
Funding acquisition: MR
Investigation: DT, JH, VR, MR
Methodology: DT, VR, MR
Project administration: MR
Resources: VR, MR
Supervision: MR
Visualization: DT
Writing – original draft: DT, JH, VR, MR
Writing – review & editing: DT, JH, VR, MR

Competing Interests

The authors declare no competing interests.

Funding Information

National Science Foundation: BCS-0922374, BCS-2208558

Metrics & Citations

Metrics

Other Metrics

Citations

Cite As

Export Citations

If you have the appropriate software installed, you can download article citation data to the citation manager of your choice. Simply select your manager software from the list below and click Download.

There are no citations for this item

View Options

View options

PDF

View PDF

Get Access

Media

Media

Other

Tables

Share Options

Share

Share the article link

Share on social media